. 2022 Jun;606(7913):396-405.
doi: 10.1038/s41586-022-04774-2. Epub 2022 Jun 1.

Stromal changes in the aged lung induce an emergence from melanoma dormancy

Affiliations

Stromal changes in the aged lung induce an emergence from melanoma dormancy

Mitchell E Fane et al. Nature. 2022 Jun.

Erratum in

Abstract

Disseminated cancer cells from primary tumours can seed in distal tissues, but may take several years to form overt metastases, a phenomenon that is termed tumour dormancy. Despite its importance in metastasis and residual disease, few studies have been able to successfully characterize dormancy within melanoma. Here we show that the aged lung microenvironment facilitates a permissive niche for efficient outgrowth of dormant disseminated cancer cells-in contrast to the aged skin, in which age-related changes suppress melanoma growth but drive dissemination. These microenvironmental complexities can be explained by the phenotype switching model, which argues that melanoma cells switch between a proliferative cell state and a slower-cycling, invasive state1-3. It was previously shown that dermal fibroblasts promote phenotype switching in melanoma during ageing4-8. We now identify WNT5A as an activator of dormancy in melanoma disseminated cancer cells within the lung, which initially enables the efficient dissemination and seeding of melanoma cells in metastatic niches. Age-induced reprogramming of lung fibroblasts increases their secretion of the soluble WNT antagonist sFRP1, which inhibits WNT5A in melanoma cells and thereby enables efficient metastatic outgrowth. We also identify the tyrosine kinase receptors AXL and MER as promoting a dormancy-to-reactivation axis within melanoma cells. Overall, we find that age-induced changes in distal metastatic microenvironments promote the efficient reactivation of dormant melanoma cells in the lung.


Figures

Extended Data Fig. 1 |
Extended Data Fig. 1 |. Aged lung versus skin fibroblasts promote opposing melanoma phenotypes.
a, b, 5 Young (8 week) and aged (>52 week) C57BL6 mice per group were subdermally injected with 2.5×10⁵ Yumm1.7 mCherry-labelled mouse melanoma cells. Lungs were collected and PFA embedded from 5 tumour bearing young and aged mice at week 3 and 5. IHC was performed using an mCherry antibody. Lung sections were analysed and quantified for the average number of single cell colonies per high powered frame (20 x) across entire lung sections and presented as mean +/− SEM. A student’s two-way t-test was performed P = 0.3064 for 3 weeks and P = 0.2011 for 5 weeks. c, d, e 2.5 ×10⁵ Yumm1.7 melanoma cells were intradermally implanted into 3 C57BL6 aged mice (>52 weeks) per group. Tumours were left to grow for three weeks. Mice underwent survival surgery to allow excision of the primary tumour. After 5 total weeks, Lungs were taken, PFA embedded and underwent IHC analysis for the number of mCherry positive colonies (>10 mCherry positive cells per lesion) per section (p = 0.2879) along with the average number of single cell colonies per high powered frame (20 x) across entire lung sections (p = 0.081) presented as mean +/− SEM. A student’s two-way t-test was performed with P < 0.05 designated as significant. Representative images were displayed across three independent mouse lung samples for mCherry positive cells and Ki-67 across subsequent sections with the scale bar representing 100um. f, g, h Collagen sandwich reconstructions were formed with healthy human lung or skin fibroblasts from young (>35) or aged (> 55) patients in the top and bottom layer. The middle layer contained FS4 GFP human melanoma cells seeded at the same density at day 0. GFP positive melanoma cells were imaged using an automated Nikon TI and an average count per field was quantified using imaging software NIS elements at day 4. Representative images are displayed for each condition (N = 3 independent wells in triplicate). A student’s two-way t-test was performed. P = 0.0432 for FS4 lung and P = 0.0088 for FS4 skin. i, j Western blot analysis was performed on primary tumour protein lysate from 5 young and 5 aged mice investigating dormancy and proliferative associated expression. HSP90 was used as a loading control.
Extended Data Fig. 2 |
Extended Data Fig. 2 |. Aged lung conditioned medium promotes melanoma outgrowth in vitro.
a, b, FS13 c, d FS4 e, f FS14 g, h and 1205Lu GFP melanoma cells were seeded at a density of 2×10⁴. Cells were then grown over a 10-day period in conditioned medium from young or aged lung or skin fibroblasts and underwent counting using a haemocytometer at days 3, 5 and 10 and were further assessed via automated counting using NIS elements. Experiment was performed in biological triplicates with 3 technical replicates each. A two-way ANOVA was performed with a post-hoc Holm-Sidak’s multiple comparisons test for each time point. P-values were taken from day 10. **** = P < 0.0001. ** P = 0.0084 for Fig. 2d. Data were presented as the mean +/− the SEM for each time point.
Extended Data Fig. 3 |
Extended Data Fig. 3 |. sFRP1 promotes melanoma outgrowth.
a, b, Protein lysate was collected from 1205Lu human melanoma cells treated with young (under 35) or aged (over 55) lung or skin fibroblast conditioned medium over a 5-day period. Western blot analysis was performed examining NR2F1, H2AFZ, Filamin A, Cleaved Filamin A, ROR2 and ROR1. HSP90 was used as a loading control. c, d Protein lysate was collected from FS4 human melanoma cells treated with young or aged lung or skin fibroblast conditioned medium over a 5-day period. Western blot analysis was performed examining dormant (WNT5A, AXL, p21, p27 P-p38. p-PKC, NR2f1, Filamin A, Cleaved Filamin A, ROR2) and proliferative (β-catenin, H2AFZ, MER, MITF, ROR1) melanoma markers. HSP90 was used as a loading control. e FS4 melanoma cells were treated with 500ng/ml of recombinant sFRP1, and protein expression was assessed after 5 days via western blot. HSP90 was used as a loading control. f Proliferation of the above cells was assessed by seeding them at a density of 2×10⁴. Cells were then grown over a 10-day period while being treated with 500 ng of r-sFRP1 or a PBS control (Experiment was performed in biological triplicates with 3 technical replicates each) every 2 days and assessed for proliferation at days 3–5 and 10 using a haemocytometer and further assessed using automated counting via NIS elements. A two-way ANOVA was performed with a post-hoc Holm-Sidak’s multiple comparisons test for each time point. P-values were taken from day 10. Data were presented as the mean +/− the SEM for each time point. P < 0.0001 g Aged lung human fibroblasts were transduced with lentiviral sh-sFRP1 or scrambled control vectors. Conditioned medium was taken from fibroblasts after 72 h and FS4 melanoma cells were then grown in this conditioned medium or a DMEM control medium, with proliferation assessed over 10 days. Experiment was performed in biological triplicates with 3 technical replicates each. A two-way ANOVA was performed with a post-hoc Holm-Sidak’s multiple comparisons test for each time point. P-values were taken from day 10. **** = P < 0.0001 for Aged conditioned medium compared to both Aged conditioned medium in SHsFRP1 and DMEM conditions. Data were presented as the mean +/− the SEM for each time point. h Protein lysate was collected from the lungs of 5 young and 5 aged healthy mouse tissues. Western blot analysis was performed looking at sFRP1. HSP90 was used as a loading control. i Protein lysate was taken from healthy human young vs aged lung fibroblasts and a 1205Lu human melanoma cell line. Western blot analysis was performed examining sFRP1 and sFRP2 expression and HSP90 was used as a loading control. j Protein lysate was taken from two independent young lung fibroblasts, treated with conditioned medium from intrinsically WNT5A-low and WNT5A-high melanoma cells for 48 h and was compared with two independent aged lung fibroblasts for sFRP1 expression. HSP90 was used as a loading control.
Extended Data Fig. 4 |
Extended Data Fig. 4 |. WNT5A regulates dormant pathways and slows proliferation.
a, b, Five aged mice per group were intradermally injected with 2.5×10⁵ Yumm1.7 mCherry melanoma cells. After three weeks of tumour growth, mice were treated with 1 mg/kg of a neutralizing sFRP1 or an IgG control antibody via IP injection every 4 days. Representative images are displayed across three independent mice for mCherry positive cells and Ki-67. The number of single cell (>10 mCherry positive cells) was assessed at week 5 and quantified per section and presented as mean +/− SEM. Scale bar represents 100 um. A student’s two-way t-test was performed. P = 0.244 c Protein expression analysis was performed on WNT5A low human melanoma samples (FS13, FS14) that underwent lentiviral induced overexpression of WNT5A. HSP90 was used as a loading control. d, e FS13 and FS14 WNT5A overexpressing mCherry human melanoma cells were seeded at a density of 2×10⁴. Cells were then grown over a 10-day period and assessed for proliferation at days 3–5 and 10 using a haemocytometer and further assessed using automated counting via NIS elements. Experiment was performed in biological triplicates with 3 technical replicates each. A two-way ANOVA was performed with a post-hoc Holm-Sidak’s multiple comparisons test for each time point. P-values were taken from day 10. Data were presented as the mean +/− the SEM for each time point. P < 0.0001 for both conditions. f FS13 GFP melanoma cells were seeded at a density 2×10⁴. Cells were treated with 200ng of r-WNT5A every 2 days and assessed for proliferation at days 3–5 and 10 using a haemocytometer and further assessed using automated counting via NIS elements. Experiment was performed in biological triplicates with 3 technical replicates each. A two-way ANOVA was performed with a post-hoc Holm-Sidak’s multiple comparisons test for each time point. P-values were taken from day 10. Data were presented as the mean +/− the SEM for each time point. P < 0.0001 g Western blot analysis was performed on protein lysates from FS13 melanoma cells treated with 200ng of recombinant WNT5A for five days. HSP90 was used as a loading control.
Extended Data Fig. 5 |
Extended Data Fig. 5 |. WNT5A promotes in vivo metastatic dormancy.
a, TCGA analysis of relative mRNA expression of WNT5A in patient tumour samples comparing primary vs metastatic (distant mets only) tissue sites and presented as a violin plot, with quartiles represented by black lines and the median by the broken line (N=104, 68). A student’s two-way t-test was performed. P = 0.003 b Western blot analysis was performed on protein lysate from Yumm1.7 doxycycline (Dox) inducible shWnt5a mCherry melanoma cells comparing control and Dox (0.5ug/ml) treated cells over 48 h. HSP90 was used as a loading control. c Yumm1.7 Dox-inducible shWnt5a mCherry cells were seeded at a density of 2×10⁴ and assessed for proliferation at days 3–5 and 10 using a haemocytometer and further assessed using automated counting via NIS elements. Experiment was performed in biological triplicates with 3 technical replicates each. A two-way ANOVA was performed with a post-hoc Holm-Sidak’s multiple comparisons test for each time point. P-values were taken from day 10. Data were presented as the mean +/− the SEM for each time point. P < 0.0001. d Tumour volumes from young mice (N = 9 for Dox Day 21, N = 8 for Dox Day 3 and No Dox due to mouse death) subdermally injected with 2.5×10⁵ Yumm1.7 Dox inducible shWnt5a mCherry melanoma cells. Mice were treated with Dox (2ug/ml in water) from day 3 or day 21 onwards, with tumours measured for 5 weeks. A two-way ANOVA was performed with a post-hoc Holm-Sidak’s multiple comparisons test for each time point. P-values were taken from day 37. Data were presented as the mean +/− the SEM for each time point. **** P < 0.0001, ** P = 0.0038. e, f 5 young mice per group were intradermally injected with 2.5×10⁵ Yumm1.7 Dox inducible shWnt5a mCherry melanoma cells. Mice were treated with Dox (2 mg/mL in water) from day 3 (Dox day 3) or day 21 onwards (Dox day 21), with tumours measured for 5 weeks. Lungs were taken, PFA embedded and underwent IHC analysis of mCherry positive melanoma cells. Representative images are displayed across three independent mice for mCherry positive cells and Ki-67 with the scale bar representing 100um. Given that the no Dox and Dox day 3 groups failed to produce larger lesions, these groups were assessed for the average number of single cell colonies per high powered frame (20 x) across entire lung sections and presented as mean +/− SEM. A student’s two-way t-test was performed. P = 0.0224. g Tumour volumes from 6 aged mice subdermally injected with 2.5×10⁵ Yumm1.7 Dox inducible WNT5A overexpressing mCherry melanoma cells. Mice were treated with Dox (2 ug/ml in water) from day 3 or day 21 onwards, with tumours measured for 5 weeks. A two-way ANOVA was performed with a post-hoc Holm-Sidak’s multiple comparisons test for each time point. P-values were taken from day 37. Data were presented as the mean +/− the SEM for each time point. * P = 0.0235 comparing No Dox with Dox Day 3. h Yumm1.7 Dox-inducible WNT5A mCherry cells were seeded at a density of 2×10⁴ and assessed for proliferation at days 3–5 and 10 using a haemocytometer and further assessed using automated counting via NIS elements. Experiment was performed in biological triplicates with 3 technical replicates each. A two-way ANOVA was performed with a post-hoc Holm-Sidak’s multiple comparisons test for each time point. P-values were taken from day 10. Data were presented as the mean +/− the SEM for each time point. P < 0.0001. i, j 5 Aged mice per group were subdermally injected with 2.5×10⁵ Yumm1.7 Dox inducible WNT5A overexpressing mCherry melanoma cells. Mice were treated with Dox (2 ug/ml in water) from day 3 (Dox day 3) and day 21 (Dox day 21) with tumours measured for 5 weeks. Lungs were taken, PFA embedded and underwent IHC analysis of mCherry positive melanoma cells. Representative images are displayed across three independent mice for mCherry positive cells and Ki-67. Given that the Dox day 3 and Dox day 21 groups failed to produce larger lesions, these groups were further assessed for the average number of single cell colonies per high powered frame (20 x) across entire lung sections and presented as mean +/− SEM. A student’s two-way t-test was performed. P = 0.001.
Extended Data Fig. 6 |
Extended Data Fig. 6 |. Role of MER and AXL in metastatic dormancy and reactivation.
a, b, Analysis of melanoma cell lines from the Cancer Cell line Encyclopedia (CCLE) dataset were performed on human samples stratified into the top (AXL high) and bottom (AXL low) 50th percentile of AXL expression (N = 30) and presented as a heat map of the average Z-score. An unpaired two-way t-test was performed on each condition, investigating previously established dormancy and proliferative genes, with P < 0.05 considered significant. c, d Analysis of MER high and MER low cells from the CCLE as described above. e TCGA analysis of relative mRNA expression of MER in patient tumour samples comparing primary vs metastatic (distant metastases only) tissue sites and presented as a violin plot, with quartiles represented by black lines and the median by the broken line (N = 104, 68). A student’s two-way t-test was performed. P = 0.0023. f 1205Lu shAXL and control human mCherry melanoma cells were seeded at a density of 2×10⁴. Cells were then grown over a 10-day period and assessed for proliferation at days 3–5 and 10 using a haemocytometer and further assessed using automated counting via NIS elements. Experiment was performed in biological triplicates with 3 technical replicates each. A two-way ANOVA was performed with a post-hoc Holm-Sidak’s multiple comparisons test for each time point. P-values were taken from day 10. Data were presented as the mean +/− the SEM for each time point. P = 0.0160 (AXL SH1) and P = 0.340 (AXL SH2) when compared with the negative control group. g Protein expression analysis was performed on protein lysates of lentiviral induce shRNA knockdown of MER in FS14 human melanoma cells. HSP90 was used as a loading control. h, i FS13 and FS14 shMER and control human mCherry melanoma cells were seeded at a density of 2×10⁴. Cells were then grown over a 10-day period and assessed for proliferation at days 3–5 and 10 using a haemocytometer and further assessed using automated counting via NIS elements. Experiment was performed in biological triplicate with 3 technical replicates each. A two-way ANOVA was performed with a post-hoc Holm-Sidak’s multiple comparisons test for each time point. P-values were taken from day 10. Data were presented as the mean +/− the SEM for each time point. P<0.0001 for all groups compared with the negative controls. j Protein expression analysis was performed on protein lysates of Yumm1.7 Dox inducible MER overexpressing mCherry mouse melanoma cells treated with Dox (0.5ug/ml) vs a No Dox control for 48 h. HSP90 was used as a loading control. k Yumm1.7 Dox inducible MER overexpressing mCherry mouse melanoma cells were seeded at a density of 2×10⁴. Cells were then grown over a 10-day period and assessed for proliferation at days 3–5 and 10 using a haemocytometer and further assessed using automated counting via NIS elements. Experiment was performed in biological triplicate with 3 technical replicates each. A two-way ANOVA was performed with a post-hoc Holm-Sidak’s multiple comparisons test for each time point. P-values were taken from day 10. Data were presented as the mean +/− the SEM for each time point. P < 0.0001. l TCGA analysis of relative mRNA expression of MER in patient samples stratified into stage I/II vs. Stage III/IV and presented as a violin plot, with quartiles represented by black lines and the median by the broken line (N = 219, 197). A student’s two-way t-test was performed. P = 0.0025. m Tumour volumes from young mice (N = 9 for Dox Day 21, N = 8 for Dox Day 3, N = 7 for No Dox due to mouse deaths) subdermally injected with 2.5×10⁵ Yumm1.7 Dox inducible MER mCherry melanoma cells. Mice were treated with Dox (2 ug/ml in water) from day 3 or day 21 onwards, with tumours measured for 5 weeks. A two-way ANOVA was performed with a post-hoc Holm-Sidak’s multiple comparisons test for each time point. P-values were taken from day 31. Data were presented as the mean +/− the SEM for each time point. *** P = 0.0004 comparing No Dox with Dox Day 3. * P = 0.0281 comparing No Dox with Dox Day 21. n Western blot analysis was performed on protein lysate from Yumm1.7 Dox-inducible AXL overexpressing mCherry melanoma cells comparing control and Dox (0.5ug/ml) treated cells over 48 h. HSP90 was used as a loading control. o Yumm1.7 Dox inducible AXL overexpressing mCherry mouse melanoma cells were seeded at a density of 2×10⁴. Cells were then grown over a 10-day period and assessed for proliferation at days 3–5 and 10 using a haemocytometer and further assessed using automated counting via NIS elements. Experiment was performed in biological triplicates with 3 technical replicates each. A two-way ANOVA was performed with a post-hoc Holm-Sidak’s multiple comparisons test for each time point. P-values were taken from day 10. Data were presented as the mean +/− the SEM for each time point. P = 0.0272. p Tumour volumes from aged mice (N = 8 for No Dox, N = 5 for Dox Day 3 and N = 7 for Dox Day 21 due to mouse deaths) per group were subdermally injected with 2.5×10⁵ Yumm1.7 Dox inducible AXL mCherry melanoma cells. Mice were treated with Dox (2 ug/ml in water) from day 3 or day 21 onwards, with tumours measured for 5 weeks. A two-way ANOVA was performed with a post-hoc Holm-Sidak’s multiple comparisons test for each time point. P-values were taken from day 36. **** P < 0.0001 for comparisons between No Dox with both Dox Day 3 and Dox Day 21. Data were presented as the mean +/− the SEM for each time point.
Extended Data Fig. 7 |
Extended Data Fig. 7 |. MER expression is inversely correlated with WNT5A and AXL and is higher in lung metastases.
ad, IHC analysis was performed on matched human primary melanoma tumours and lung metastases for MER, WNT5A and AXL. Scale bar represents 100um with representative images displayed for each patient sample.
Extended Data Fig. 8 |
Extended Data Fig. 8 |. MER promotes emergence from metastatic dormancy whereas AXL induces dormancy.
a, Five young mice per group were intradermally injected with 2.5×10⁵ Yumm1.7 Dox inducible MER overexpressing mCherry melanoma cells. Mice were treated with Dox (2 mg/mL in water) from day 3 (Dox day 3) or day 21 onwards (Dox day 21), with tumours measured for 5 weeks. Lungs were taken, PFA embedded and underwent IHC analysis of mCherry positive melanoma cells. Representative images are displayed across three independent mice for mCherry positive cells and Ki-67 with the scale bar representing 100 um. b, c 5 aged mice per group were intradermally injected with 2.5×10⁵ Yumm1.7 Dox inducible AXL overexpressing mCherry melanoma cells. Mice were treated with Dox (2 mg/mL in water) from day 3 (Dox day 3) or day 21 onwards (Dox day 21), with tumours measured for 5 weeks. Lungs were taken, PFA embedded and underwent IHC analysis of mCherry positive melanoma cells. Representative images are displayed across three independent mice for mCherry positive cells and Ki-67 with the scale bar representing 100 um. Given that both Dox groups failed to produce larger lesions, these groups were assessed for the average number of single cell colonies per high powered frame (20 x) across entire lung sections and presented as mean +/− SEM. A student’s two-way t-test was performed. P = 0.5240.
Extended Data Fig. 9 |
Extended Data Fig. 9 |. GAS6 regulates proliferation in a context-specific manner.
a, b, FS4 and FS13 human GFP melanoma cells were seeded at a density of 2×10⁴. Cells were then grown over a 10-day period, while being treated with 500ng of r-GAS6 every 2 days and assessed for proliferation at days 3–5 and 10 using a haemocytometer and further assessed using automated counting via NIS elements. Experiment was performed in biological triplicates with 3 technical replicates each. A two-way ANOVA was performed with a post-hoc Holm-Sidak’s multiple comparisons test for each time point. P-values were taken from day 10. Data were presented as the mean +/− the SEM for each time point. P = 0.033 for 9A, P = 0.0205 for 9B c, d. FS14 control vs SH MER and 1205Lu control vs shAXL human melanoma cells were seeded at a density of 2×10⁴. Cells were treated with 500ng of r-GAS6 vs a PBS control every two days and assessed for proliferation at days 3–5 and 10 using a haemocytometer and further assessed using automated counting via NIS elements. Experiment was performed in biological triplicates with 3 technical replicates each. P-values were taken from day 10. **** P < 0.0001 shMER + GAS6 compared to control, ** P = 0.0013 Control vs Control + GAS6, * P = 0.0238 shMER vs shMER + GAS6. **** P < 0.0001 Control + GAS6 vs Control, * P = 0.0161 Control + GAS6 vs shAXL + GAS6. e, f Aged mice were intradermally injected with 2.5×10⁵ Yumm1.7 mCherry melanoma cells (5 mice for PBS, 4 mice for GAS6 treatment due to one early death). After three weeks of tumour growth, mice were subsequently treated with 500 ng of rGAS6 or PBS via IP injection every 2 days. After 5 total weeks, Lungs were taken, PFA embedded and underwent IHC analysis of mCherry positive melanoma cells. Both groups were further assessed for the average number of single cell colonies (<10 mCherry-positive cells) per high powered frame (20 x) across entire lung sections and presented as mean +/− SEM. A student’s two-way t-test was performed. P = 0441. Representative images are displayed across three independent mice for mCherry positive cells and Ki-67 with the scale bar representing 100 um.
Extended Data Fig. 10 |
Extended Data Fig. 10 |. PROS1 promotes melanoma growth.
ae, 1205Lu (P < 0.0001), FS4 (P < 0.0054), FS13 (P = 0.0015), FS14 (P < 0.0001) and Yumm1.7 (P < 0.0001). fluorescent melanoma cells were treated every two days with 500ng of r-PROS1 every 2 days vs a PBS control assessed for proliferation at days 3–5 and 10 using a haemocytometer and further assessed using automated counting via NIS elements. Experiment was performed in biological triplicates with 3 technical replicates each. A two-way ANOVA was performed with a post-hoc Holm-Sidak’s multiple comparisons test for each time point. P-values were taken from day 10 and P < 0.05 was designated significant. Data were presented as the mean +/− the SEM for each time point. f FS14 shMER knockdown cells and control cells were seeded at a density of 2×10⁴. Cells were then grown over a 10-day period, while being treated with 500 ng of r-PROS1 every two days and assessed for proliferation at days 3–5 and 10 using a haemocytometer and further assessed using automated counting via NIS elements. Experiment was performed in biological triplicates with 3 technical replicates each. A two-way ANOVA was performed with a post-hoc Holm-Sidak’s multiple comparisons test for each time point. P-values were taken from day 10. Data were presented as the mean +/− the SEM for each time point. **** P < 0.0001 for control + PROS1 vs all other treatment groups. g Protein lysate from Yumm1.7 cells treated with 500 ng of r-PROS1 for 48 h underwent western blot analysis. HSP90 was used as a loading control. h, i Young mice were intradermally injected with 2.5×10⁵ Yumm1.7 mCherry melanoma cells (5 mice per group). After three weeks of tumour growth, mice were subsequently treated with 500 ng of rPROS1 or PBS via IP injection every 2 days. After 5 total weeks, Lungs were taken, PFA embedded and underwent IHC analysis of mCherry positive melanoma cells. Both groups were further assessed for the average number of single cell colonies (<10 mCherry positive cells) per high powered frame (20 x) across entire lung sections and presented as mean +/− SEM. A student’s two-way t-test was performed. Representative images are displayed across three independent mice for mCherry positive cells and Ki-67 with the scale bar representing 100 um. P = 0.8757. j 5 young mice per group were intradermally injected with 2.5×10⁵ Yumm1.7 mCherry melanoma cells. After three weeks of tumour growth, mice were subsequently treated with 500 ng of r-PROS1, r-SFRP1, a combination of both or PBS via IP injection every 2 days. After 5 total weeks, lungs were taken, PFA embedded and subjected to IHC analysis of mCherry positive melanoma cells. Representative images were displayed for mCherry and Ki-67 with the scale bar representing 100 um.
Extended Data Fig. 11 |
Extended Data Fig. 11 |. Aged liver fibroblasts express sFRP1 and are growth permissive for melanoma cells.
a, Five young (8 week) and five aged (>52 week) C57BL6 mice were intradermally injected with 2.5×10⁵ Yumm1.7 parental mouse melanoma cells and tumours were measured over 36 days. Lungs were collected and PFA embedded from 5 tumour bearing young and aged mice at weeks 3 and 5 and IHC was performed using MITF, KI-67 and H&E. Representative images are displayed across three independent aged mice for MITF positive cells and Ki-67 with the scale bar representing 100 um. b Data were generated using the Human Protein Atlas looking at RNA expression of sFRP1 in specific cell types across various tissue types. Green circles indicate high levels of expression, grey circles low expression and empty spaces no expression. c Western blot was performed on protein lysate taken from the healthy liver of young (<8 weeks) and aged (>52 weeks) C57BL6 mice. GAPDH was used as a loading control. d Protein lysate from one healthy human young (<35) and aged (>55) liver fibroblast. HSP90 was used as a loading control. e, f Collagen sandwich reconstructions were formed with healthy human Liver fibroblasts from young (< 35) or aged (> 55) patients in the top and bottom layer. The middle layer contained FS4 or 1205Lu GFP human melanoma cells seeded at the same density at day 0. GFP positive melanoma cells were imaged using an automated Nikon TI and an average count per field was quantified using imaging software NIS elements at day 4. Representative images are displayed for each condition (N = 3 independent wells in triplicate). A student’s two-way t-test was performed. 1205Lu P = 0.0001, FS4 P = 0.0055. g, h 1205Lu and FS4 GFP melanoma cells were seeded at a density of 2×10⁴. Cells were then grown over a 10-day period in conditioned medium from young or aged lung or skin fibroblasts and underwent counting using a haemocytometer at days 3, 5 and 10 and were further assessed via automated counting using NIS elements. Experiment was performed in biological triplicates with 3 technical replicates each. A two-way ANOVA was performed with a post-hoc Holm-Sidak’s multiple comparisons test for each time point. P-values were taken from day 10. ** P = 0.0018, **** P < 0.0001. Data were presented as the mean +/− the SEM for each time point.
Fig. 1 |
Fig. 1 |. The aged lung microenvironment promotes efficient lung metastasis through aged fibroblasts.
a, Six young (8 weeks) and six aged (more than 52 weeks) C57BL6 mice were intradermally injected with 2.5 × 10⁵ Yumm1.7 mCherry mouse melanoma cells, and tumours were measured over 36 days. Data are mean ± s.e.m. for each time point (P values day 30 and 36; two-way ANOVA with a post hoc Holm–Sidak’s multiple comparisons test for each time point; **P < 0.0049, ****P < 0.0001). b, c, IHC analysis of lungs from five young and five aged mice to quantify the number of mCherry+ colonies (more than 10 mCherry+ cells per lesion) per section at weeks 3 and 5 (b). Data are mean ± s.e.m. (Student’s two-sided two-sided t-test; P = 0.0007). Representative images of mCherry staining of lungs are displayed (c). Scale bars, 100 μm. d, Lung sections from young and aged mice at week 5, stained for mCherry and Ki-67 to assess colocalization. Scale bars, 100 μm. e, f, Ten young and ten aged mice were injected intravenously via the tail vein with 1 × 10⁵ Yumm1.7 mCherry melanoma cells and analysed until visible clinical signs of metastasis (weight loss and hunched posture). Whole sections of H&E-stained lungs were scanned at 40× (Aperio Slide Scanner) and analysed for total lung tissue area versus area of metastatic tissue using Concentriq software (e). Data are mean ± s.e.m. (Student’s two-sided two-sided t-test; P = 0.0005). Representative images are displayed (f). Scale bars, 2.5 mm. g, h, Images of Ki-67-stained lungs from intravenously injected mice (n = 7) at 40× were taken blind from five different appropriately sized metastatic lesions per lung section. Scale bars, 100 μm (h). The percentage of Ki-67+ nuclei relative to total nuclei from each metastasis was assessed through automated counting using ImageJ (g). Data are mean ± s.e.m. (Student’s two-sided t-test; P < 0.0001). i, j, Three layered collagen sandwich reconstructions with healthy human lung or skin fibroblasts from young (≤35) or aged (≥55) patients at the top and bottom layer, and 1205Lu GFP human melanoma cells in the middle layer and displayed in images (seeded at equal density on day 0). GFP+ melanoma cells were imaged across the entire well (automated Nikon TI) and the average count per field was quantified (NIS-Elements) at day 4 (n = 5 young, and 10 all other conditions). Data are mean ± s.e.m. (one-way ANOVA with Tukey’s post hoc test for multiple comparisons; **P = 0.0014 (lung), **P = 0.0013 (skin). k, Proteomic analysis on healthy human lung fibroblasts from two young (≤35) and two aged (≥55) individuals, each in triplicate. A false discovery rate of less than 5% was considered significant (unpaired two-sided t-test).
Fig. 2 |
Fig. 2 |. The aged lung fibroblast secretome promotes metastatic melanoma outgrowth through secretion of sFRP1.
a, b, Protein lysate was collected from 1205Lu human melanoma cells treated with young (≤35 years) or aged (≥55 years) lung (a) or skin (b) fibroblast conditioned medium (CM) for five days compared to control (C). Western blot analysis was performed for dormant (WNT5A, AXL, p21, p27, p-p38 and p-PKC) and proliferative (β-catenin, MER and MITF) melanoma markers. HSP90 was used as a loading control. c, Yumm1.7 (mouse) and 1205Lu (human) melanoma cells were treated with 500 ng of recombinant sFRP1 (rsFRP1) every 2 days; protein expression was assessed after 5 days (western blot). HSP90 was used as a loading control. d, 1205Lu (bottom) and Yumm1.7 (top) GFP melanoma cells were seeded at a density of 2 × 10⁴. Cells were grown for 10 days, treated with 500 ng of rsFRP1 every 2 days and counted at days 3, 5 and 10. The experiment was performed in triplicate with three technical replicates each. Data are mean ± s.e.m. for each time point (two-way ANOVA with a post hoc Holm–Sidak’s multiple comparisons test; P values taken from day 10; P < 0.0001). e, Aged lung fibroblasts were transduced with lentiviral shSFRP1 (SH) or scrambled control (NEG) vectors. Western blot analysis was performed on protein lysates. HSP90 was used as a loading control. f, 1205Lu melanoma cells were seeded at 2 × 10⁴ and grown in conditioned medium (taken from shSFRP1 and control (shNEG) fibroblasts after 72 h), or with regular medium (DMEM) for 10 days; proliferation was assessed as above. The experiment was performed in triplicate with three technical replicates each. Data are mean ± s.e.m. for each time point (two-way ANOVA with post hoc Holm–Sidak’s multiple comparisons test; P values taken from day 10; P = 0.0001 for aged shSFRP1 compared to aged shNEG conditioned medium). g, h, Five aged mice per group were intradermally injected with 2.5 × 10⁵ Yumm1.7 mCherry melanoma cells. After 3 weeks, mice were treated with 1 mg kg−1 neutralizing sFRP1 or IgG control antibody through intraperitoneal injection every 4 days; lung metastasis was assessed at week 5 and the number of mCherry+ colonies was quantified (more than 10 mCherry+ cells per lesion) per lung section (g). Data are mean ± s.e.m. (Student’s two-sided t-test; P < 0.0001). Representative images of Yumm1.7 mCherry staining in aged mouse lungs are displayed (h). Scale bars, 100 μm. i, Key differences in the metastatic cascade between young and aged patients. The diagram shows that a switch from sFRP2 secretion by aged skin fibroblasts to sFRP1 secretion by aged lung fibroblasts promotes efficient metastatic progression of melanoma cells in aged models (schematic made with Biorender.com).
Fig. 3 |
Fig. 3 |. Temporal downregulation of WNT5A promotes metastatic melanoma outgrowth in previously dormant lung microenvironments.
a, b, Analysis of the melanoma TCGA dataset (all samples) was performed on human samples stratified into the top (WNT5Ahigh) and bottom (WNT5Alow) 25th percentile of WNT5A expression and presented as a heat map of the average z-score. An unpaired two-sided t-test was performed to estimate the significance of the difference between conditions; P < 0.05 was considered significant (n = 120 per group). The panels represent common dormancy markers from other cancers (a) and common proliferative markers from melanoma (b). c, Protein expression analysis was performed on protein lysates from WNT5Alow human melanoma samples (FS13 and FS14) that underwent lentiviral-induced overexpression of WNT5A (OE). HSP90 was used as a loading control. d, Lungs from young and aged mice containing Yumm1.7 mCherry tumour cells (Fig. 1) underwent IHC analysis for mCherry, WNT5A and Ki-67 to analyse colocalization. Scale bars, 100 μm. e, f, Five young mice per group were intradermally injected with 2.5 × 10⁵ Yumm1.7 dox-inducible shWnt5a mCherry melanoma cells. Mice were treated with dox (2 mg ml−1 in water) from day 3 (dox day 3) or day 21 onwards (dox day 21), with tumours measured for 5 weeks. Lungs were paraformaldehyde (PFA)-embedded and underwent IHC analysis of mCherry+ melanoma cells, after quantifying the number of mCherry+ colonies (more than 10 mCherry-positive cells per lesion) per lung section (e). Data are mean ± s.e.m. (P < 0.0001 for comparisons between dox day 21 compared to both dox day 3 and no dox; one-way ANOVA with Tukey’s post hoc test for multiple comparisons). Representative images are displayed (f). Scale bars, 100 μm. g, h, Five aged mice per group were intradermally injected with 2.5 × 10⁵ Yumm1.7 dox-inducible WNT5A-overexpressing mCherry melanoma cells, then treated as in e, f. P < 0.0001 for comparisons between no dox compared to both dox day 3 and dox day 21 (one-way ANOVA with Tukey’s post hoc test for multiple comparisons). i, j, Eight young mice per group were injected intravenously via the tail vein with 1 × 10⁵ Yumm1.7 dox-inducible shWnt5a mCherry melanoma cells. Dox-treated mice (2 mg ml−1 in water) were treated beginning at day 3 and analysed until visible clinical signs of metastasis (weight loss, hunched posture), which took 35 days. Lungs were PFA-embedded, stained with H&E and sections were scanned at 40× using an Aperio Slide Scanner. Whole sections were analysed for total lung tissue area versus metastatic tissue area using Concentriq software (i). Data are mean ± s.e.m. (P = 0.0003; Student’s two-sided t-test). Representative images are displayed (j). Scale bars, 2.5 mm. k, l, Lungs from three of the previous intravenously injected mice underwent IHC analysis for Ki-67. Images (l) were taken blind at 40× from five metastatic lesions from each lung section of appropriate size. The percentage of Ki-67+ nuclei relative to total nuclei from each metastasis was assessed using ImageJ (k). Data are mean ± s.e.m. (P = 0.0186; Student’s two-sided t-test). m, Melanoma metastatic progression and dormancy reactivation in young versus aged patients, highlighting the complex nature of WNT5A expression required at each metastatic time point (schematic made with Biorender.com).
Fig. 4 |
Fig. 4 |. An age-induced differential AXL–MER axis promotes a dormancy–reactivation axis during metastatic melanoma.
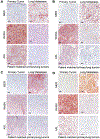
a, Protein expression analysis of protein lysate from three WNT5Ahigh (FS4, FS5 and 1205Lu) and two WNT5Alow (FS13 and FS14) human melanoma samples. HSP90 was used as a loading control. b, IHC analysis was performed on matched human primary melanoma tumours and resulting lung metastases for MER, WNT5A and AXL. Scale bars, 100 μm. c, d, Western blot analysis of 1205Lu human melanoma cells that underwent lentiviral shRNA-mediated knockdown of AXL (c) or MER (d) using two independent shRNAs against a scrambled control. HSP90 was used as a loading control. e, Lungs from young and aged mice containing mCherry melanoma cells (Fig. 1) underwent IHC analysis for mCherry, WNT5A, MER, AXL and Ki-67 to analyse colocalization. Scale bars, 100 μm. fh, Five young mice per group were intradermally injected with 2.5 × 10⁵ Yumm1.7 Dox-inducible MER-overexpressing mCherry melanoma cells. Mice were treated with dox (2 mg ml−1 in water) from day 3 (dox day 3) or day 21 onwards (dox day 21), with tumours measured for 5 weeks. Lungs were PFA-embedded and underwent IHC analysis of mCherry+ melanoma cells, after quantifying the number of mCherry+ colonies (more than 10 mCherry+ cells per lesion) per section (mean ± s.e.m.). P < 0.0001 for comparisons between dox day 21 compared to both dox day 3 and no dox (one-way ANOVA with Tukey’s post hoc test for multiple comparisons) (f). The no dox and dox day 3 group did not produce larger lesions. These groups were further assessed for the average number of single-cell colonies across entire lung sections (mean ± s.e.m.). P = 0.0379 (Student’s two-sided t-test) (g). HPF, high-power field. h, Representative images are displayed. Scale bars, 100 μm. i, j, Nine young mice per group were injected intravenously via the tail vein with 1 × 10⁵ Yumm1.7 dox-inducible MER mCherry melanoma cells. Dox-treated mice (2 mg ml−1 in water) were treated beginning at day 3. Mice were analysed until visible clinical signs of metastasis (weight loss, hunched posture), at day 35. Lungs were PFA-embedded, stained with H&E and sections were scanned at 40× (Aperio Slide Scanner). Whole sections were analysed for total lung tissue area versus metastatic tissue area using Concentriq software (i). Data are mean ± s.e.m. (P = 0.0041; Student’s two-sided t-test). Representative images are displayed (j). Scale bars, 2.5 mm. k, l, Lungs from four of the previous intravenously injected mice underwent IHC analysis for Ki-67. Scale bars, 100 μm. Images (l) were taken blind at 40× from five metastatic lesions from each lung section of appropriate size. The percentage of Ki-67+ nuclei relative to total nuclei was assessed using ImageJ (k). Data are mean ± s.e.m. (P = 0.001; Student’s two-sided t-test). m, n, Five aged mice per group were intradermally injected with 2.5 × 10⁵ Yumm1.7 dox-inducible AXL-overexpressing mCherry melanoma cells. Mice were treated with dox (2 mg ml−1 in water) from day 3 (dox day 3) or day 21 onwards (dox day 21), with tumours measured for 5 weeks. Lungs were PFA-embedded and underwent IHC analysis of mCherry+ melanoma cells, after quantifying the number of mCherry+ colonies (more than 10 mCherry+ cells per lesion) per section (m). Data are mean ± s.e.m. (P < 0.0001 for comparisons between no dox compared to both dox day 3 and dox day 21; one-way ANOVA with Tukey’s post hoc test for multiple comparisons). Representative images are displayed for no dox and dox day 21 (n). Scale bars, 100 μm. o, p, Seven aged mice per group were injected intravenously via the tail vein with 1 × 10⁵ Yumm1.7 dox-inducible AXL mCherry melanoma cells. Dox-treated mice (2 mg ml−1 in water) were treated beginning at day 3. Mice were analysed until visible clinical signs of metastasis (weight loss, hunched posture) in both groups. Lungs were PFA-embedded, stained with H&E and sections were scanned at 40× (Aperio Slide Scanner). Whole sections were analysed for the total lung tissue area versus the metastatic tissue area using Concentriq software (o). Data are mean ± s.e.m. (P = 0.008; Student’s two-sided t-test). Representative images are displayed (p). Scale bars, 2.5 mm. q, r, Lungs from five of the previous intravenously injected mice underwent IHC analysis for Ki-67. Scale bars, 100 μm. Images (r) were taken blind at 40× from five different appropriately sized metastatic lesions from each lung section. The percentage of Ki-67+ nuclei relative to total nuclei was assessed using ImageJ (q). Data are mean ± s.e.m. (P < 0.0001; Student’s two-sided t-test).
Fig. 5 |
Fig. 5 |. PROS1 promotes the reactivation of dormant melanoma tumour cells in the aged lung microenvironment.
a, Lungs from young and aged mice containing Yumm1.7 mCherry melanoma cells (Fig. 1) underwent IHC analysis for PROS1 and GAS6 to analyse colocalization. Scale bars, 100 μm. b, Western blot analysis of 48-hour-old conditioned medium from two AXLhigh (FS4 and 1205Lu) and two MERhigh (FS13 and FS14) human melanoma cells for secreted PROS1 and GAS6. Initial protein expression was normalized using a bicinchoninic acid (BCA) assay; Ponceau staining was performed as a loading control. c, d, 1205Lu (AXLhigh) (c) and FS14 (MERTKhigh) (d) human melanoma cells were seeded at a density of 2 × 10⁴. Cells were then grown over a 10-day period and treated with 500 ng of recombinant GAS6 every 2 days. Cells were counted at days 3, 5 and 10 (n = 3). The experiment was performed as biological triplicates with three technical replicates each (mean ± s.e.m.). P values were taken from day 10; P = 0.0002 for 1205Lu and P = 0.0113 for FS14 (two-way ANOVA with post hoc Holm–Sidak’s multiple comparisons test). e, Yumm1.7 AXL-inducible cells were seeded at 2 × 10⁴ and treated with 500 ng of GAS6 or a PBS control every 2 days in the presence or absence of dox. Cells were counted at days 3, 5 and 10. The experiment was performed as biological triplicates with three technical replicates each (mean ± s.e.m.). P values were taken from day 10; ****P < 0.0001 for AXL + GAS6 compared with all three other groups (two-way ANOVA with post hoc Holm–Sidak’s multiple comparisons test). f, Western blot analysis of protein lysates from the Yumm1.7 AXL-inducible cells described in e. HSP90 was used as a loading control. g, h, Aged mice were intradermally injected with 2.5 × 10⁵ Yumm1.7 mCherry melanoma cells (5 mice for PBS, 4 mice for GAS6 owing to one early death). After 3 weeks of tumour growth, mice were treated with 500 ng of rGAS6 or PBS via intraperitoneal injection every 2 days. After five total weeks, lungs were PFA-embedded and underwent IHC analysis of mCherry+ melanoma cells, after quantifying the number of mCherry+ colonies (more than10 mCherry+ cells per lesion) per section (g). Data are mean ± s.e.m. (P = 0.0127; Student’s two-sided t-test). Representative images are displayed (h). Scale bars, 100 μm. i, j, Five young mice per group were intradermally injected with 2.5 × 10⁵ Yumm1.7 mCherry melanoma cells. After three weeks of tumour growth, mice were treated with rPROS1 or PBS as above and analysed as in g, h. P = 0.0053 (Student’s two-sided t-test). Scale bars, 100 μm. k, l, Five young mice per group were intradermally injected with 2.5 × 10⁵ Yumm1.7 mCherry melanoma cells. After 3 weeks of tumour growth, mice were subsequently treated with 500 ng of rPROS1, rsFRP1, a combination of both or PBS via intraperitoneal injection every 2 days. After five total weeks, lungs were PFA-embedded and analysed as above. Data are mean ± s.e.m. (one-way ANOVA with Tukey’s post hoc test for multiple comparisons; ****P < 0.0001 PBS versus both, **P = 0.0065 sFRP1 versus both, **P = 0.0095 PROS1 versus both). Scale bars, 100 μm. m, Aged induced metastatic reactivation from dormancy, centred around a sFRP1–PROS1 secreted ligand axis that promotes the downregulation of WNT5A–AXL-mediated dormancy towards a MER proliferative reactivation state (schematic made with Biorender.com).

Comment in

Similar articles

Cited by

References

    1. Hoek KS & Goding CR Cancer stem cells versus phenotype-switching in melanoma. Pigment Cell Melanoma Res. 23, 746–759 (2010). - PubMed
    1. Fane ME, Chhabra Y, Smith AG & Sturm RA BRN2, a POUerful driver of melanoma phenotype switching and metastasis. Pigment Cell Melanoma Res. 32, 9–24 (2019). - PubMed
    1. Kaur A, Webster MR & Weeraratna AT In the Wnt-er of life: Wnt signalling in melanoma and ageing. Br. J. Cancer 115, 1273–1279 (2016). - PMC - PubMed
    1. Kaur A et al. sFRP2 in the aged microenvironment drives melanoma metastasis and therapy resistance. Nature 532, 250–254 (2016). - PMC - PubMed
    1. Webster MR et al. Paradoxical role for wild-type p53 in driving therapy resistance in melanoma. Mol. Cell 77, 633–644 (2020). - PMC - PubMed