Randomized Controlled Trial
. 2022 Jun;606(7913):375-381.
doi: 10.1038/s41586-022-04797-9. Epub 2022 Jun 1.

Combination anti-HIV antibodies provide sustained virological suppression

Affiliations
Randomized Controlled Trial

Combination anti-HIV antibodies provide sustained virological suppression

Michael C Sneller et al. Nature. 2022 Jun.

Abstract

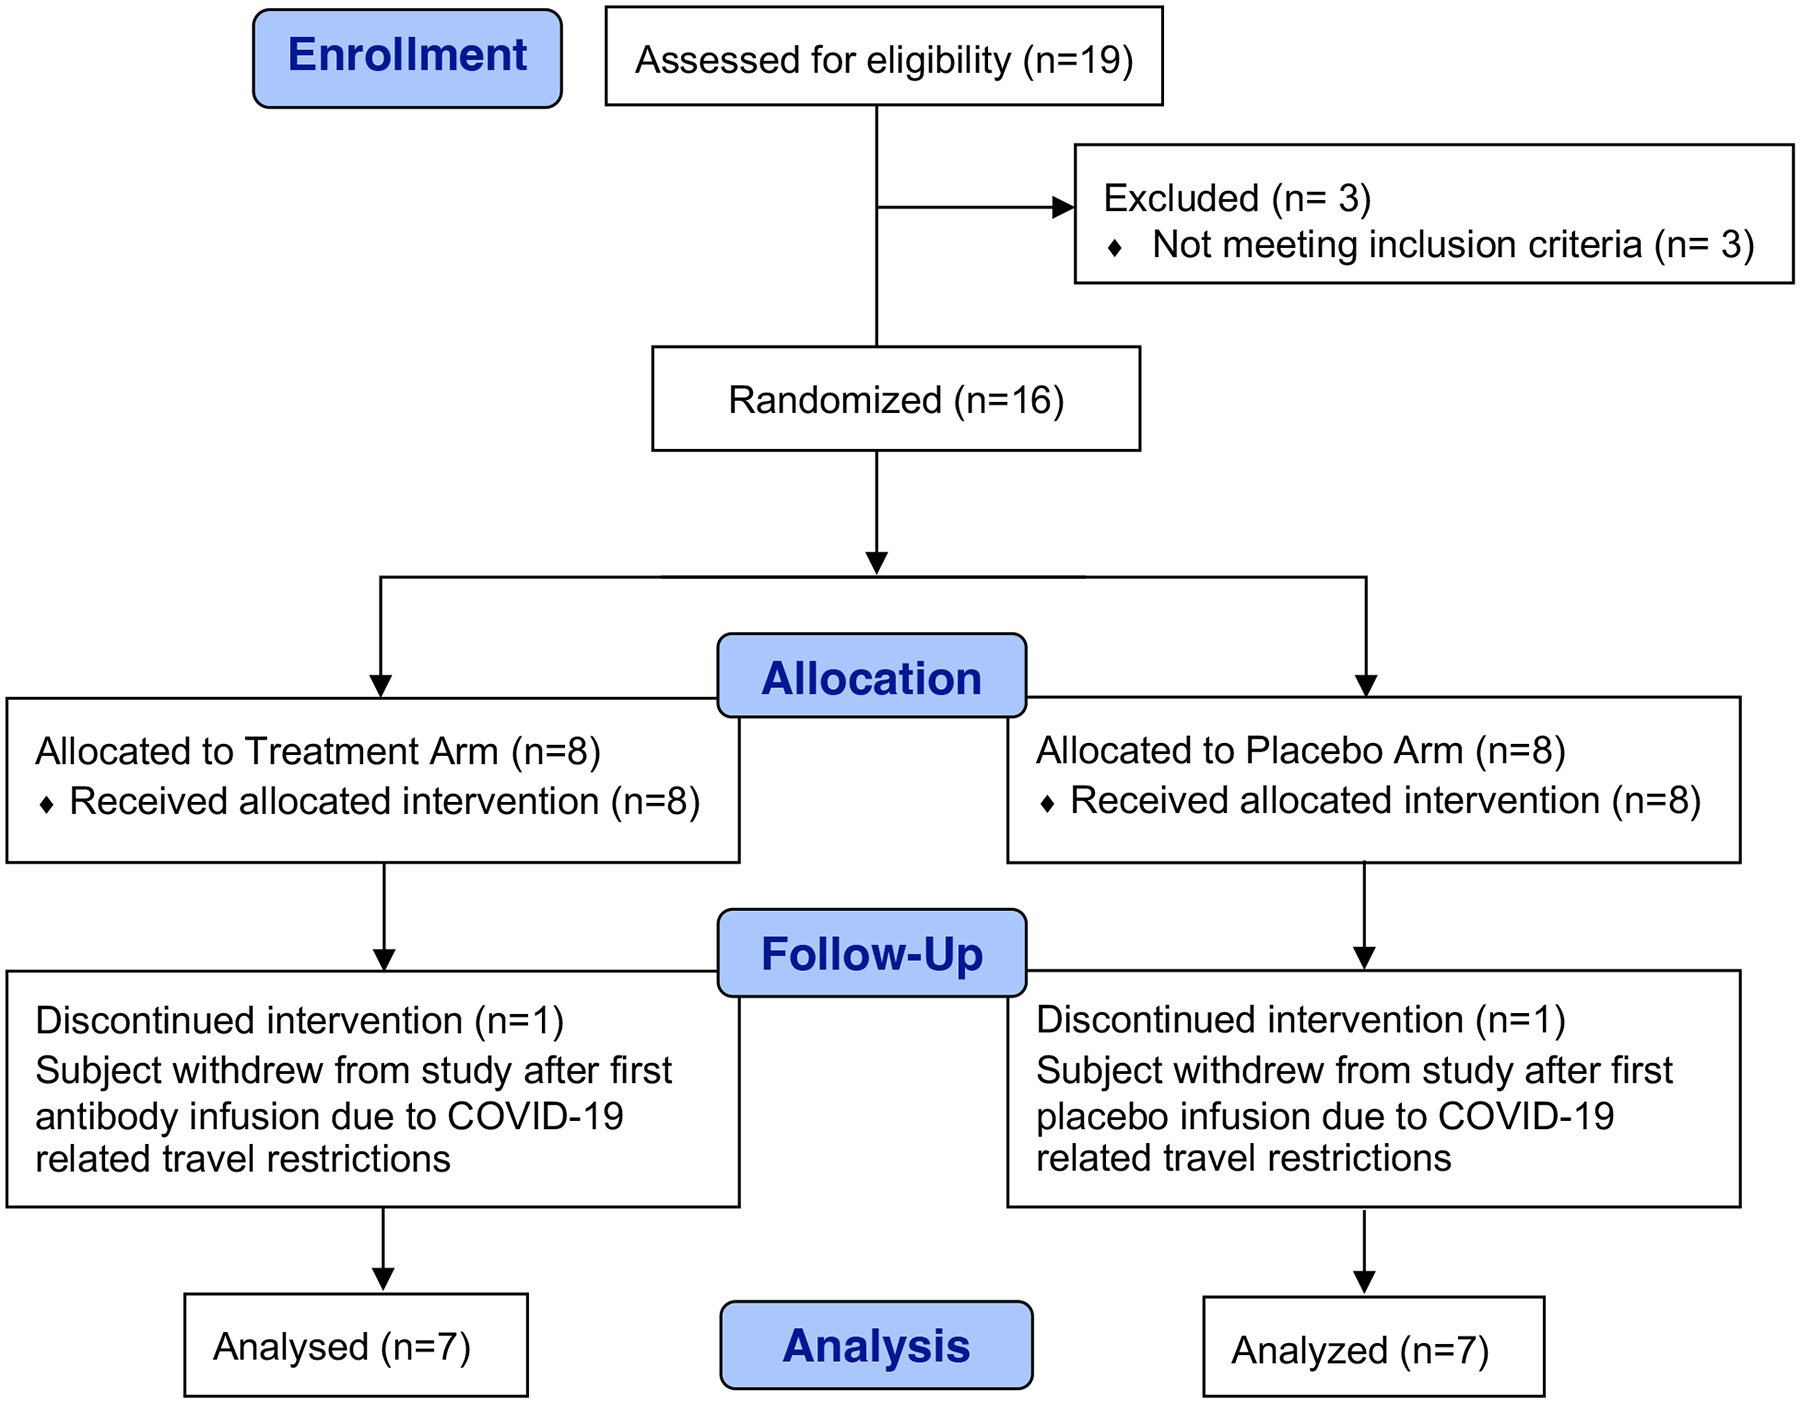
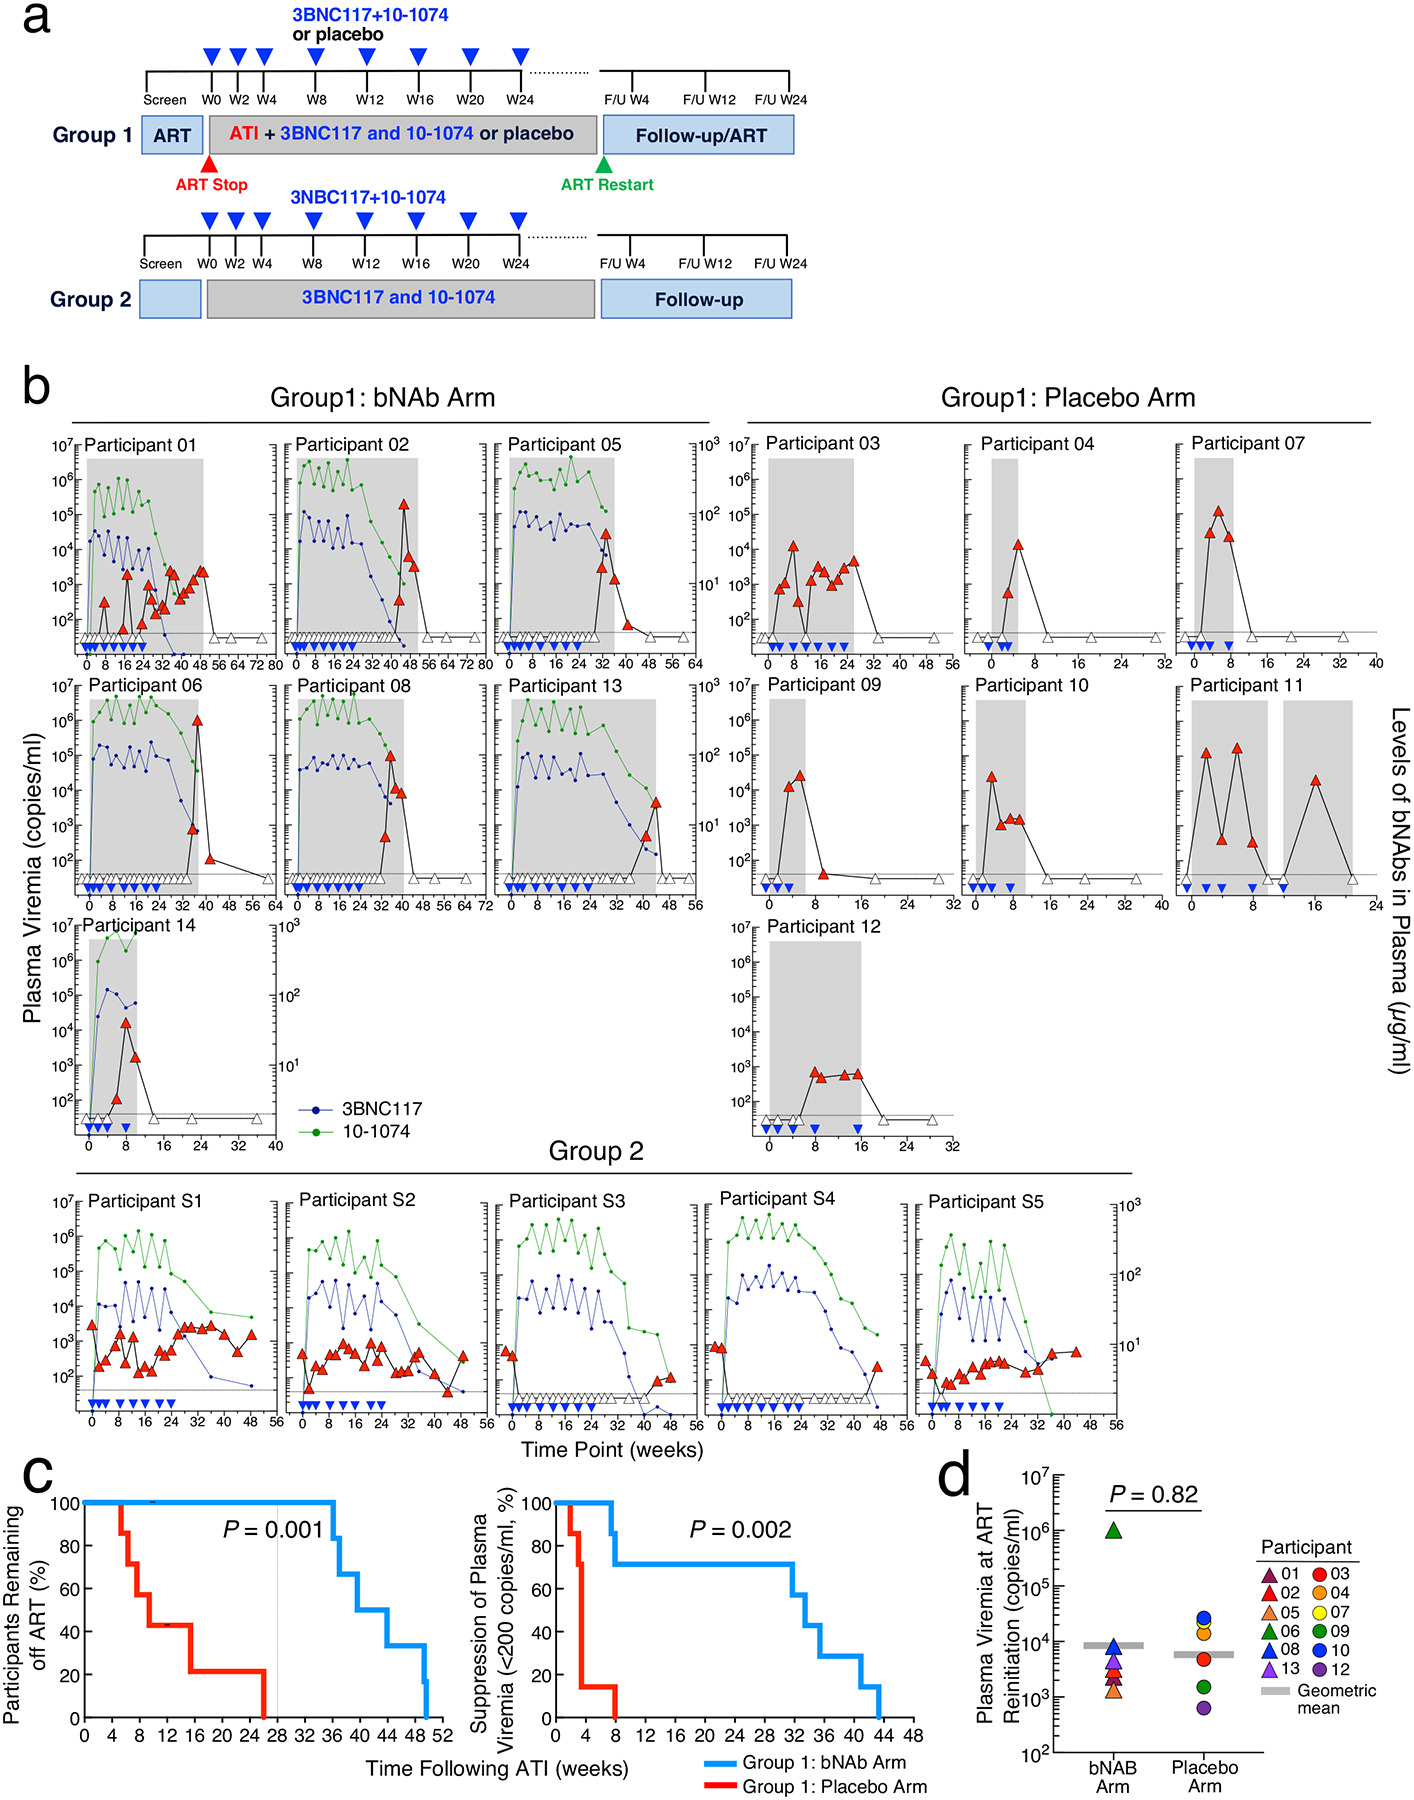
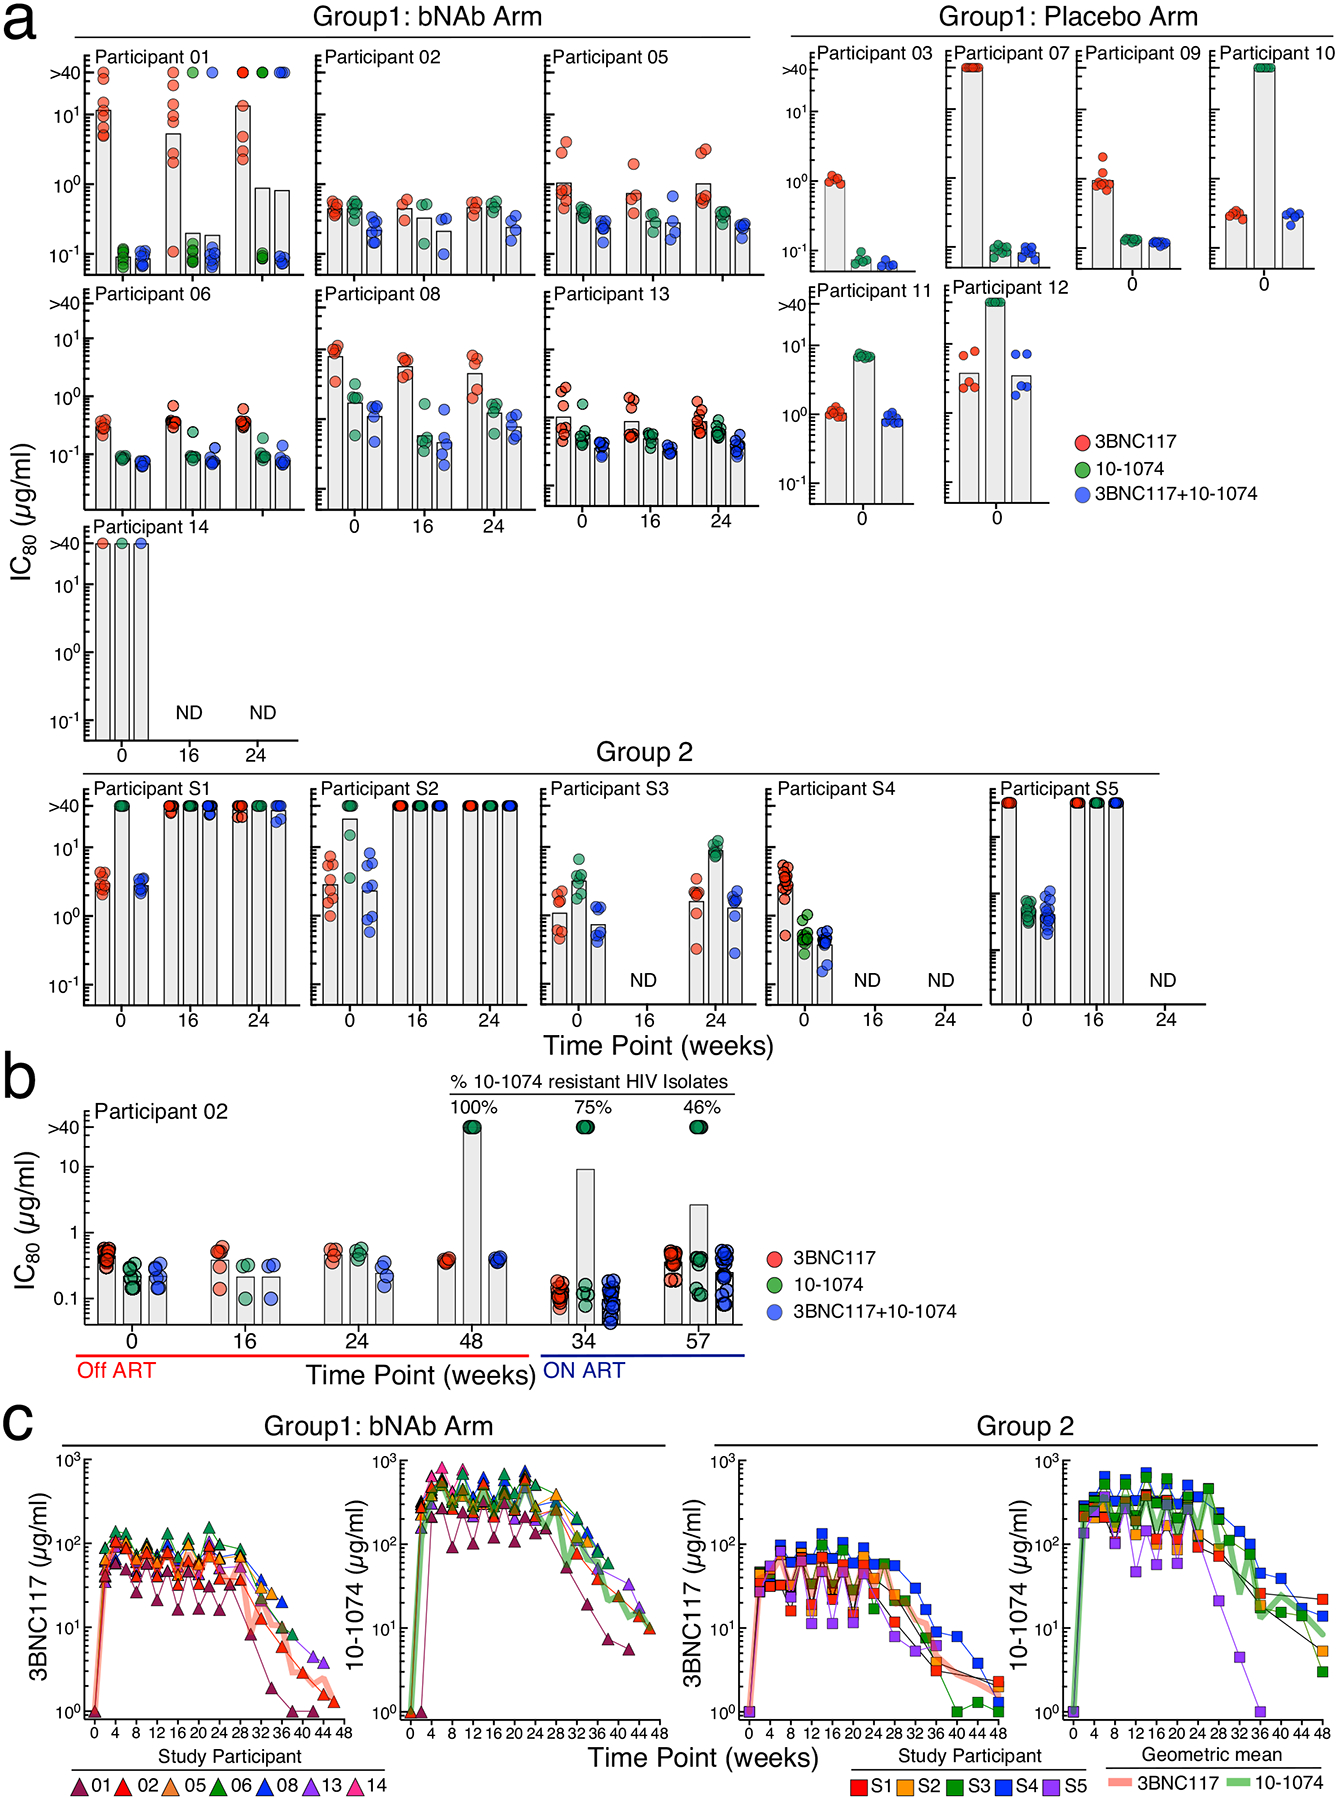
Antiretroviral therapy is highly effective in suppressing human immunodeficiency virus (HIV)1. However, eradication of the virus in individuals with HIV has not been possible to date2. Given that HIV suppression requires life-long antiretroviral therapy, predominantly on a daily basis, there is a need to develop clinically effective alternatives that use long-acting antiviral agents to inhibit viral replication3. Here we report the results of a two-component clinical trial involving the passive transfer of two HIV-specific broadly neutralizing monoclonal antibodies, 3BNC117 and 10-1074. The first component was a randomized, double-blind, placebo-controlled trial that enrolled participants who initiated antiretroviral therapy during the acute/early phase of HIV infection. The second component was an open-label single-arm trial that enrolled individuals with viraemic control who were naive to antiretroviral therapy. Up to 8 infusions of 3BNC117 and 10-1074, administered over a period of 24 weeks, were well tolerated without any serious adverse events related to the infusions. Compared with the placebo, the combination broadly neutralizing monoclonal antibodies maintained complete suppression of plasma viraemia (for up to 43 weeks) after analytical treatment interruption, provided that no antibody-resistant HIV was detected at the baseline in the study participants. Similarly, potent HIV suppression was seen in the antiretroviral-therapy-naive study participants with viraemia carrying sensitive virus at the baseline. Our data demonstrate that combination therapy with broadly neutralizing monoclonal antibodies can provide long-term virological suppression without antiretroviral therapy in individuals with HIV, and our experience offers guidance for future clinical trials involving next-generation antibodies with long half-lives.


Conflict of interest statement

Competing Interests Statement

There are patents on 3BNC117 (PTC/US2012/038400) and 10–1074 (PTC/US2013/065696) that list M.C.N. as an inventor. 3BNC117 and 10–1074 are licensed to Gilead Sciences by Rockefeller University from which M.C.N. has received payments. M.C.N. is a member of the Scientific Advisory Boards of Celldex Therapeutics, Walking Fish Therapeutics, and Frontier Biotechnologies. M.C.N. had no control over the direction and ultimately the reporting of the clinical portion of the research while holding their financial interests. All other authors declare no competing financial interests.

Figures

Extended Data Fig. 1:
Extended Data Fig. 1:. Consolidated Standards of Reporting Trials (CONSORT) flow diagram for the trial.
CONSORT diagram shows the study enrollment of 14 participants who underwent randomization to the bNAb or placebo groups.
Extended Data Fig. 2:
Extended Data Fig. 2:. Dynamics of HIV reservoirs.
a. Frequencies of CD4+ T cells carrying total HIV DNA in study participants in the placebo arm of Group 1. b. Frequencies of CD4+ T cells carrying total HIV DNA in study participants in the Group 2 in whom plasma viremia was suppressed by the combination bNAbs.
Extended Data Fig. 3:
Extended Data Fig. 3:. Longitudinal measurements of CD4+ T cell counts and phenotypic analyses of CD8+ T cells.
a. Levels of CD4+ T cell counts of the bNAb (n=7) and placebo (n=7) arms of Group 1 and Group 2 (n=5) study participants are shown. b. Frequencies of the activation/exhaustion markers TIGIT, PD-1, CD38 and HLA-DR (left) and T cell subsets (TN, naïve; TCM, central memory; TTM, transitional memory; TEM, effector memory; TTD, terminally differentiated) on CD8+ T cells of the bNAb (n=5) and placebo (n=7) arms of Group 1 and Group 2 (n=5) study participants are shown. The grey lines indicate median values. P values were determined using the two-sided Wilcoxon matched-pairs signed rank test and were adjusted for multiple testing. ns, not significant.
Extended Fig. 4:
Extended Fig. 4:. Phenotypic analysis of T cells.
Longitudinal high-dimensional flow cytometric analyses of PBMCs of study participants. a. Global opt-SNE plots of CD3+ T cells of combined data from each group of study participants. b. Opt-SNE visualization of expression of the indicated markers are shown. c. Opt-SNE map of T cell clusters identified by FlowSOM clustering. Each number indicates a distinct cluster. Heatmap shows the level of expression (MFI) within individual clusters. d. Comparison of frequencies of T cells expressing markers associated with indicated clusters in the bNAb (n=5) and placebo (n=7) arms of Group 1 and Group 2 (n=5) study participants are shown. P values were determined using the two-sided Wilcoxon matched-pairs signed rank test and were adjusted for multiple testing. ns, not significant.
Extended Data Fig. 5:
Levels of biomarkers in the plasma of the bNAb (n=5) and placebo (n=7) arms of Group 1 and Group 2 (n=5) study participants over time. The grey lines indicate median values. P values were determined using the two-sided Wilcoxon matched-pairs signed rank test and were adjusted for multiple testing. ns, not significant.
Extended Data Fig. 6:
Extended Data Fig. 6:. Analysis of HIV-specific CD8+ T cells.
Frequencies of HIV Gag-specific CD8+ T cells and dynamics of CD8+ T cell receptor (TCR) repertoire. a. Frequencies of polyfunctional (IFN-γ+TNF-α+MIP-1ß+) HIV Gag-specific CD8+ T cells in the bNAb (n=5) and placebo (n=7) arms of Group 1 and Group 2 (n=5) study participants are shown. The grey lines indicate median values. P values were determined using the two-sided Wilcoxon matched-pairs signed rank test. b. Changes in the HIV-specific breadth and depth of CD8+ T cells of study participants are shown (upper panels). Highly enriched CD8+ T cells were obtained using a bead-based purification method. The analysis includes 35 CD8+ T cell-derived genomic DNA samples from 12 study participants (15 samples from 5 participants in the bNAb arm of Group 1, 5 samples from 2 participants in the placebo arm of Group 1, and 15 samples from 5 participants in Group 2). Violin plots show the Gaussian kernel probability density of the breadth/depth values over time. The median values and interquartile ranges of the time point-specific distribution are shown as circles and vertical lines, respectively. Principal component analysis (PCA) of the changes in the TCR repertoire characteristics is shown (lower panels). Each ellipse shows the 95% confidence interval in the PCA space and the center of each ellipse is indicated by larger sized symbols that represent specific time points. Lower left panels depict PCA results with the frequencies of the HIV-specific clonotypes ranked among the top 25 with respect to their P values associated with the pairwise comparisons between the three time points. Lower right panels depict PCA results with the gene usage profiles derived from the TRBV-TRBJ gene pairs in the above clonotypes. Principal component (PC) 1 and PC2 represent a lower-dimensional representation of the input data consisting of the frequencies of the HIV-specific clonotypes (lower left panel) and the usage levels of the TRBV-TRBJ gene pairs (lower right panel) for each patient group. P values were determined using the two-sided Wilcoxon signed-rank test.
Fig. 1:
Fig. 1:. Study design and effect of combination of 3BNC117 and 10–1074 on plasma viremia in study participants.
a. Schematics of clinical trial design. The blue triangles indicate infusions of 3BNC117 and 10–1074 or placebo. b. Plasma viremia of study. Participants in Group 1 were randomized to receive either a combination of anti-HIV broadly neutralizing antibodies (bNAbs) 3BNC117 (30mg/kg) and 10–1074 (30mg/kg) (n=7) or placebo (n=7). Antiretroviral therapy (ART) was discontinued 3 days after receiving the first dose of 3BNC117 and 10–1074 or placebo. Group 2 (open-label) consisted of 5 ART-naïve slow progressors. Plasma viremia was monitored every two weeks. The blue triangles indicate time of administration of the antibodies or placebo. The grey shaded boxes indicate duration of ATI. The grey dotted horizontal lines indicate the limit of detection of the assay (40 copies of HIV RNA/ml). The white triangles indicate undetectable plasma viremia (<40 copies of HIV RNA/ml) and the red triangles indicate detectable plasma viremia (≥40 copies of HIV RNA/ml). Plasma antibody concentrations were determined by TZM-bl assay. The dark blue and green circles indicate the plasma concentration of 3BNC117 and 10–1074, respectively. c. Kaplan-Meyer analysis of suppression of plasma viremia after discontinuation of ART in study participants in Group 1. The proportion of study participants remaining off ART during ATI in the bNAb arm was compared to the study participants in the placebo arm (left panel). The vertical dotted line indicates the virologic endpoint. Duration of plasma viremia <200 copies of HIV RNA/ml following discontinuation of ART was compared between the participants in the bNAb arm and the placebo arm (right panel). P values were determined by exact log-rank tests. d. Comparison of plasma viremia at the time of ART reinitiation between the bNAb (n=6) and placebo (n=6) arms in Group 1 study participants. The grey bars represent geometric mean values. The P value was determined using the two-sided Mann-Whitney test.
Fig. 2:
Fig. 2:. Sensitivity of replication-competent HIV to 3BNC117 and 10–1074 and pharmacokinetics.
a-b. 80% inhibitory concentrations (IC80) of 3BNC117 and 10–1074 against autologous, replication-competent viral isolates from study participants in the bNAb arm of Group 1 and Group 2. Near clonal replication-competent HIV isolates were generated by coculturing autologous CD4+ T cells with activated CD4+ T cells from healthy HIV-seronegative donors as described in the Methods section. The IC80 concentrations of 3BNC117 and 10–1074 against infectious HIV isolates were determined by the TZM-bl target cell neutralization assay. The grey bars indicate geometric mean values. b. Sensitivity of infectious HIV isolates derived from Participant 02 to 3BNC117 and 10–1074. The IC80 concentrations of 3BNC117 and 10–1074 against replication-competent viral isolates derived during ATI and following reinitiation of ART were determined to examine the decay characteristics of antibody-resistant virus over time. c. Pharmacokinetics of 3BNC117 and 10–1074 in study participants. Plasma levels of 3BNC117 and 10–1074 were determined by a validated luciferase-based neutralization assay in TZM-bl cells. The red and green lines represent geometric mean values of 3BNC117 and 10–1074, respectively.
Fig. 3:
Fig. 3:. Dynamics of HIV reservoirs.
a. Frequencies of CD4+ T cells carrying total HIV DNA, cell-associated HIV RNA, intact proviral DNA, and replication-competent HIV are shown in 5 study participants in the bNAb arm of Group 1 in whom sustained virologic remission was achieved following ATI. b. Dynamics of HIV reservoirs in the CD4+ T cells of Group 1 bNAb study participants (n=5) prior to and following multiple infusions of 3BNC117 and 10–1074. The black lines indicate geometric mean values. Statistical significance was tested with the two-sided Wilcoxon’s matched-pairs signed-rank test. c. Comparison of fold changes in the size of HIV reservoirs over time between the bNAb arm (n=5) and a control cohort of infected individuals (n=13) who initiated ART during the acute/early phase of infection and did not undergo therapeutic interventions or ATI. The black lines indicate median values. The P value was determined using the two-sided Mann-Whitney test.

Comment in

References

    1. Deeks SG, Lewin SR & Havlir DV The end of AIDS: HIV infection as a chronic disease. Lancet 382, 1525–1533 (2013). - PMC - PubMed
    1. Chun TW, Moir S & Fauci AS HIV reservoirs as obstacles and opportunities for an HIV cure. Nat Immunol 16, 584–589 (2015). - PubMed
    1. Chun TW, Eisinger RW & Fauci AS Durable Control of HIV Infection in the Absence of Antiretroviral Therapy: Opportunities and Obstacles. JAMA 322, 27–28 (2019). - PubMed
    1. Ndung’u T, McCune JM & Deeks SG Why and where an HIV cure is needed and how it might be achieved. Nature 576, 397–405 (2019). - PMC - PubMed
    1. Cohn LB, Chomont N & Deeks SG The Biology of the HIV-1 Latent Reservoir and Implications for Cure Strategies. Cell Host Microbe 27, 519–530 (2020). - PMC - PubMed

Publication types

MeSH terms