

The joint effects of physical activity and air pollution on type 2 diabetes in older adults
- PMID: 35650529
- PMCID: PMC9158242
- DOI: 10.1186/s12877-022-03139-8
The joint effects of physical activity and air pollution on type 2 diabetes in older adults
Abstract
Background: Older adults with type 2 diabetes are at higher risk of developing common geriatric syndromes and have a lower quality of life. To prevent type 2 diabetes in older adults, it's unclear whether the health benefits of physical activity (PA) will be influenced by the harms caused by increased exposure to air pollution during PA, especially in developing countries with severe air pollution problem. We aimed to investigate the joint effects of PA and long-term exposure to air pollution on the type 2 diabetes in older adults from China.
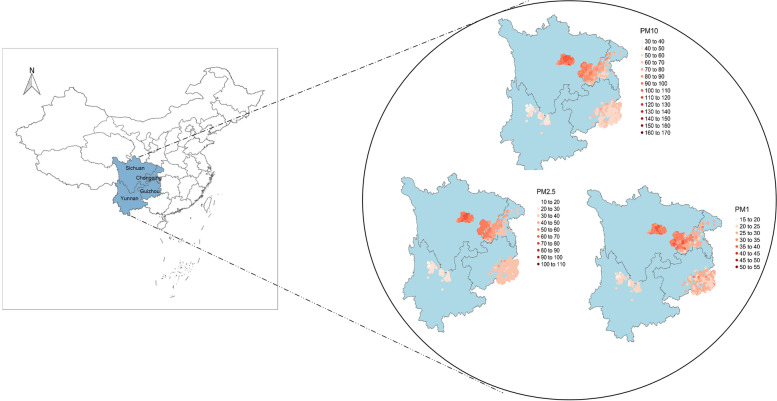
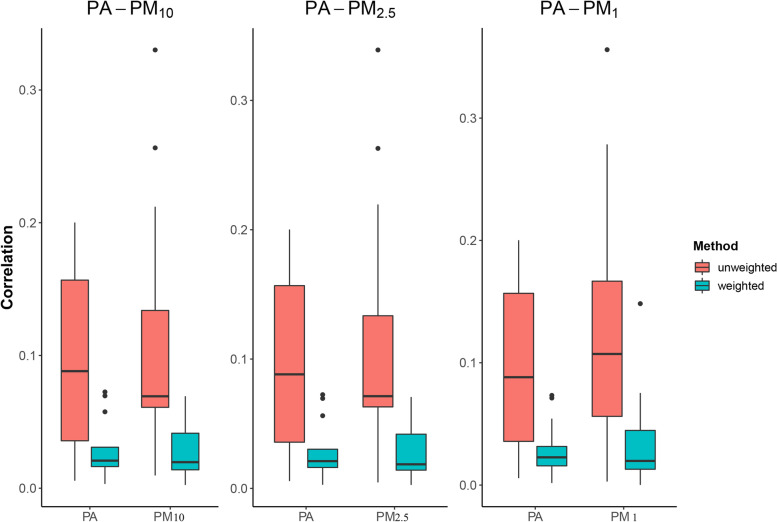
Methods: This cross-sectional study was based on the China Multi-Ethnic cohort (CMEC) study. The metabolic equivalent of PA was calculated according to the PA scale during the CMEC baseline survey. High resolution air pollution datasets (PM10, PM2.5 and PM1) were collected from open products. The joint effects were assessed by the marginal structural mean model with generalized propensity score.
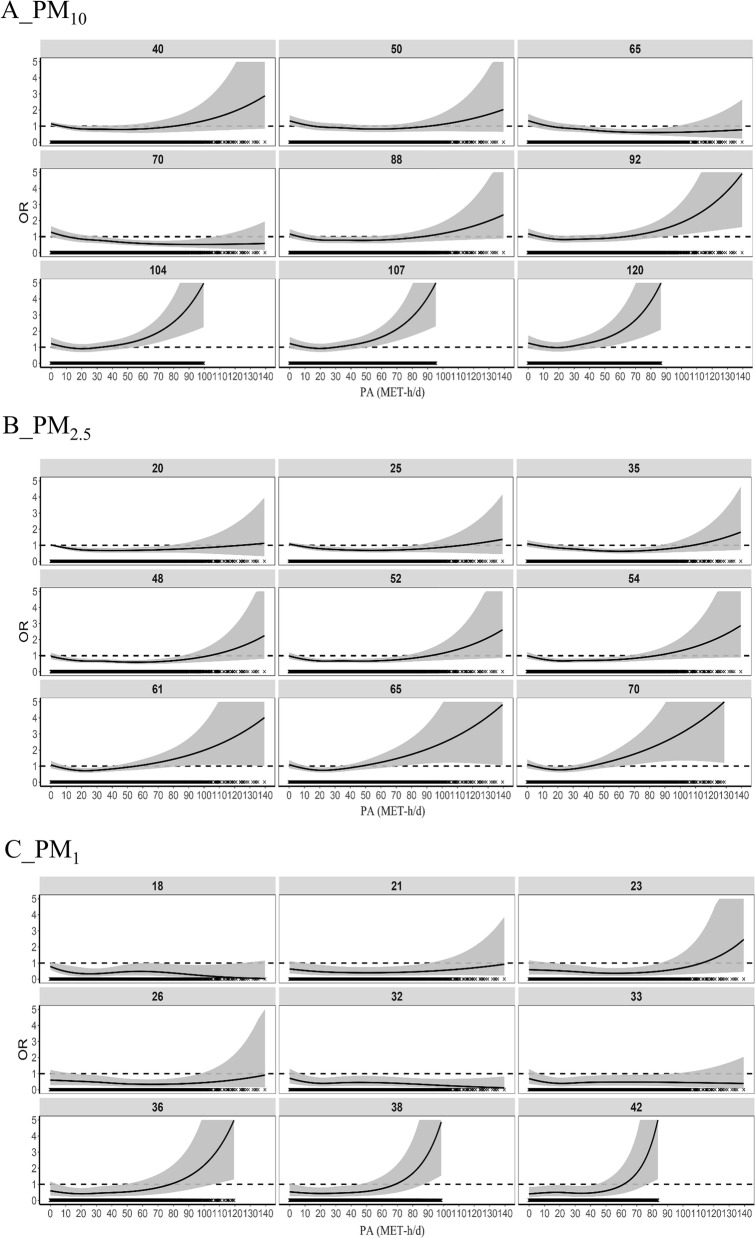
Results: A total of 36,562 participants aged 50 to 79 years were included in the study. The prevalence of type 2 diabetes was 10.88%. The mean (SD) level of PA was 24.93 (18.60) MET-h/d, and the mean (SD) level of PM10, PM2.5, and PM1 were 70.00 (23.32) µg/m3, 40.45 (15.66) µg/m3 and 27.62 (6.51) µg/m3, respectively. With PM10 < 92 µg/m3, PM2.5 < 61 µg/m3, and PM1 < 36 µg/m3, the benefit effects of PA on type 2 diabetes was significantly greater than the harms due to PMs when PA levels were roughly below 80 MET-h/d. With PM10 ≥ 92 µg/m3, PM2.5 ≥ 61 µg/m3, and PM1 ≥ 36 µg/m3, the odds ratio (OR) first decreased and then rose rapidly with confidence intervals progressively greater than 1 and break-even points close to or even below 40 MET-h/d.
Conclusions: Our findings implied that for the prevention of type 2 diabetes in older adults, the PA health benefits outweighed the harms of air pollution except in extreme air pollution situations, and suggested that when the air quality of residence is severe, the PA levels should ideally not exceed 40 MET-h/d.
Keywords: Air pollution; Joint effects; Older adults; Physical activity; Type 2 diabetes.
© 2022. The Author(s).
Conflict of interest statement
The authors declare that they have no competing interests.
Figures
References
-
- Mohan V, Khunti K, Chan SP, Filho FF, Tran NQ, Ramaiya K, et al. Management of Type 2 Diabetes in Developing Countries: Balancing Optimal Glycaemic Control and Outcomes with Affordability and Accessibility to Treatment. Diabetes Ther. 2020;11(1):15–35. doi: 10.1007/s13300-019-00733-9. - DOI - PMC - PubMed
-
- International Diabetes Federation. IDF Diabetes Atlas, 9th edn. Brussels: International Diabetes Federation; 2019.
Publication types
MeSH terms
Substances
LinkOut - more resources
Full Text Sources
Medical
Miscellaneous
