. 2022 Jun 1;22(1):511.
doi: 10.1186/s12879-022-07486-0.

Impact of vaccine hesitancy on secondary COVID-19 outbreaks in the US: an age-structured SIR model

Affiliations

Impact of vaccine hesitancy on secondary COVID-19 outbreaks in the US: an age-structured SIR model

Alfonso de Miguel-Arribas et al. BMC Infect Dis. .

Abstract

Background: The COVID-19 outbreak has become the worst pandemic in at least a century. To fight this disease, a global effort led to the development of several vaccines at an unprecedented rate. There have been, however, several logistic issues with its deployment, from their production and transport, to the hesitancy of the population to be vaccinated. For different reasons, an important amount of individuals is reluctant to get the vaccine, something that hinders our ability to control and-eventually-eradicate the disease.

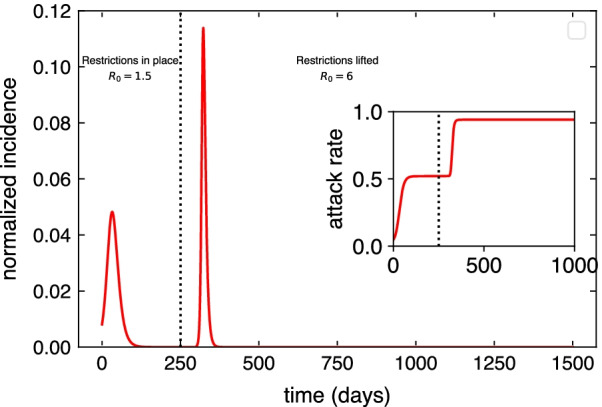
Materials and methods: Our aim is to explore the impact of vaccine hesitancy when highly transmissible SARS-CoV-2 variants of concern spread through a partially vaccinated population. To do so, we use age-stratified data from surveys on vaccination acceptance, together with age-contact matrices to inform an age-structured SIR model set in the US.

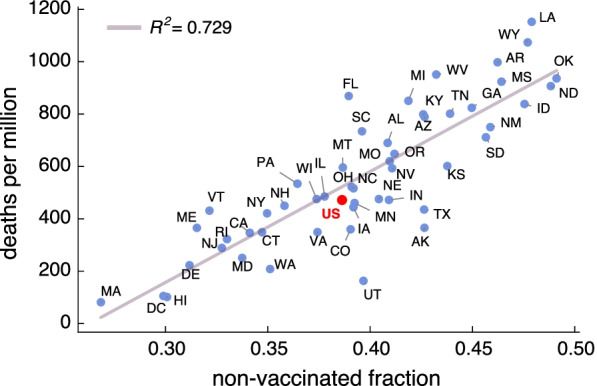
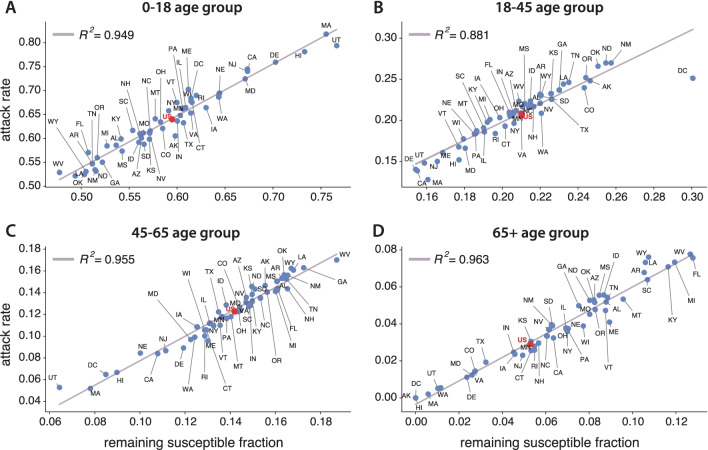
Results: Our results show that per every one percent decrease in vaccine hesitancy up to 45 deaths per million inhabitants could be averted. A closer inspection of the stratified infection rates also reveals the important role played by the youngest groups. The model captures the general trends of the Delta wave spreading in the US (July-October 2021) with a correlation coefficient of [Formula: see text].

Conclusions: Our results shed light on the role that hesitancy plays on COVID-19 mortality and highlight the importance of increasing vaccine uptake in the population, specially among the eldest age groups.

Keywords: Age-structured SIR; COVID-19; Hesitancy; Mathematical modeling; Vaccination.


Conflict of interest statement

The authors declare that they have no competing interests.

Figures

Fig. 1
Fig. 1
Proposed baseline scenario. Following the first wave of the epidemic, part of the population acquires natural immunity. Then, we simulate the propagation of a mitigated outbreak due to the presence of some restrictions, social distancing and prophylaxis measures, leading to a slower propagation of the original variant of the disease (R0=1.5). After the outbreak extinguishes a back-to-normal situation is assumed and all prevention measures are lifted. Then, an outbreak is seeded again with a higher basic reproductive number, R0=6. On top of this baseline scenario, we will introduce a vaccination campaign during the first outbreak and explore the impact of vaccination hesitancy on the second outbreak
Fig. 2
Fig. 2
Comparison of spreading dynamics. Comparison of peak incidences and final epidemic sizes for the states of Oklahoma (OK), which has the highest vaccine hesitancy, and Massachusetts (MA), where the vaccine hesitancy is the lowest according to surveys [39]. Continuous trajectories (blue and red) represent the simulation with vaccination campaign, whereas dotted trajectories represent the simulation without introducing the vaccination campaign. All simulations started with a fully susceptible population
Fig. 3
Fig. 3
Attack rates scatter plots. Scatter plot of attack rates after the full epidemic (first outbreak with R0=1.5 and the second one with R0=6) versus the non-vaccinated fraction of individuals (A), and attack rates of the second outbreak (R0=6) versus the remaining susceptible fraction after the first outbreak (B) for every US state. The red dot corresponds to a simulation on a population representing the whole country. It is clearly seen that higher hesitancy translates into higher attack rates
Fig. 4
Fig. 4
US map. Representation on the US map of the attack rates of every state after the end of the epidemic trajectory proposed in this paper (A), and the fraction of non-vaccinated individuals (B). Some spatial clustering can be appreciated along the country, even though in the simulations all states are completely isolated
Fig. 5
Fig. 5
Death scatter plots. Scatter plot of deaths per million during the second outbreak versus the non-vaccinated fraction at the end of the first outbreak for every US state. Results also shown for a simulation of the epidemic for the whole country as if it were a single age-structured population (red dot). The model does not include deaths as part of the dynamics, but they can be estimated by applying the infection fatality rate to the final fraction of individuals in the removed compartment for each age class (Eq. (5))
Fig. 6
Fig. 6
Attack rate scatter plots by age. Scatter plot of attack rates during the second outbreak versus the remaining susceptible fraction for every US state. Top-left (A): 0–18 years old group. Top-right (B): 18–45 years old group. Bottom-left (C): 45–65 years old group. Bottom-right (D): over 65 years old group. Results also shown for a simulation of the epidemic for the whole country as if it were a single age-structured population (red dot). These high correlations show also the relevant role of age structure in the disease propagation
Fig. 7
Fig. 7
Comparison of model output and real data for the Delta wave in the US. Correlation analysis (Pearson correlation coefficient) for data and model observables. Left A: Data vaccinated fraction until 31/10/2021 versus model/survey vaccinated fraction. Center B: Data based deaths per million versus real vaccinated fraction. Right C: Data based deaths vs. model deaths per million. High correlations are obtained between the model output and real data

References

    1. Saladino V, Algeri D, Auriemma V. The psychological and social impact of Covid-19: new perspectives of well-being. Front Psychol. 2020;11:2550. - PMC - PubMed
    1. Tan BY, Chew NW, Lee GK, Jing M, Goh Y, Yeo LL, et al. Psychological impact of the COVID-19 pandemic on health care workers in Singapore. Ann Intern Med. 2020;173(4):317–320. doi: 10.7326/M20-1083. - DOI - PMC - PubMed
    1. Romero CS, Delgado C, Catalá J, Ferrer C, Errando C, Iftimi A, et al. COVID-19 psychological impact in 3109 healthcare workers in Spain: the PSIMCOV group. Psychol Med. 2020;52:1–7. - PMC - PubMed
    1. Verelst F, Kuylen E, Beutels P. Indications for healthcare surge capacity in European countries facing an exponential increase in coronavirus disease (COVID-19) cases, March 2020. Eurosurveillance. 2020;25(13):2000323. doi: 10.2807/1560-7917.ES.2020.25.13.2000323. - DOI - PMC - PubMed
    1. Armocida B, Formenti B, Ussai S, Palestra F, Missoni E. The Italian health system and the COVID-19 challenge. Lancet Public Health. 2020;5(5):e253. doi: 10.1016/S2468-2667(20)30074-8. - DOI - PMC - PubMed

Supplementary concepts