. 2022 May 16:13:828734.
doi: 10.3389/fimmu.2022.828734. eCollection 2022.

Extrafollicular Plasmablasts Present in the Acute Phase of Infections Express High Levels of PD-L1 and Are Able to Limit T Cell Response

Affiliations

Extrafollicular Plasmablasts Present in the Acute Phase of Infections Express High Levels of PD-L1 and Are Able to Limit T Cell Response

Melisa Gorosito Serrán et al. Front Immunol. .

Abstract

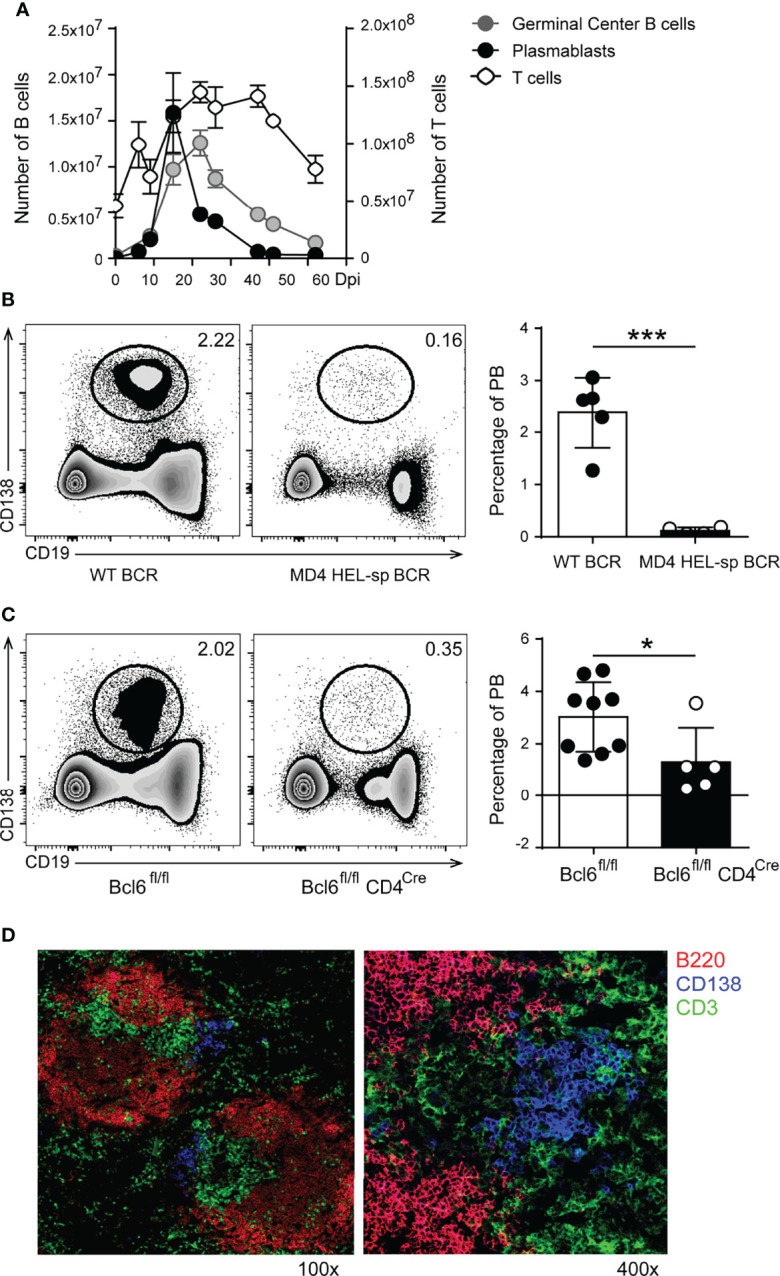
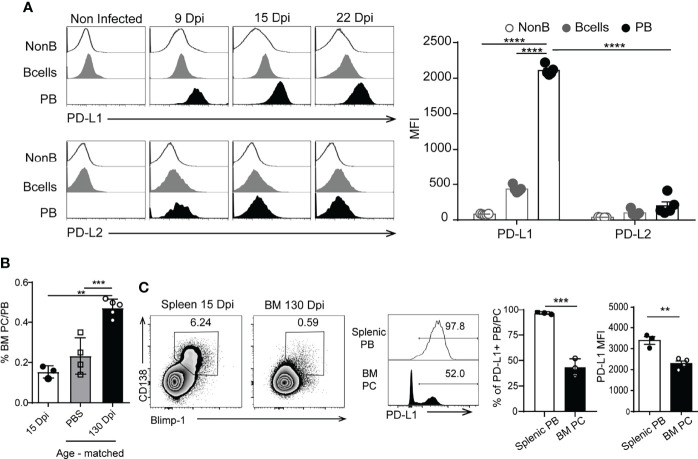
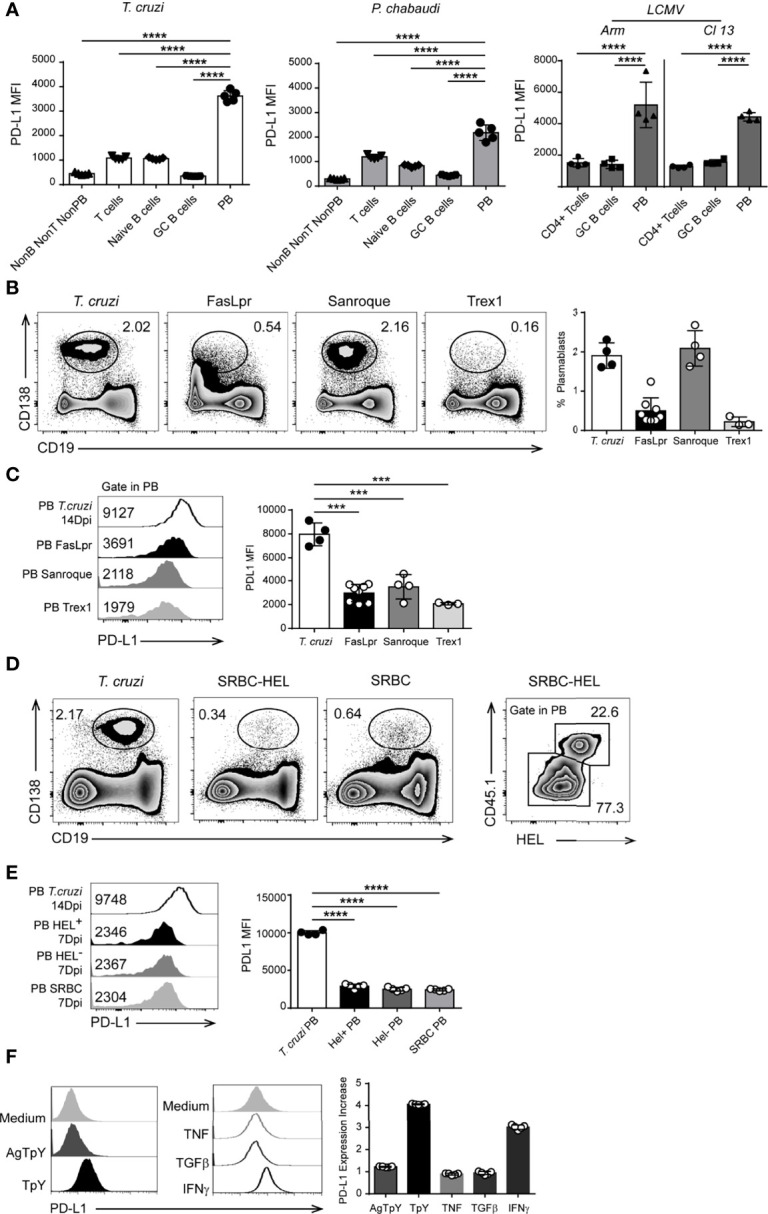
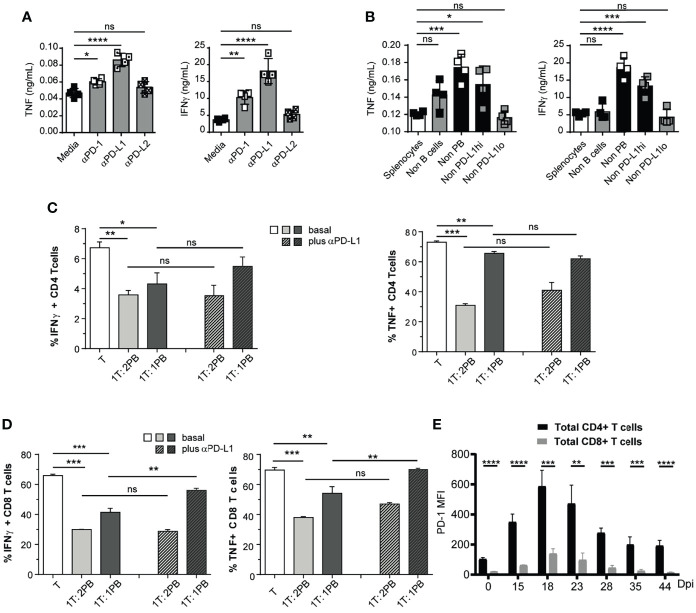
During infections with protozoan parasites or some viruses, T cell immunosuppression is generated simultaneously with a high B cell activation. It has been described that, as well as producing antibodies, plasmablasts, the differentiation product of activated B cells, can condition the development of protective immunity in infections. Here, we show that, in T. cruzi infection, all the plasmablasts detected during the acute phase of the infection had higher surface expression of PD-L1 than other mononuclear cells. PD-L1hi plasmablasts were induced in vivo in a BCR-specific manner and required help from Bcl-6+CD4+T cells. PD-L1hi expression was not a characteristic of all antibody-secreting cells since plasma cells found during the chronic phase of infection expressed PD-L1 but at lower levels. PD-L1hi plasmablasts were also present in mice infected with Plasmodium or with lymphocytic choriomeningitis virus, but not in mice with autoimmune disorders or immunized with T cell-dependent antigens. In vitro experiments showed that PD-L1hi plasmablasts suppressed the T cell response, partially via PD-L1. Thus, this study reveals that extrafollicular PD-L1hi plasmablasts, whose peaks of response precede the peak of germinal center response, may have a modulatory function in infections, thus influencing T cell response.

Keywords: B cell; LCMV; PD-L1; Plasmodium; Trypanosoma cruzi; immunosuppression; microorganism evasion; plasmablasts/plasma cells.


Conflict of interest statement

The authors declare that the research was conducted in the absence of any commercial or financial relationships that could be construed as a potential conflict of interest.

Figures

Figure 1
Figure 1
In T. cruzi infection, the plasmablast response peaks before GC reaction, was generated in a BCR specific manner and required Bcl-6+CD4+T cell collaboration. (A) Kinetics of plasmablasts (PB, CD19intB220lowCD138hi), Germinal Center (GC) B cells (CD19+CD3-CD138- B220+CD38lowBcl6+) and CD3+CD4+ T cells number in the spleen of T. cruzi infected mice. (B) Representative flow cytometry plots and statistical analysis of the percentage of splenic PB (CD138+CD19int/low) from WT (WT BCR, n = 5) and MD4 (HEL-sp BCR, n = 8) mice at 14 Dpi with T. cruzi (***p < 0.001, two tailed t Test). (C) Representative flow cytometry plots and statistical analysis of the percentage of splenic PB from Cre negative littermates Bcl6fl/fl (n = 9) and Bcl6fl/flCD4Cre (Bcl-6negCD4+ T cells, n = 5) mice at 14 Dpi with T. cruzi. (*p < 0.05, two tailed t Test) (D) Representative Immunofluorescence of spleen sections (7um) from T. cruzi-infected C57BL/6 mice obtained at 14 Dpi, stained with anti-B220 (red), anti-CD3 (green) and anti-CD138 (blue). Magnification: x100 (left) and x400 (right) (n = 9). Results shown in (A, D) are representative of five independent experiments. Data in (B, C) are representative of two independent experiments.
Figure 2
Figure 2
Plasmablasts from T. cruzi-infected mice expressed high levels of PD-L1. (A) Representative histograms of PD-L1 or PD-L2 expression on splenic non-B cells (CD19-CD138-B220-), B cells (CD19+CD3-CD138-B220+) from non-infected mice (n=5) and T. cruzi-infected C57BL/6 mice (n=5) and on plasmablasts (PB) (CD19intB220lowCD138hi) from T. cruzi-infected C57BL/6 mice evaluated at 9, 15 and 22 Dpi. Statistical analysis of mean fluorescence intensity (MFI) of PD-L1 or PD-L2 on the mentioned cells analyzed at 15 Dpi. ****p < 0.0001 one-way ANOVA, Bonferroni post hoc test. (B) Statistical analysis of the frequency of PB/PC (plasma cell) CD138+Blimp-1+ of live single lymphocytes (gated on IgD-IgM-CD11b-CD24-) from bone marrow (BM) obtained at 15 Dpi (white bar) and at 130 Dpi with T. cruzi (black bar). Cells from BM from age-matched non-infected mice, injected with PBS, were used as controls (gray bar). (C) Representative plots of CD138 vs Blimp-1 of live single lymphocytes (gated on IgD-IgM-CD11b-CD24-) from spleen and bone marrow (BM) obtained at 15 Dpi and 130 Dpi with T. cruzi, respectively. Representative histograms of PD-L1 on gated CD138+Blimp-1+B220+ cells. Numbers in histograms indicate the percentage of PD-L1+ cells. Bar graph shows statistical analysis of the frequency of PD-L1+ PB/PC and MFI of PD-L1+ on splenic PB from 15 Dpi-Tcruzi infected mice (white bar) and 130 Dpi-BM plasma cells (PC). **p < 0.01, one-way ANOVA, Bonferroni post hoc test. Data in (A, B) are representative of three independent experiments. ***p < 0.001.
Figure 3
Figure 3
PD-L1hi plasmablasts were present in infected but not in autoimmune mice. (A) Statistical analysis of MFI of PD-L1 on Non-B non-T non-PB cells (CD3-CD19-B220-CD138-), T cells (CD3+CD19-B220-), naïve B cells (CD19+CD3-CD138-B220+IgD+CD38+Bcl6-), GC B cells (CD19+CD3-CD138-B220+CD38lowBcl6+) and plasmablasts (PB, CD19 intCD138+) from the spleen of T. cruzi-infected mice (n=5) obtained at 14 Dpi, or from the spleen of P. chabaudi-infected mice obtained at 10 Dpi (n=5); or CD4+ T cells, GC B cells, and PB from the spleen of Arm- or Cl13 LCMV-infected mice obtained at 9 Dpi (n = 4 for each LCMV infection). ****p < 0.0001, one-way ANOVA, Bonferroni post hoc test. (B) Representative flow cytometry plots and statistical analysis of the percentage of splenic plasmablasts from T. cruzi-infected- and from FasLpr, Sanroque and Trex1 mice. C57BL6 mice (n = 4) were infected with T. cruzi Y strain, and the spleens were obtained at 14 Dpi. Spleens from FasLpr (n = 7), Sanroque (n = 4) and Trex1 (n = 3) mice were obtained at 10-12 weeks of age. Splenocytes were stained with anti-B220, anti-CD138 and anti-PD-L1. (C) Representative histograms and statistical analysis of PD-L1 expression (MFI) on plasmablasts (PB) from the spleen of T cruzi-infected mice and FasLpr, Sanroque and Trex1 mice. (D) Representative flow cytometry plots of the percentage of plasmablasts from 14 Dpi-T. cruzi-infected mice and from mice immunized with 2x10⁸ SRBC or with SRBC conjugated with HEL. SWHEL-specific B cells identified as CD45.1+HEL+ cells and the percentage of SWHEL-specific plasmablasts CD138+CD19low in CD45.2 mice transferred with 30.000 HEL-specific B cells and immunized with 2x10⁸ SRBC conjugated with HEL. (E) Representative flow cytometry histograms and statistical analysis of PD-L1 expression (MFI) on plasmablasts from T. cruzi-infected mice (n = 4), SWHEL-specific (PB HEL+) and -non-specific (PB HEL-) plasmablasts from CD45.2 mice transferred with 30,000 HEL-specific B cells and immunized with 2x10⁸ SRBC conjugated with HEL (n = 5), and on plasmablasts from mice immunized with SRBC (7 DPI) (PB SRBC, n = 5). (F) Representative histograms of PD-L1 expression on B cells cultured with medium, T. cruzi trypomastigote antigens (AgTpY), live T. cruzi trypomastigotes (TpY), TNF, TGFβ, and IFNγ. Bar graph shows statistical analysis of the PD-L1 expression increase, described as a fold change, on B cells cultured with the mentioned stimulus respect to medium (n = 5). ***p < 0.001, ****p < 0.0001 one-way ANOVA, Bonferroni post hoc test. Data in (A) are representative of three independent experiments and in B–F) are representative of two independent experiments.
Figure 4
Figure 4
Plasmablasts from T. cruzi-infected mice suppressed CD8+ T cell response via PD-L1. (A) 1 x 10⁵ Splenocytes from T. cruzi-infected mice obtained at 14 Dpi were incubated with T. cruzi antigens and cultured for 48h with media, anti-PD-1, anti-PD-L1, or anti-PD-L2. TNF and IFNγ concentrations were determined by Elisa in the culture supernatant. (B) 1x 10⁵ Non-B (CD19negCD138neg) cells in a suspension of total splenocytes (non-depleted) from T. cruzi infected mice obtained at 14 Dpi or depleted of B cells (Non-B cells), plasmablasts (Non-PB), PD-L1hi cells (Non-PD-L1hi) or PD-L1low (Non-PD-L1lo) cells were cultured with T. cruzi antigens for 48h. TNF and IFNγ concentrations were determined by Elisa in the culture supernatant. (C) Purified CD4+ and (D) CD8+ (responder T cell from non-infected mice activated with anti-CD3 plus anti-CD28 were co-cultured with sorted plasmablast from T. cruzi-infected mice obtained at 14 Dpi in 1:1 or 1:2 ratio with for 3 days, in the presence of control antibody (basal) or anti-PD-L1. Bars show the frequency of TNF+ and IFNγ+ CD4+ or CD8+ T cells which were determined by flow cytometry. (E) PD-1 expression, determined as MFI by flow cytometry, of splenic CD4+ (black) and CD8+ (grey) T cells obtained from T. cruzi-infected mice at different Dpi. Data in (A–D) are representative of two independent experiments. ta are shown as mean ± SD of triplicates cultures. *p < 0.05, **p < 0.01, ***p < 0.001, ****p < 0.0001 two-tailed t Test). ns, non significant.

Similar articles

Cited by

References

    1. Geiger A, Bossard G, Sereno D, Pissarra J, Lemesre J-L, Vincendeau P, et al. . Escaping Deleterious Immune Response in Their Hosts: Lessons From Trypanosomatids. Front Immunol (2016) 7:212/abstract. doi: 10.3389/fimmu.2016.00212/abstract - DOI - PMC - PubMed
    1. Zuniga EI, Macal M, Lewis GM, Harker JA. Innate and Adaptive Immune Regulation During Chronic Viral Infections. Annu Rev Virol (2015) 2(1):573–97. doi: 10.1146/annurev-virology-100114-055226 - DOI - PMC - PubMed
    1. Arocena AR, Onofrio LI, Pellegrini AV, Carrera Silva AE, Paroli A, Cano RC, et al. . Myeloid-Derived Suppressor Cells are Key Players in the Resolution of Inflammation During a Model of Acute Infection. Eur J Immunol (2014) 44(1):184–94. doi: 10.1002/eji.201343606 - DOI - PubMed
    1. Morán-Utrera Y, López-Monteon A, Rosales-Encina JL, Méndez-Bolaina E, Ramos-Ligonio A. Trypanosoma Cruzi SSP4 Amastigote Protein Induces Expression of Immunoregulatory and Immunosuppressive Molecules in Peripheral Blood Mononuclear Cells. J Trop Med (2012) 2012:1–10. doi: 10.1155/2012/829139 - DOI - PMC - PubMed
    1. Poncini CV, Giménez G, Pontillo CA, Alba-Soto CD, de Isola ELD, Piazzón I, et al. . Central Role of Extracellular Signal-Regulated Kinase and Toll-Like Receptor 4 in IL-10 Production in Regulatory Dendritic Cells Induced by Trypanosoma Cruzi. Mol Immunol (2010) 47(11–12):1981–8. doi: 10.1016/j.molimm.2010.04.016 - DOI - PubMed

Publication types