. 2022 May 16:13:893576.
doi: 10.3389/fimmu.2022.893576. eCollection 2022.

A Novel GMP Protocol to Produce High-Quality Treg Cells From the Pediatric Thymic Tissue to Be Employed as Cellular Therapy

Affiliations

A Novel GMP Protocol to Produce High-Quality Treg Cells From the Pediatric Thymic Tissue to Be Employed as Cellular Therapy

Esther Bernaldo-de-Quirós et al. Front Immunol. .

Abstract

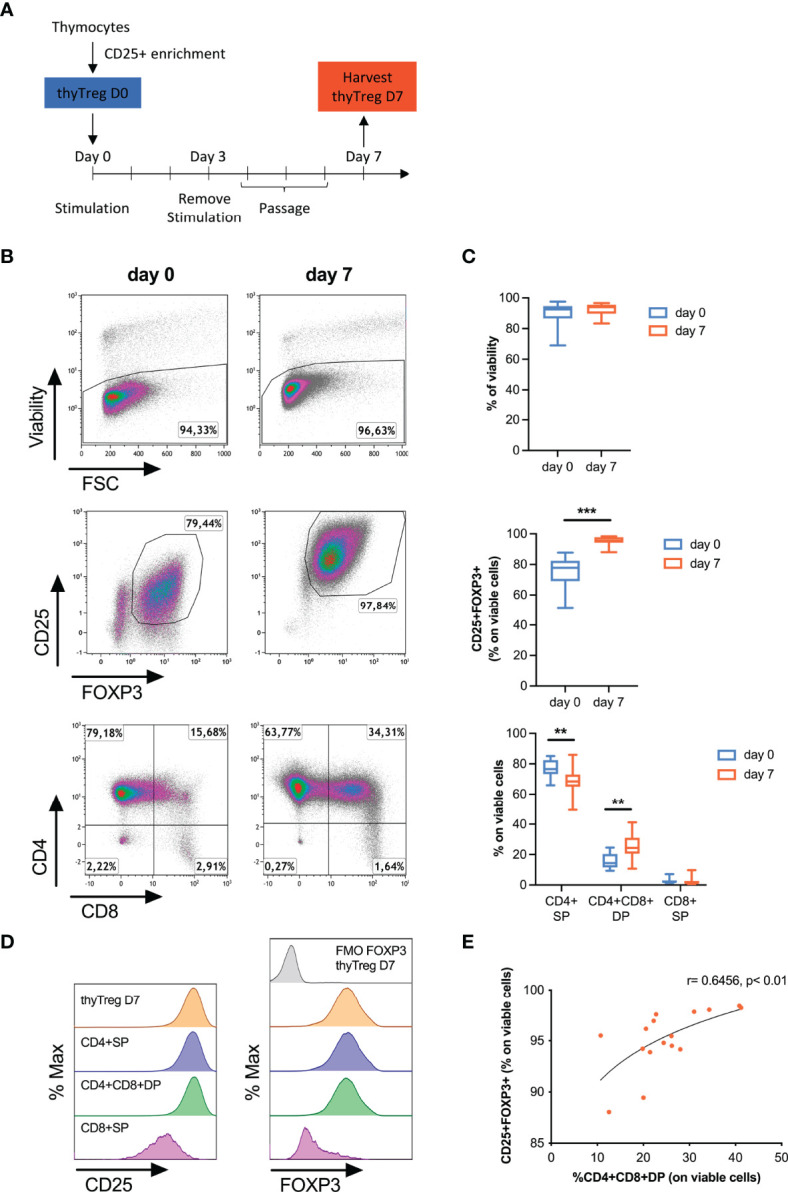
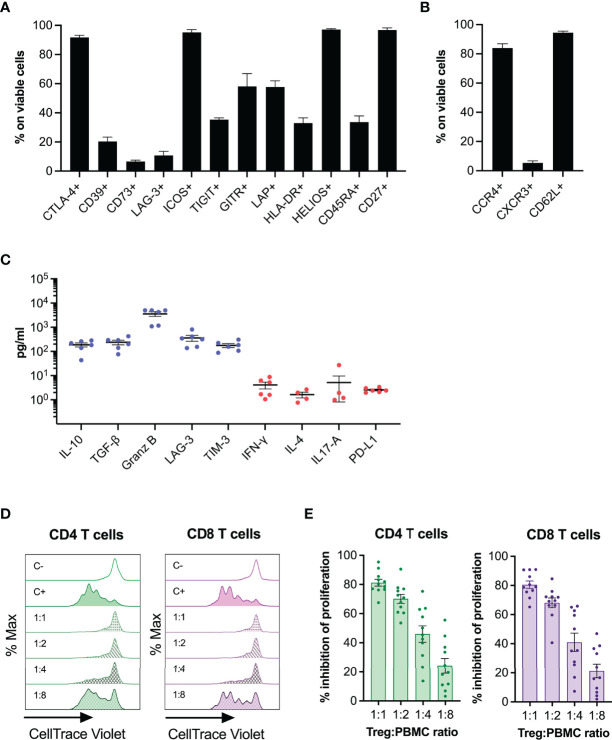
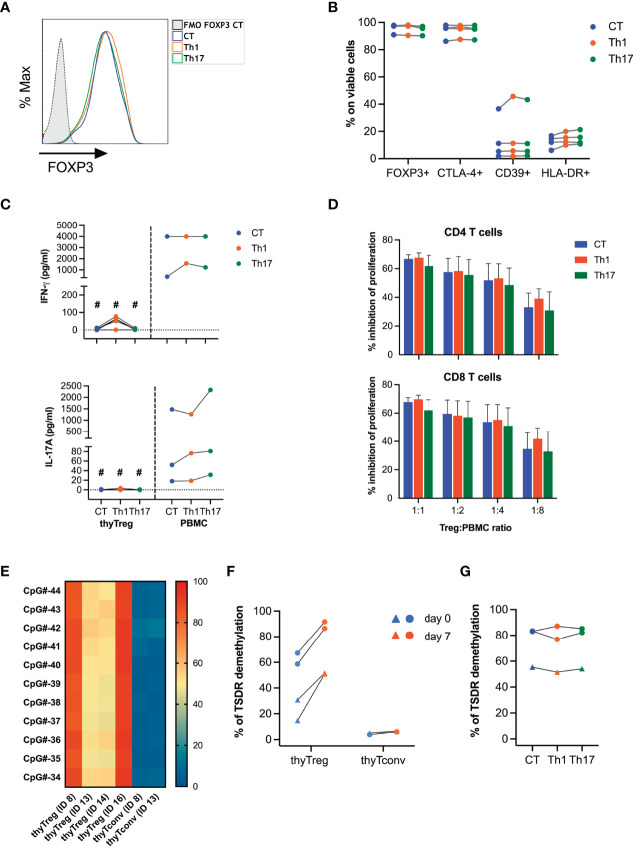
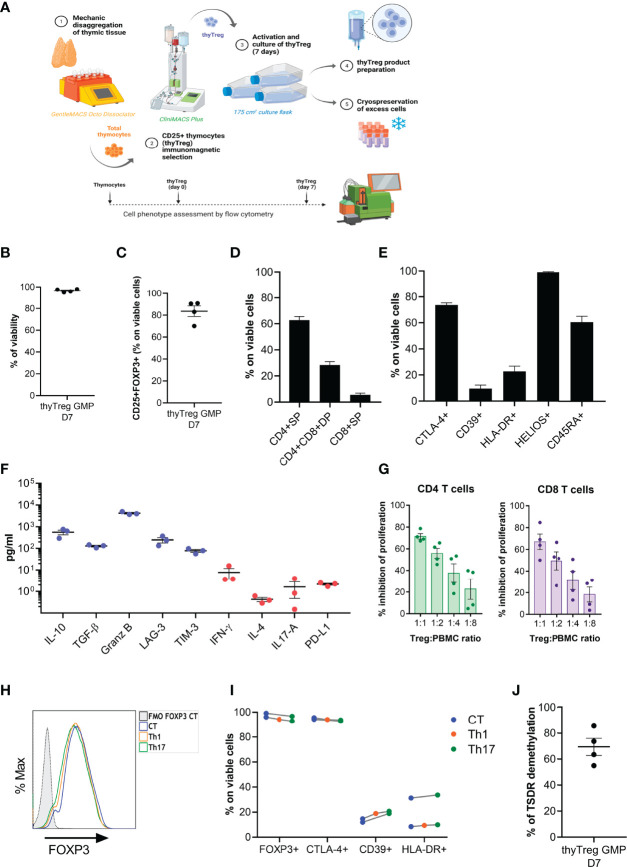
Due to their suppressive capacity, the adoptive transfer of regulatory T cells (Treg) has acquired a growing interest in controlling exacerbated inflammatory responses. Limited Treg recovery and reduced quality remain the main obstacles in most current protocols where differentiated Treg are obtained from adult peripheral blood. An alternate Treg source is umbilical cord blood, a promising source of Treg cells due to the higher frequency of naïve Treg and lower frequency of memory T cells present in the fetus' blood. However, the Treg number isolated from cord blood remains limiting. Human thymuses routinely discarded during pediatric cardiac surgeries to access the retrosternal operative field has been recently proposed as a novel source of Treg for cellular therapy. This strategy overcomes the main limitations of current Treg sources, allowing the obtention of very high numbers of undifferentiated Treg. We have developed a novel good manufacturing practice (GMP) protocol to obtain large Treg amounts, with very high purity and suppressive capacity, from the pediatric thymus (named hereafter thyTreg). The total amount of thyTreg obtained at the end of the procedure, after a short-term culture of 7 days, reach an average of 1,757 x106 (range 50 x 106 - 13,649 x 106) cells from a single thymus. The thyTreg product obtained with our protocol shows very high viability (mean 93.25%; range 83.35% - 97.97%), very high purity (mean 92.89%; range 70.10% - 98.41% of CD25+FOXP3+ cells), stability under proinflammatory conditions and a very high suppressive capacity (inhibiting in more than 75% the proliferation of activated CD4+ and CD8+ T cells in vitro at a thyTreg:responder cells ratio of 1:1). Our thyTreg product has been approved by the Spanish Drug Agency (AEMPS) to be administered as cell therapy. We are recruiting patients in the first-in-human phase I/II clinical trial worldwide that evaluates the safety, feasibility, and efficacy of autologous thyTreg administration in children undergoing heart transplantation (NCT04924491). The high quality and amount of thyTreg and the differential features of the final product obtained with our protocol allow preparing hundreds of doses from a single thymus with improved therapeutic properties, which can be cryopreserved and could open the possibility of an "off-the-shelf" allogeneic use in another individual.

Keywords: GMP manufacturing; Treg; immunotherapy; thyTreg; thymus; tolerance induction.


Conflict of interest statement

The authors declare that the research was conducted in the absence of any commercial or financial relationships that could be construed as a potential conflict of interest.

Figures

Figure 1
Figure 1
Characteristics of manufactured thyTreg. (A) Isolation and culture protocol for thyTreg obtention. (B) Representative flow cytometry dot plots showing the viability, purity and CD4/CD8 phenotype of thyTreg right after isolation (day 0) or after culture (day 7). (C) Summary of the cell viability, purity and CD4/CD8 phenotype of n=16 thyTreg at days 0 (blue) and 7 (orange). The graph shows min-median-max. **,P < 0.01 and ***,P < 0.001 (paired Wilcoxon test). (D) Representative flow cytometry histograms showing CD25 (left) and FOXP3 (right) expression in thyTreg CD4/CD8 subsets. To determine the background signal, the fluorescence minus one (FMO) of FOXP3 is shown. (E) Correlation between the frequency of CD4+CD8+DP and the purity of thyTreg product (Pearson correlation analysis).
Figure 2
Figure 2
Phenotype and functionality of thyTreg cell product. (A) Frequency of phenotypic and functionality markers within thyTreg cells (day 7). (B) Frequency of homing markers within thyTreg cells (day 7). (C) Quantitation of molecules secreted in day 7 thyTreg culture supernatants. Anti-inflammatory molecules in blue; proinflammatory molecules in red. (D) Representative flow cytometry histograms showing CD4 (green) and CD8 T (purple) cell proliferation as CellTrace Violet lost. C-, negative control of proliferation, PBMC cultured alone without stimulation; C+, positive control of proliferation, PBMC cultured alone with anti-CD3/anti-CD28 stimulation; 1:1 to 1:8, stimulated PBMC cultured with thyTreg cells at different thyTreg : PBMC ratios. (E) Summary of the suppressive capacity of thyTreg cells defined as % inhibition of CD4 (green) and CD8 T (purple) cell proliferation at the indicated ratios. Graphs show mean ± SEM.
Figure 3
Figure 3
Stability of thyTreg cell product. (A–D, G) thyTreg cell product was restimulated under control conditions (CT, blue), or under Th1 (orange) or Th17 (green) polarizing conditions and evaluated after 3 days of culture. PBMC were cultured in parallel under the same conditions. (A) Representative flow cytometry histogram showing FOXP3 expression. To determine the background signal, the fluorescence minus one (FMO) of FOXP3 is shown. (B) Frequency of FOXP3, CTLA-4, CD39 and HLA-DR within thyTreg under different culture conditions. Paired Wilcoxon test showed no significant differences between conditions. (C) Quantitation of secreted IFN-γ and IL-17A by thyTreg or PBMC under different culture conditions. Comparison between culture conditions within the same cell type was performed using paired Wilcoxon test, and comparison within the same condition between thyTreg and PBMC were performed using unpaired Mann-Whitney test (#P < 0.05). (D) Summary (n=4) of the suppressive capacity of thyTreg cells cultured under different polarizing conditions defined as % inhibition of CD4 (upper panel) and CD8 T (lower panel) cell proliferation at the indicated ratios. Graphs show mean ± SEM. Paired Wilcoxon test showed no significant differences between conditions. (E) Demethylation level of 11 conserved CpGs at the TSDR region of FOXP3 in n=4 thyTreg cell products and n=2 thyTconv cultured in parallel for 7 days. ID13 and ID14 are female donors. (F) Global TSDR demethylation level (calculated as the mean of demethylation of the 11 CpGs) of thyTreg and ThyTconv right after cell isolation (day 0, blue) or after 7 days of culture (day 7, orange). Triangles represent female donors, and circles represent male donors. (G) Global TSDR demethylation level of thyTreg cultured under different polarizing conditions.
Figure 4
Figure 4
GMP manufacturing of thyTreg. (A) Schematic representation of the procedure and equipment used in the Cell Production Unit for the thyTreg GMP manufacturing. Additionally, the dotted line represents the scheme of the quality evaluation process performed at different stages. (B–E) Summary of the cell viability (B), purity (C) and phenotype (D, E) of n=4 GMP thyTreg. Graphs show mean ± SEM. (F) Quantitation of molecules secreted in day 7 GMP thyTreg culture supernatants. Anti-inflammatory molecules in blue; proinflammatory molecules in red. (G) Summary of the suppressive capacity of GMP thyTreg cells defined as % inhibition of CD4 (green) and CD8 T (purple) cell proliferation at the indicated ratios. Graphs show mean ± SEM. (H) Representative flow cytometry histogram showing the stability of FOXP3 expression of GMP thyTreg cell product under control conditions (CT, blue) or under Th1 (orange) or Th17 (green) polarizing conditions evaluated after 3 days after re-stimulation. To determine the background signal, the fluorescence minus one (FMO) of FOXP3 is shown. (I) Frequency of FOXP3, CTLA-4, CD39 and HLA-DR within GMP thyTreg under different polarizing conditions. (J) Global TSDR demethylation level (calculated as the mean of demethylation of the 11 CpGs) of GMP thyTreg cell product (n=4 males).

References

    1. Shimabukuro-Vornhagen A, Gödel P, Subklewe M, Stemmler HJ, Schlößer HA, Schlaak M, et al. Cytokine Release Syndrome. J Immunother Cancer (2018) 6(1):56. doi: 10.1186/s40425-018-0343-9 - DOI - PMC - PubMed
    1. Zhang JJ, Dong X, Cao YY, Yuan YD, Yang YB, Yan YQ, et al. Clinical Characteristics of 140 Patients Infected With SARS-CoV-2 in Wuhan, China. Allergy (2020) 75(7):1730–41. doi: 10.1111/all.14238 - DOI - PubMed
    1. MacDonald KN, Piret JM, Levings MK. Methods to Manufacture Regulatory T Cells for Cell Therapy. Clin Exp Immunol (2019) 197(1):52–63. doi: 10.1111/cei.13297 - DOI - PMC - PubMed
    1. Sakaguchi S, Miyara M, Costantino CM, Hafler DA. FOXP3+ Regulatory T Cells in the Human Immune System. Nat Rev Immunol (2010) 10(7):490–500. doi: 10.1038/nri2785 - DOI - PubMed
    1. Sojka DK, Huang YH, Fowell DJ. Mechanisms of Regulatory T-Cell Suppression - A Diverse Arsenal for a Moving Target. Immunology (2008) 124(1):13–22. doi: 10.1111/j.1365-2567.2008.02813.x - DOI - PMC - PubMed

Publication types

Substances

Associated data