. 2022 May 16:13:852161.
doi: 10.3389/fgene.2022.852161. eCollection 2022.

First Chromosome-Scale Assembly and Deep Floral-Bud Transcriptome of a Male Kiwifruit

Affiliations

First Chromosome-Scale Assembly and Deep Floral-Bud Transcriptome of a Male Kiwifruit

Jibran Tahir et al. Front Genet. .
No abstract available

Keywords: PacBio and illumina sequencing; long read genome assembly; male kiwifruit genome; male—genetics; sex determining region; transcriptomic of male flower; whole-genome sequencing (WGS).


Conflict of interest statement

The authors declare that the research was conducted in the absence of any commercial or financial relationships that could be construed as a potential conflict of interest.

Figures
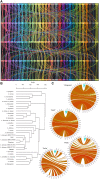
FIGURE 1
FIGURE 1
Comparison of the ‘Russell’ genome with other Actinidia genomes. (A) shows synteny for protein-encoding genes, across the genomes, as they are anchored on respective chromosomes 1-29 in the form of blocks. The synteny as well as inter-chromosomal homology or duplication events, described by co-linearity metrics drawn from BLASTP and MCScanX, for protein-encoding genes. The genomes are in the following order from top to bottom: A. chinensis ‘Hongyang’ (v3), A. chinensis Red5 (v2), A. chinensis ‘Russell’, A. rufa ‘Fuchu’ and A. eriantha ‘White’. Two letter codes were applied as follows: Hy—‘Hongyang’, Re—Red5, Ru—‘Russell’, Ar—A. rufa and Ae—A. eriantha. ‘Hongyang’ chromosome assemblies were renamed to conform to the linkage group numbers used across the other whole-genome assemblies. (B) A bootstrapped dendrogram based on 1,000,000 sampled variants called from coding sequence within publicly available whole-genome sequence data mapped to the ‘Russell’ genome assembly. All nodes gave bootstrap values of 100%, except for nodes marked otherwise as percentages. Clustering shows broad support for clade groupings. The height between nodes represents the distance between clusters of the respective nodes. (C) shows pairwise DNA alignment (using nucmer) between chromosome 25 of the male A. chinensis var. chinensis ‘Russell’ and chromosome 25 from four female Actinidia whole-genome sequences. The pairwise comparisons were with ‘Hongyang’ version 3, Red5 version 2, A. rufa “Fuchu’ and A. eriantha ‘White’. In all comparisons, chromosome 25 from ‘Russell’ is depicted on the right hand side. The turquoise colored mark indicates the male-only first 1.5 Mb region on the sex chromosome. The relatedness between the genomic sequence of each genome pair is depicted by a combination of the width of any individual circos plot “ribbon” (the wider the ribbon the longer the region of genome similarity) and the color used for the ribbon where ribbon color (yellow to red) reflects increasing numbers of links aggregated into bundles using the parameters described in the methods with the unitary scale in circos equivalent to 1 Mb. In all comparisons, the first 1.5 Mb of the ‘Russell’ chromosome has no alignment to any other region of chromosome 25 (nor to any other chromosome) in any of the five female genomes. This region contains the sex determining genes, only expressed in the early stage of anther and carpel tissues.
FIGURE 2
FIGURE 2
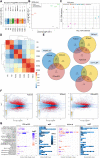
Differential expression (DE) analysis of the transcriptomes of Actinidia chinensis var. chinensis Russell’s immature anther and carpel tissues. (A) shows the boxplot of logCPMs of normalised libraries for all samples, (B) shows multidimensional scaling analysis plot (MDS) for the samples selected for DE analysis, (C) shows the Principal component analysis, and (D) shows the heatmap clustering of all the log-transformed raw counts from samples selected. (E) shows Venn diagram for DE genes between three tissues, using three independent methods including edgeR (test-qlf, FDR < 0.05), DESeq2 (padj <0.05) and voom (test-efit, padj <0.05). (F) shows smearplots for DE genes, highlighted in red at p value ≤0.01 with a blue line marked at logFoldChange (logFC) ±2, in a pair-wise analysis of tissues of First Carpel Stage (FCS) vs. Anther (FCSvsA), Second Carpel Stage (SCS) vs. Anther (SCSvsA) and First Carpel Stage vs. Second Carpel Stage (FCSvsSCS) using edgeR. The yellow-orange dots placed on the left side of the plots are showing logFC in genes that are uniquely expressed in each tissue with a total count of zero for the other group as provided in the smear plotting function, i.e., adding the “smear” of yellow points at low value towards the left side of the graph. The width is adjusted by random uniform numbers of width “smearWidth”. (G) shows fold changes (stacked for each enzyme class as bars) and corresponding adjP values (stacked as bars for enzyme class with fold changes described) for major gene families involved in carbon metabolism within carpel tissue (FCS versus SCS) and between tissues (SCS versus Anthers).The scale for fold changes and adjP values are provided in respective boxes.

References

    1. Akagi T., Henry I. M., Ohtani H., Morimoto T., Beppu K., Kataoka I., et al. (2018). A Y-Encoded Suppressor of Feminization Arose via Lineage-specific Duplication of a Cytokinin Response Regulator in Kiwifruit. Plant Cell 30, 780–795. 10.1105/tpc.17.00787 - DOI - PMC - PubMed
    1. Akagi T., Pilkington S. M., Varkonyi-Gasic E., Henry I. M., Sugano S. S., Sonoda M., et al. (2019). Two Y-Chromosome-Encoded Genes Determine Sex in Kiwifruit. Nat. Plants 5, 801–809. 10.1038/s41477-019-0489-6 - DOI - PubMed
    1. Ampomah-Dwamena C., Mcghie T., Wibisono R., Montefiori M., Hellens R. P., Allan A. C. (2009). The Kiwifruit Lycopene Beta-Cyclase Plays a Significant Role in Carotenoid Accumulation in Fruit. J. Exp. Bot. 60, 3765–3779. 10.1093/jxb/erp218 - DOI - PMC - PubMed
    1. Boetzer M., Henkel C. V., Jansen H. J., Butler D., Pirovano W. (2010). Scaffolding Pre-assembled Contigs Using SSPACE. Bioinformatics 27, 578–579. 10.1093/bioinformatics/btq683 - DOI - PubMed
    1. Bushnell B. (2014). BBMap: A Fast, Accurate, Splice-Aware Aligner. United States. Available at: https://www.osti.gov/servlets/purl/1241166

LinkOut - more resources