. 2022 May 16:13:871927.
doi: 10.3389/fgene.2022.871927. eCollection 2022.

Meckel's Cartilage in Mandibular Development and Dysmorphogenesis

Affiliations

Meckel's Cartilage in Mandibular Development and Dysmorphogenesis

M Kathleen Pitirri et al. Front Genet. .

Abstract

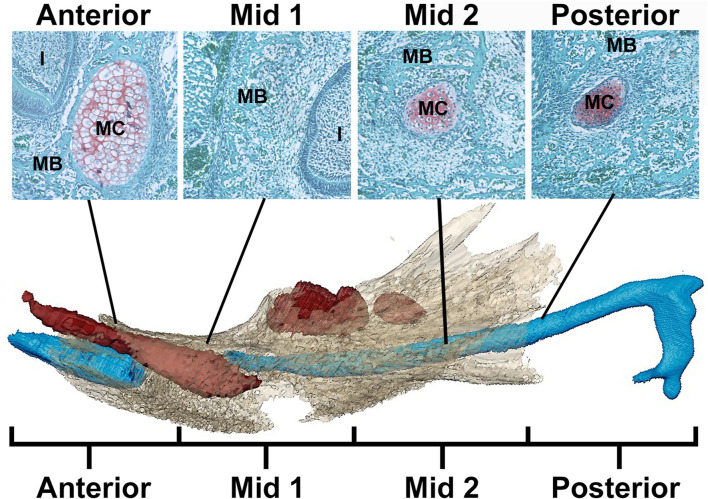
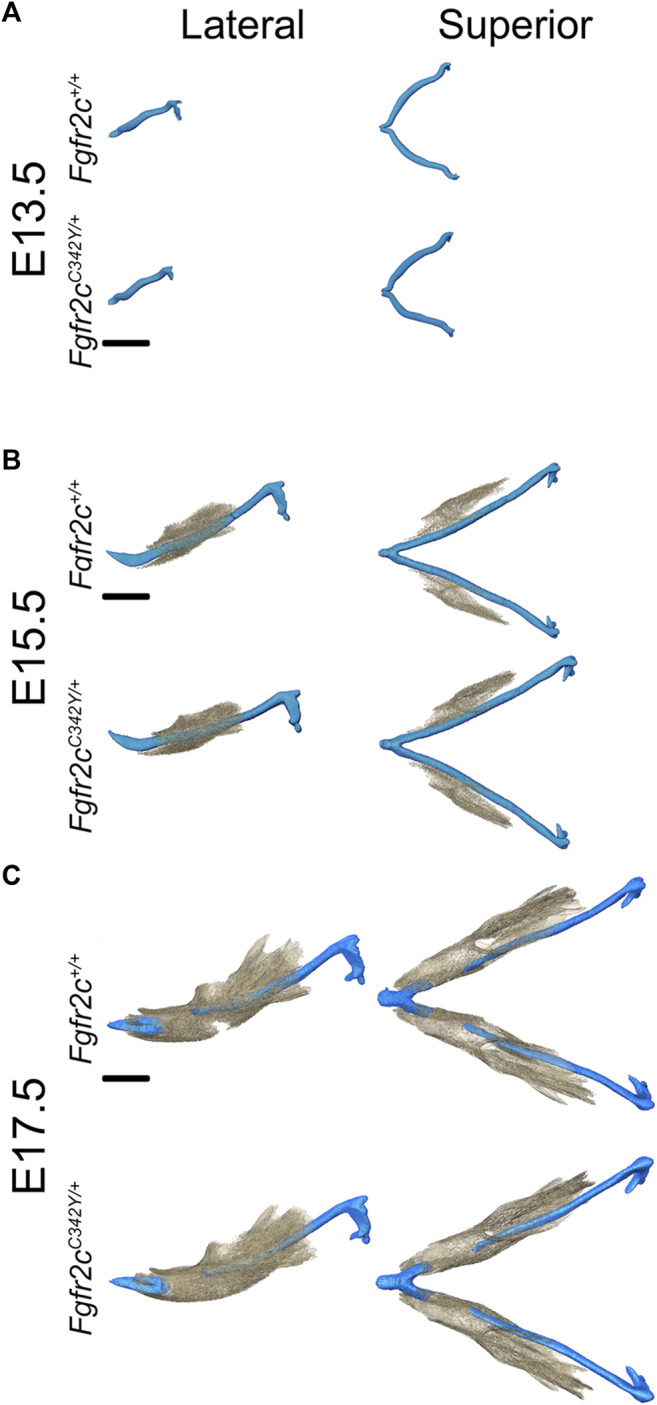
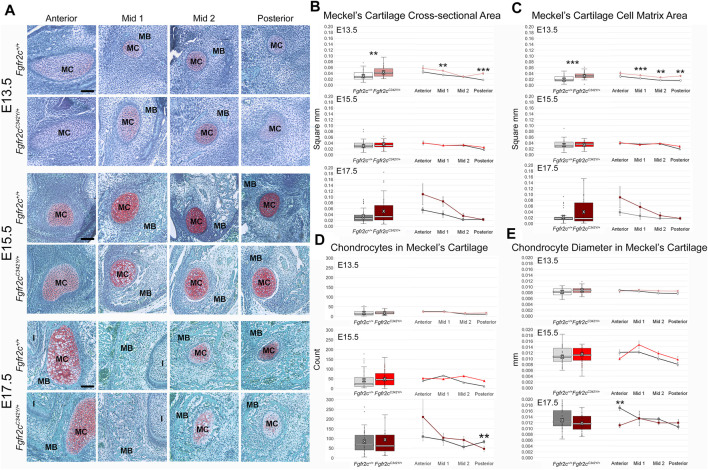
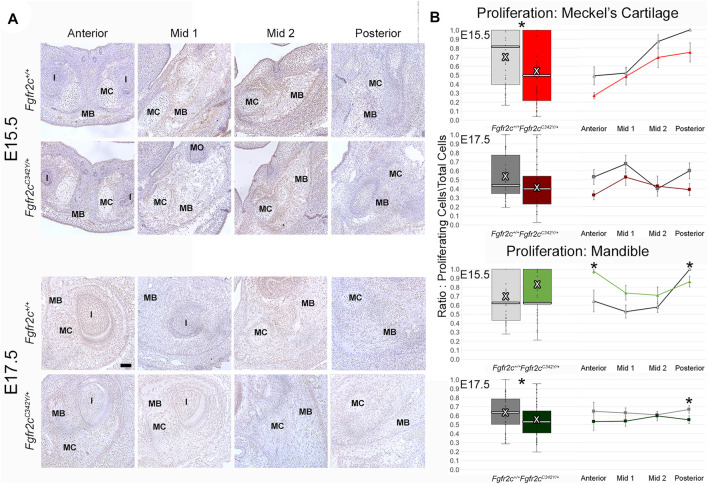
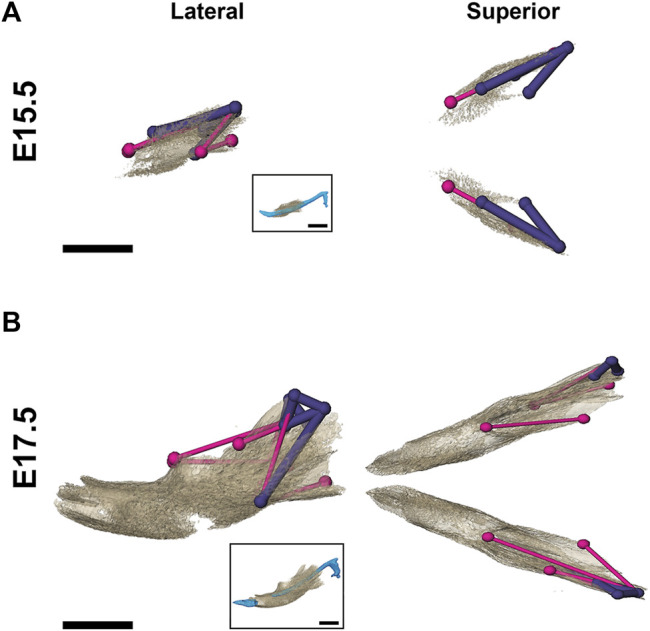
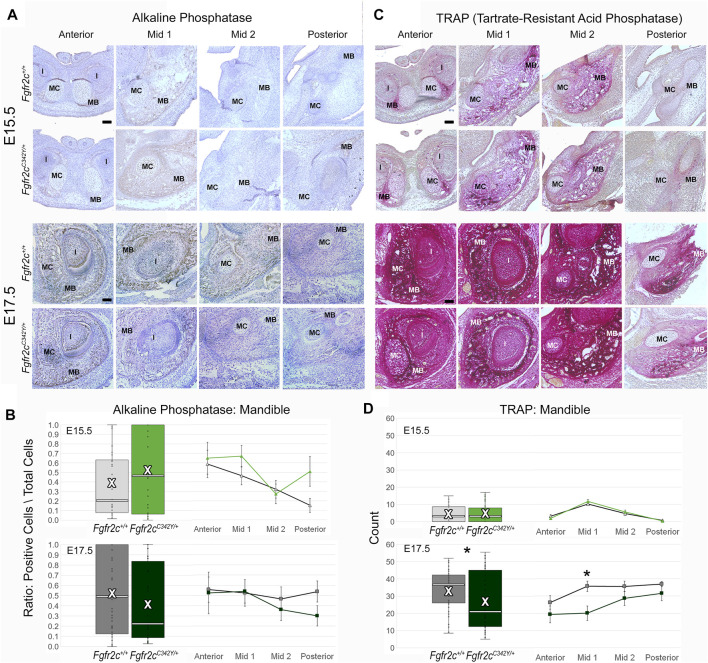
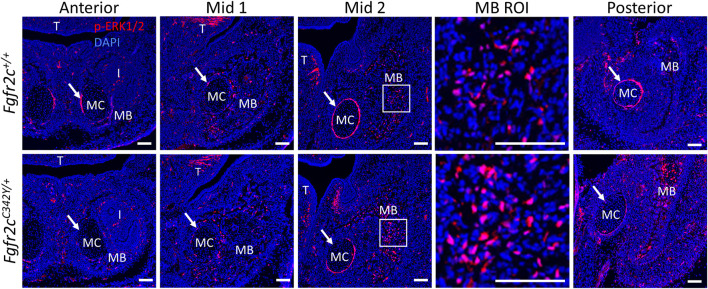
The Fgfr2c C342Y/+ Crouzon syndrome mouse model carries a cysteine to tyrosine substitution at amino acid position 342 (Cys342Tyr; C342Y) in the fibroblast growth factor receptor 2 (Fgfr2) gene equivalent to a FGFR2 mutation commonly associated with Crouzon and Pfeiffer syndromes in humans. The Fgfr2c C342Y mutation results in constitutive activation of the receptor and is associated with upregulation of osteogenic differentiation. Fgfr2cC342Y/+ Crouzon syndrome mice show premature closure of the coronal suture and other craniofacial anomalies including malocclusion of teeth, most likely due to abnormal craniofacial form. Malformation of the mandible can precipitate a plethora of complications including disrupting development of the upper jaw and palate, impediment of the airway, and alteration of occlusion necessary for proper mastication. The current paradigm of mandibular development assumes that Meckel's cartilage (MC) serves as a support or model for mandibular bone formation and as a template for the later forming mandible. If valid, this implies a functional relationship between MC and the forming mandible, so mandibular dysmorphogenesis might be discerned in MC affecting the relationship between MC and mandibular bone. Here we investigate the relationship of MC to mandible development from the early mineralization of the mandible (E13.5) through the initiation of MC degradation at E17.7 using Fgfr2c C342Y/+ Crouzon syndrome embryos and their unaffected littermates (Fgfr2c +/+ ). Differences between genotypes in both MC and mandibular bone are subtle, however MC of Fgfr2c C342Y/+ embryos is generally longer relative to unaffected littermates at E15.5 with specific aspects remaining relatively large at E17.5. In contrast, mandibular bone is smaller overall in Fgfr2c C342Y/+ embryos relative to their unaffected littermates at E15.5 with the posterior aspect remaining relatively small at E17.5. At a cellular level, differences are identified between genotypes early (E13.5) followed by reduced proliferation in MC (E15.5) and in the forming mandible (E17.5) in Fgfr2c C342Y/+ embryos. Activation of the ERK pathways is reduced in the perichondrium of MC in Fgfr2c C342Y/+ embryos and increased in bone related cells at E15.5. These data reveal that the Fgfr2c C342Y mutation differentially affects cells by type, location, and developmental age indicating a complex set of changes in the cells that make up the lower jaw.

Keywords: Crouzon syndrome; craniofacial development; embryonic bone; embryonic cartilage; fibroblast growth factor; lower jaw; mandible; skull.


Conflict of interest statement

The authors declare that the research was conducted in the absence of any commercial or financial relationships that could be construed as a potential conflict of interest.

Figures

FIGURE 1
FIGURE 1
Schematic of MC in mandible identifying regions for analysis. Example histological sections (top) associated with developing mandible and MC (bottom) (after Svandova et al., 2020). In the histological sections, mandibular bone matrix (MB) is stained green and is adjacent to the red-orange MC stained using a standard Safranin-O protocol. Below, the developing mandible (tan), segmented from microCT images, is superimposed with MC (blue) and mandibular teeth (red) segmented from PTA-enhanced microCT images of an E17.5 Fgfr2c +/+ embryo. Note that the color of MC and MB is not consistent between histological images (top) and 3D models created from PT-enhanced microCT images (bottom). MC is divided into 4 equal regions from anterior to posterior with Anterior and Mid 1 containing the break in MC at E17.5 associated with the root of the incisor (I). The incus is not included in this model.
FIGURE 2
FIGURE 2
3D landmarks on developing MC and mandible. (A) Two medial landmarks and 8, 10, or 14 bilateral landmarks shown on MC at E13.5 (top), E15.5 (middle) and E17.5 (bottom) embryos respectively. Lateral views (buccal) are displayed on the left and superior views are on the right. (B) Ten bilateral landmarks are shown on the left hemi-mandible of an E17.5 embryo. Lateral views are displayed on the left (buccal view (top) and lingual view (bottom)) and superior view of the left and right hemi-mandibles are shown on the right. Scale = 1.0 mm.
FIGURE 3
FIGURE 3
Relative orientation of MC and developing mandible in Fgfr2c +/+ and Fgfr2c C342Y/+ embryos. Segmentations of multimodal images of MC (blue) and mandibular bone (tan) of developing mandible at E13.5 (A), E15.5 (B), and E17.5 (C) with representative Fgfr2c +/+ embryos displayed in the top row and Fgfr2c C342Y/+ Crouzon syndrome embryos displayed in the bottom row of each age group. Lateral views (buccal) are displayed on the left and superior views on the right. Not enough bone is mineralized at E13.5 to be detected by microCT. Scale = 1.0 mm.
FIGURE 4
FIGURE 4
Morphological differences of MC in Fgfr2c C342Y/+ embryos and Fgfr2c +/+ littermates at E15.5 and E17.5. Linear distances that are statistically significantly different between genotypes by confidence interval testing (α = 0.10) are shown for E15.5 (A) and E17.5 (B). Thin yellow lines indicate linear distances that are between 5% and 10% larger in Fgfr2c C342Y/+ embryos as compared to Fgfr2c +/+ embryos and thicker orange lines indicate linear distances that are between 10% and 20% larger in Fgfr2c C342Y/+ embryos as compared to Fgfr2c +/+ embryos. For orientation, superimpositions of MC and mandibular bone are inset. Lateral views (buccal) are displayed on the left and superior views are on the right. Scale = 1.0 mm.
FIGURE 5
FIGURE 5
Histomorphometric analysis of MC in Fgfr2c C342Y/+ embryos and Fgfr2c +/+ littermates, E13.5, E15.5, E17.5. (A) Representative Safranin O-stained sections of MC and surrounding mandible bone (MB) in the coronal plane from Fgfr2c +/+ and Fgfr2c C342Y/+ embryos at E13.5 (top two rows), E15.5 (middle two rows) and E17.5 (bottom two rows). Chondrocytes and matrix are identified by the red-orange Safranin O stain with green bone matrix surrounding (MB). The incisor (I) is adjacent to MC and MB in Anterior and Mid 1. Scale = 0.10 mm. (B) Assessment of cross-sectional area of MC indicates some differences by genotype early in development (E13.5, top) with Fgfr2c C342Y/+ embryos having a relatively greater area overall (box plot, left) and at specific regions in the antero-posterior dimension (line plots, right). (C) Similarly, more cartilage matrix was identified at E13.5 (top) in Fgfr2c C342Y/+ embryos with no differences by genotype being noted later in development [E15.5 (middle), E17.5 (bottom)]. (D) The number of chondrocytes within MC did not vary by genotype at either E13.5 (top) or E15.5 (middle), but fewer chondrocytes were counted in Posterior of Fgfr2c C342Y/+ embryos at E17.5 (bottom). (E) The average diameter of chondrocytes varied little from anterior to posterior aspects of MC and not at all by genotype at E13.5 (top) and E15.5 (middle). Chondrocytes in Anterior of E17.5 Fgfr2c C342Y/+ embryos were smaller than those in Fgfr2c +/+ embryos (bottom two rows). White bar in box plot identifies median. X in box plot identifies mean. n = 3 individuals per genotype per age with at least 4 images per region per embryo being analyzed. **p ≤ 0.01, ***p ≤ 0.001.
FIGURE 6
FIGURE 6
Effect of Fgfr2c C342Y mutation on proliferation in and around MC in E15.5 and E17.5 embryos. (A) Representative coronal sections of MC and surrounding mandible bone (MB) in Fgfr2c +/+ and Fgfr2c C342Y/+ embryos stained with Proliferating Cell Nuclear Antigen (PCNA, brown stain) counterstained with hematoxylin (purple) at E15.5 (top rows) and E17.5 (bottom rows). Scale = 0.1 mm. Note that due to variation in the location of the natural break in MC, only a small remnant of MC remains in Mid 1 at E17.5 in the displayed image of an Fgfr2c +/+ embryo. (B) Quantification of proliferating cells in MC (top 2 rows) and mandible (bottom 2 rows) standardized by the total number of cells within each region. Proliferation was reduced in MC of Fgfr2c C342Y/+ embryos at E15.5 and in mandible of Fgfr2c C342Y/+ embryos at E17.5. White bar in box plot identifies median. X in box plot identifies mean. n = 3 individuals per age per genotype with at least 4 images per region per embryo being analyzed. *p ≤ 0.05. I = incisor; MO = molar.
FIGURE 7
FIGURE 7
Morphological differences in Fgfr2c C342Y/+ and Fgfr2c +/+ mandibular bone at E15.5 and E17.5. Results of EDMA using 3D landmark coordinates of 14 anatomical landmarks at E15.5 (A) and 20 anatomical landmarks at E17.5 (B) show linear distances within each model that are significantly smaller by at least 5% between genotypes. Lateral views (buccal) at left and superior views at right. Thin pink lines indicate linear distances that are decreased by 5%–10% in Fgfr2c C342Y/+ embryos, and thick purple lines indicate linear distances that are reduced by 10%–23% in Fgfr2c C342Y/+ embryos. For orientation, superimpositions of MC and mandibular bone are inset. Scalebar = 1.0 mm.
FIGURE 8
FIGURE 8
Immunohiostochemical analysis of osteoblasts and osteoclasts in developing mandible of Fgfr2c C342Y/+ embryos and Fgfr2c +/+ littermates. (A,C) Representative coronal sections of MC and surrounding mandible in Fgfr2c +/+ (top rows) and Fgfr2c C342Y/+ (bottom rows) embryos stained with alkaline phosphatase (ALP, (A) and Tartrate-Resistant Acid Phosphatase (TRAP, (C) at E15.5 (top) and E17.5 (bottom). Reduced TRAP staining can be noted in Fgfr2c C342Y/+ images especially at Mid 1. (B) Quantification of ALP positive osteoblasts in the developing mandible standardized by the total number of cells within bone matrix. (D) Count of TRAP positive multi-nucleate osteoclasts in the mandible bone matrix. White bar in box plot identifies median. X in box plot identifies mean. n = 3 individuals per age per genotype with at least 4 images per region per embryo being analyzed. * = p ≤ 0.05.
FIGURE 9
FIGURE 9
ERK pathway activation in the lower jaw of Fgfr2c +/+ and Fgfr2c C342Y/+ embryos at E15.5. Immunofluorescence for p-ERK1/2 in coronal sections of Fgfr2c +/+ (top) and Fgfr2c C342Y/+ (bottom) embryos at E15.5. Anterior, Mid 1, Mid 2, and Posterior indicate the regions of the lower jaw identified in Figure 1. Images in MB ROI column show higher magnification of the boxed areas in Mid 2. Arrows mark the locations of the perichondrium of MC. I, incisor; MB, mandible; MC, Meckel’s cartilage; T, tongue. n = 3 per genotype with at least 4 images per individual being analyzed. Scale = 100 µm.

References

    1. Amin S., Tucker A. S. (2006). Joint Formation in the Middle Ear: Lessons from the Mouse and guinea Pig. Dev. Dyn. 235, 1326–1333. 10.1002/dvdy.20666 - DOI - PubMed
    1. Azoury S. C., Reddy S., Shukla V., Deng C.-X. (2017). Fibroblast Growth Factor Receptor 2 (FGFR2) Mutation Related Syndromic Craniosynostosis. Int. J. Biol. Sci. 13, 1479–1488. 10.7150/ijbs.22373 - DOI - PMC - PubMed
    1. Baddoo M., Hill K., Wilkinson R., Gaupp D., Hughes C., Kopen G. C., et al. (2003). Characterization of Mesenchymal Stem Cells Isolated from Murine Bone Marrow by Negative Selection. J. Cel. Biochem. 89, 1235–1249. 10.1002/jcb.10594 - DOI - PubMed
    1. Behringer R., Gertsenstein M., Nagy K., Nagy A. (2013). Manipulating the Mouse Embryo: A Laboratory Manual. Fourth edition (Cold Spring Harbor, New York: Cold Spring Harbor Laboratory Press; ). Revised edition.
    1. Boutros S., Shetye P. R., Ghali S., Carter C. R., McCarthy J. G., Grayson B. H. (2007). Morphology and Growth of the Mandible in Crouzon, Apert, and Pfeiffer Syndromes. J. Craniofac. Surg. 18, 146–150. 10.1097/01.scs.0000248655.53405.a7 - DOI - PubMed