. 2022 May 16:10:858884.
doi: 10.3389/fcell.2022.858884. eCollection 2022.

Covariation of Pluripotency Markers and Biomechanical Properties in Mouse Embryonic Stem Cells

Affiliations

Covariation of Pluripotency Markers and Biomechanical Properties in Mouse Embryonic Stem Cells

Oliver Brookes et al. Front Cell Dev Biol. .

Abstract

Pluripotent cells are subject to much interest as a source of differentiated cellular material for research models, regenerative medical therapies and novel applications such as lab-cultured meat. Greater understanding of the pluripotent state and control over its differentiation is therefore desirable. The role of biomechanical properties in directing cell fate and cell behavior has been increasingly well described in recent years. However, many of the mechanisms which control cell morphology and mechanical properties in somatic cells are absent from pluripotent cells. We leveraged naturally occurring variation in biomechanical properties and expression of pluripotency genes in murine ESCs to investigate the relationship between these parameters. We observed considerable variation in a Rex1-GFP expression reporter line and found that this variation showed no apparent correlation to cell spreading morphology as determined by circularity, Feret ratio, phase contrast brightness or cell spread area, either on a parameter-by-parameter basis, or when evaluated using a combined metric derived by principal component analysis from the four individual criteria. We further confirmed that cell volume does not co-vary with Rex1-GFP expression. Interestingly, we did find that a subpopulation of cells that were readily detached by gentle agitation collectively exhibited higher expression of Nanog, and reduced LmnA expression, suggesting that elevated pluripotency gene expression may correlate with reduced adhesion to the substrate. Furthermore, atomic force microscopy and quantitative fluorescent imaging revealed a connection between cell stiffness and Rex1-GFP reporter expression. Cells expressing high levels of Rex1-GFP are consistently of a relatively low stiffness, while cells with low levels of Rex1-GFP tend toward higher stiffness values. These observations indicate some interaction between pluripotency gene expression and biomechanical properties, but also support a strong role for other interactions between the cell culture regime and cellular biomechanical properties, occurring independently of the core transcriptional network that supports pluripotency.

Keywords: cell adhesion; cell morphology; cell stiffness; mouse embryonic stem cells; pluripotency marker.


Conflict of interest statement

The authors declare that the research was conducted in the absence of any commercial or financial relationships that could be construed as a potential conflict of interest.

Figures

FIGURE 1
FIGURE 1
Morphological heterogeneity in ESC colonies maintained with LIF and FBS. Phase contrast images were collected during routine culture of E14TG2a ESCs in both LIF/FBS medium (A,B) and 2i/KSR medium (C). In the LIF medium, some colonies can be seen to adopt a compact morphology (A), while other colonies adopt a flattened, pseudo-epithelial morphology (B). In 2i/KSR, cells grow as compact, almost spherical colonies (C).
FIGURE 2
FIGURE 2
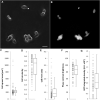
Heterogeneous abundance of Rex1, Oct4, and Nanog in ESCs. Quantification of 3-colour fluorescence from individual Rex1-GFPd2 cells immunostained for Nanog and Oct4. Individual value plots of Rex1-GFP intensity (A), Nanog staining intensity (B) and Oct3/4 staining intensity (C) all reveal considerable variance across the population. It is not possible in these data to see differences between cells cultured in 2i (n = 80) or LIF (n = 85). Boxes represent median and interquartile range, with whiskers extending to 1.5× interquartile range or the max/min data points. Representative images (D–G) are included to relate brightness of objects to the arbitrary units used in this figure. When plotted against each other (H–J) weak correlations are visible. These correlations are quantified in Table 3. Scale bar for D–G: 5 µm.
FIGURE 3
FIGURE 3
Morphological characterization of Rex1-GFP mESCs growing in LIF/FBS medium on gelatin. Rex1-GFP cells were seeded on gelatin-coated imaging dishes, cultured for 6 h and imaged. As can be seen in the phase contrast image (A), a range of morphologies were observed in this population. Specific parameters of single cells are quantified in (C–F). As expected, the Rex1-GFP reporter is expressed heterogeneously (B), arrowheads indicate Rex1-GFP negative cell. Rex1-GFP is quantified in (G). Scale bar: 25 µm. Boxes represent median and interquartile range, with whiskers extending to 1.5× interquartile range or the max/min data points. n = 84.
FIGURE 4
FIGURE 4
Effect of Rex1-GFP expression on morphological index (PC1). Rex1-GFPd2 cells were cultured in LIF/FBS medium for 6 h and imaged live. Morphological traits were measured from phase contrast images and reduced by principal components analysis to a single metric, PC1, compared here to GFP fluorescence integrated density from the same cells. There is no correlation between PC1 and the intensity of GFP expression from the Rex1 promoter (A, R = −0.069). This is also reflected in the individual value plot of sub-median (−) vs. super-median (+) GFP integrated density against PC1 (B). There is no apparent difference in the distribution of the two groups, which implies that there is no relationship between Rex1 expression and cell morphology. Median GFP I.D. = 1.50023 A.U., GFP+ and GFP- denote cells above or below median, respectively. Boxes represent median and interquartile range, with whiskers extending to 1.5× interquartile range or the max/min data points. n = 84.
FIGURE 5
FIGURE 5
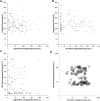
Effect of Rex1 expression and SSEA1 abundance on cell volume. Live Rex1-GFPd2 cells cultured in LIF/FBS were enzymatically dissociated, labelled with an anti-SSEA1 antibody and imaged in suspension in phase contrast and fluorescent modes. Cells in suspension are assumed to adopt a spherical shape, so cell volume can be estimated from projected area. Projected area of detached Rex1GFP cells weakly correlates to SSEA1 abundance [(A), R = 0.261, p = 0.034], and Rex1-dependent GFP fluorescence [(B), R = −0.306, p = 0.002]. Surprisingly, there is no apparent correlation between SSEA1 abundance and Rex1-dependent GFP expression [(C), R = −0.167, p = 0.102]. There is no covariance in terms of the effect of these pluripotency markers on cell volume [(D), circle areas correspond to projected cell areas]. n = 97, Pearson correlation test.
FIGURE 6
FIGURE 6
Relationship between adhesion of cells and expression of pluripotency markers. Rex1-GFPd2 cells, cultured in LIF/FBS medium, were subjected to fluid shear 24 h after cell seeding, causing a proportion of the cells to become mechanically detached from the substrate. RNA was extracted separately from detached cells and the remaining adherent cells. Quantitative PCR reveals no difference in expression of Rex1 or Oct4 (A,B), but the readily detached cells have higher expression of Nanog (C), and reduced expression of lamin A (D). Fold expression is calculated relative to the adherent cell condition. Mean ± s.e.m. with individual values overlaid. n = 3, Two-sample t-test on ∆∆Ct values, *p < 0.05.
FIGURE 7
FIGURE 7
Relationship between Stiffness and Rex1-GFP expression in individual cells. Live Rex1-GFPd2 cells cultured in LIF/FBS were seeded into glass-bottomed imaging dishes and subjected to AFM force spectroscopy combined with fluorescence microscopy, so that GFP integrated density (A–D) and stiffness (E–H) could be determined on a cell-by-cell basis. Figures (E–H) are high resolution maps, while cell stiffness values presented in (I–J) are the median of multiple point measurements within individual cells (5 measurements each, n = 15 cells, Gavara and Chadwick 2015). (I) Stiffness plotted against GFP integrated density (I.D.) revealed all cells stiffer than median (137 Pa) have low GFP intensity, while cells above median brightness (∼8.9 × 10³ A.U.) are also soft (I, grouped data in J). Inset: Stiffness is negatively associated with GFP expression. n = 15, Linear regression with log transformed GFP integrated density, p = 0.008. Consistent with prior results, morphology does not seem to be connected to Rex1-GFP expression (K). Boxes represent median and interquartile range, with whiskers extending to 1.5× interquartile range or the max/min data points. n = 7–8, Mann-Whitney test, n.s. p = 0.862, *p = 0.013.

Similar articles

References

    1. Becker K. A., Ghule P. N., Therrien J. A., Lian J. B., Stein J. L., van Wijnen A. J., et al. (2006). Self-Renewal of Human Embryonic Stem Cells Is Supported by a Shortened G1 Cell Cycle Phase. J. Cell. Physiol. 209, 883–893. 10.1002/jcp.20776 - DOI - PubMed
    1. Blair K., Wray J., Smith A. (2011). The Liberation of Embryonic Stem Cells. PLoS Genet. 7, e1002019. 10.1371/journal.pgen.1002019 - DOI - PMC - PubMed
    1. Blancas A. A., Chen C.-S., Stolberg S., McCloskey K. E. (2011). Adhesive Forces in Embryonic Stem Cell Cultures. Cell Adhes. Migr. 5, 472–479. 10.4161/cam.5.6.18270 - DOI - PMC - PubMed
    1. Boraas L. C., Guidry J. B., Pineda E. T., Ahsan T. (2016). Cytoskeletal Expression and Remodeling in Pluripotent Stem Cells. PLoS One 11, e0145084–16. 10.1371/journal.pone.0145084 - DOI - PMC - PubMed
    1. Chalut K. J., Höpfler M., Lautenschläger F., Boyde L., Chan C. J., Ekpenyong A., et al. (2012). Chromatin Decondensation and Nuclear Softening Accompany Nanog Downregulation in Embryonic Stem Cells. Biophys. J. 103, 2060–2070. 10.1016/j.bpj.2012.10.015 - DOI - PMC - PubMed