Review
. 2022 Apr 4;4(2):fcac088.
doi: 10.1093/braincomms/fcac088. eCollection 2022.

Quantitative magnetization transfer imaging in relapsing-remitting multiple sclerosis: a systematic review and meta-analysis

Affiliations
Review

Quantitative magnetization transfer imaging in relapsing-remitting multiple sclerosis: a systematic review and meta-analysis

Elizabeth N York et al. Brain Commun. .

Abstract

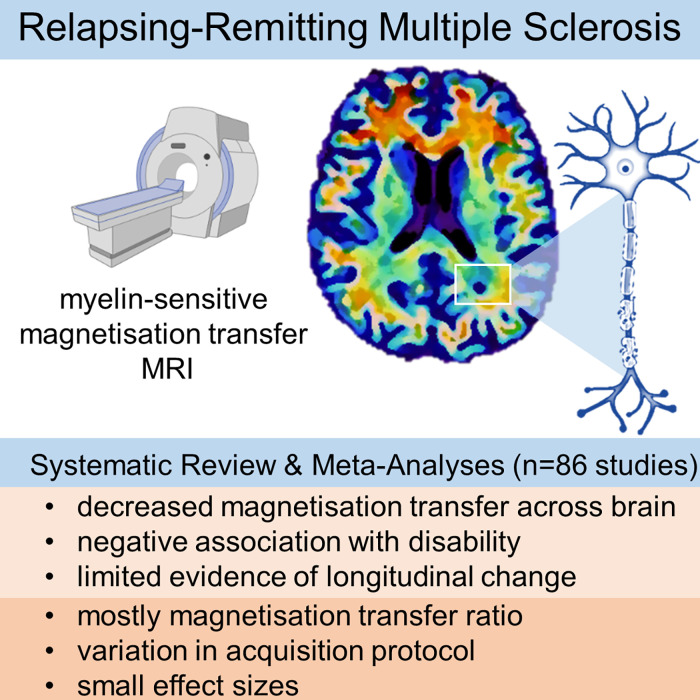
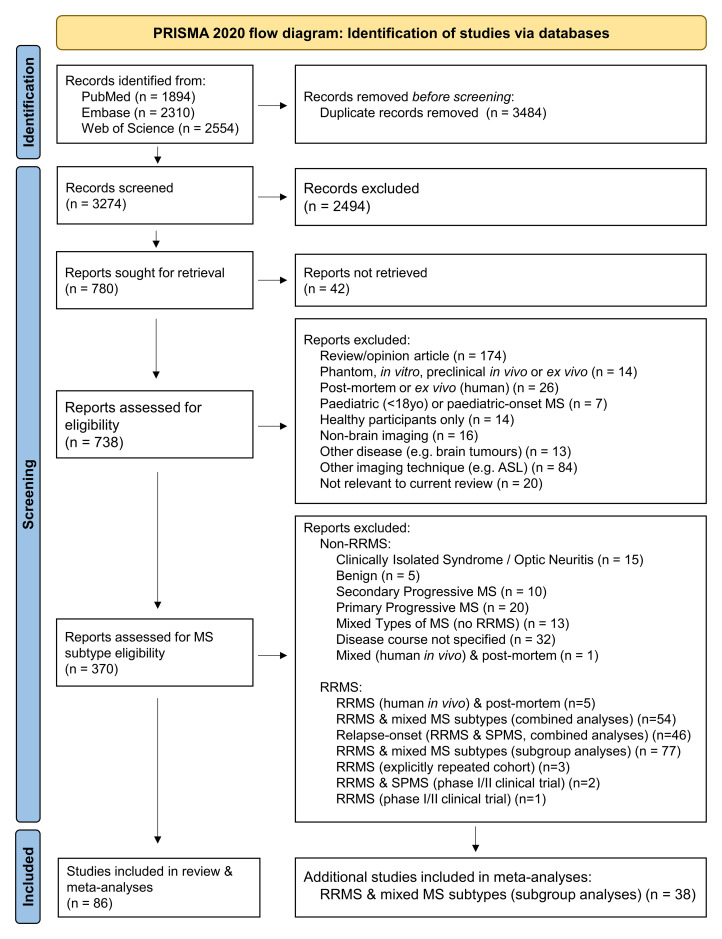
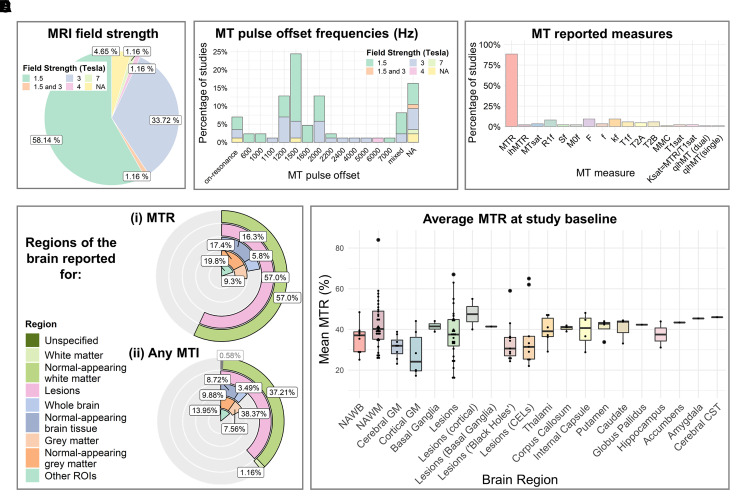
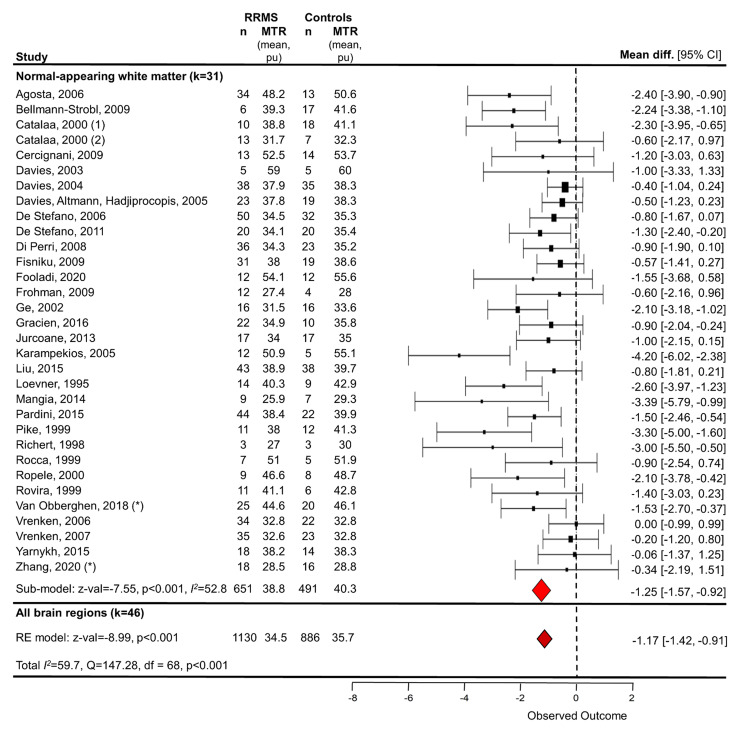
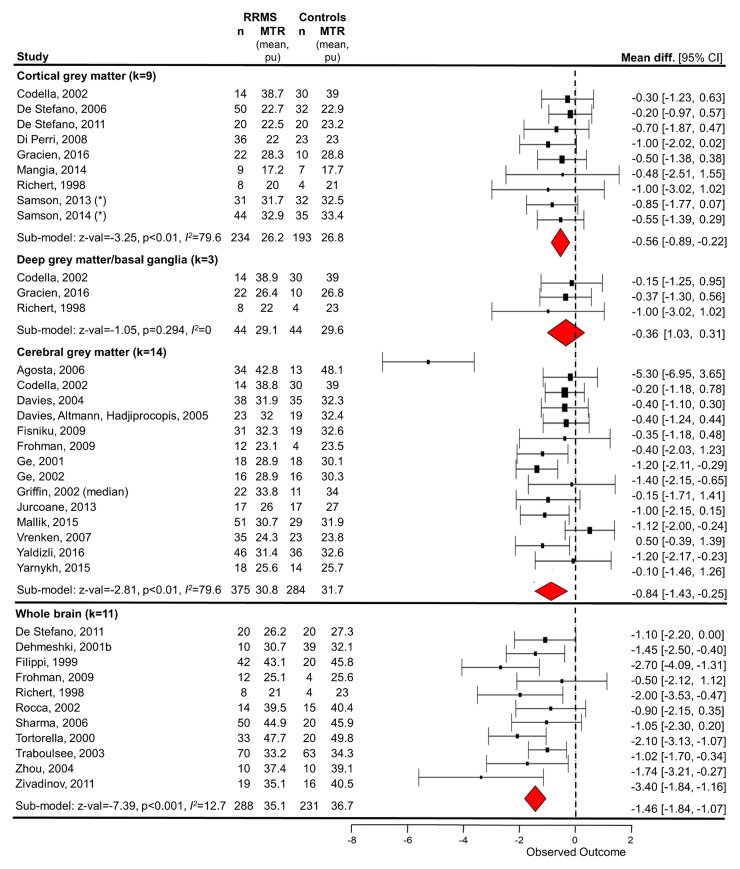
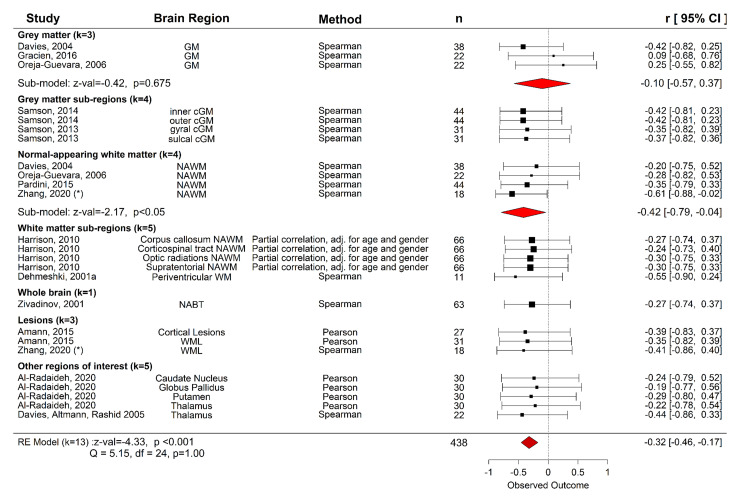
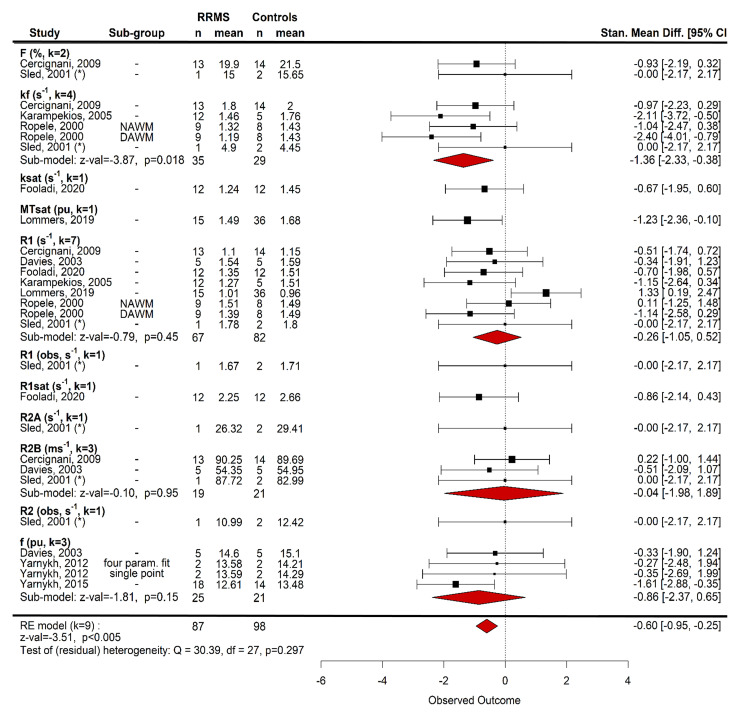
Myelin-sensitive MRI such as magnetization transfer imaging has been widely used in multiple sclerosis. The influence of methodology and differences in disease subtype on imaging findings is, however, not well established. Here, we systematically review magnetization transfer brain imaging findings in relapsing-remitting multiple sclerosis. We examine how methodological differences, disease effects and their interaction influence magnetization transfer imaging measures. Articles published before 06/01/2021 were retrieved from online databases (PubMed, EMBASE and Web of Science) with search terms including 'magnetization transfer' and 'brain' for systematic review, according to a pre-defined protocol. Only studies that used human in vivo quantitative magnetization transfer imaging in adults with relapsing-remitting multiple sclerosis (with or without healthy controls) were included. Additional data from relapsing-remitting multiple sclerosis subjects acquired in other studies comprising mixed disease subtypes were included in meta-analyses. Data including sample size, MRI acquisition protocol parameters, treatments and clinical findings were extracted and qualitatively synthesized. Where possible, effect sizes were calculated for meta-analyses to determine magnetization transfer (i) differences between patients and healthy controls; (ii) longitudinal change and (iii) relationships with clinical disability in relapsing-remitting multiple sclerosis. Eighty-six studies met inclusion criteria. MRI acquisition parameters varied widely, and were also underreported. The majority of studies examined the magnetization transfer ratio in white matter, but magnetization transfer metrics, brain regions examined and results were heterogeneous. The analysis demonstrated a risk of bias due to selective reporting and small sample sizes. The pooled random-effects meta-analysis across all brain compartments revealed magnetization transfer ratio was 1.17 per cent units (95% CI -1.42 to -0.91) lower in relapsing-remitting multiple sclerosis than healthy controls (z-value: -8.99, P < 0.001, 46 studies). Linear mixed-model analysis did not show a significant longitudinal change in magnetization transfer ratio across all brain regions [β = 0.12 (-0.56 to 0.80), t-value = 0.35, P = 0.724, 14 studies] or normal-appearing white matter alone [β = 0.037 (-0.14 to 0.22), t-value = 0.41, P = 0.68, eight studies]. There was a significant negative association between the magnetization transfer ratio and clinical disability, as assessed by the Expanded Disability Status Scale [r = -0.32 (95% CI -0.46 to -0.17); z-value = -4.33, P < 0.001, 13 studies]. Evidence suggests that magnetization transfer imaging metrics are sensitive to pathological brain changes in relapsing-remitting multiple sclerosis, although effect sizes were small in comparison to inter-study variability. Recommendations include: better harmonized magnetization transfer acquisition protocols with detailed methodological reporting standards; larger, well-phenotyped cohorts, including healthy controls; and, further exploration of techniques such as magnetization transfer saturation or inhomogeneous magnetization transfer ratio.

Keywords: brain; magnetization transfer; multiple sclerosis; relapsing-remitting; systematic review.


Figures

Graphical Abstract
Graphical Abstract
Figure 1
Figure 1
PRISMA 2020 flow diagram for systematic review search process. ASL, arterial spin labelling; MS, multiple sclerosis; PRISMA, Preferred Reporting Items for Systematic Reviews and Meta-Analyses; RRMS, relapsing-remitting MS; SPMS, secondary progressive MS. Adapted from: Page et al.
Figure 2
Figure 2
MRI characteristics of studies which used MTI in relapsing-remitting MS (k = 86). Plots summarise A field strength of the MR system, B pulse offset frequencies of the MT pulse, C MT metrics used across studies, D brain regions in which (i) MTR or (ii) any MTI metric was reported, and E the average MTR across brain regions at study baseline. CELs, contrast-enhancing lesions; CST, corticospinal tract; GM, grey matter; MMC, macromolecular content; MT, magnetization transfer; MTR, MT ratio; ihMTR, inhomogeneous MTR; MTsat, MT saturation; qihMT, quantitative inhomogeneous MT; NAWB, normal-appearing whole brain; NAWM, normal-appearing white matter; ROIs, regions of interest.
Figure 3
Figure 3
Random-effects meta-analysis of the difference in mean MTR in between relapsing-remitting MS patients and control subjects in NAWM and all brain tissue types. Study baseline data were used. One study (Catalaa) was included twice as separate protocols and cohorts were used. A random-effects model with brain region as a nested factor showed that mean MTR was 1.17 per cent units [z-value = −8.99, P < 0.001, 46 studies (including grey matter and whole brain studies in Fig. 4), 1130 RRMS/886 HC] lower for people with RRMS than HCs across all brain tissue types. A random-effects model for NAWM alone showed that mean MTR was 1.25 per cent units (z-value = −7.55, P < 0.001, 31 studies/n = 32; 651 RRMS/491 HC) lower for people with RRMS than HCs. NAWM, normal-appearing white matter; RE, random-effects; RRMS, relapsing-remitting multiple sclerosis. *Averaged over sub-regions.
Figure 4
Figure 4
Random-effects meta-analysis of the difference in mean MTR between relapsing-remitting MS patients and control subjects in grey matter and whole brain. Random-effects models of study baseline data showed that mean MTR was lower for people with RRMS than HCs in whole brain (mean difference −1.46, z = −7.39, P < 0.001 uncorrected, 11 studies, 288 RRMS/231 HC), cortical grey matter (−0.56, z-value = −3.25, P = 0.001, nine studies, 234 RRMS/193 HC), and cerebral grey matter (−0.84, z-value = −2.81, P= 0.005, 14 studies, 375 RRMS/284 HC), but not deep grey matter/basal ganglia (−0.36, z-value = −1.05, P = 0.294, three studies, 44 RRMS/44 HC). See Fig. 3 for estimate across all brain tissue types, including NAWM. GM, grey matter; NAWM, normal-appearing white matter; RE, random-effects; RRMS, relapsing-remitting multiple sclerosis; WB, whole brain. *Averaged over sub-regions.
Figure 5
Figure 5
Meta-analysis of association between MTR and clinical disability in relapsing-remitting MS. Clinical disability was defined as EDSS score. A multi-level random-effects model with brain region as a nested factor within each study showed a significant negative association (r = −0.32, z-value = −4.33, P < 0.001, 13 studies, 438 RRMS) between MTR and EDSS across all brain regions. Studies which did not report a correlation coefficient were not included. Random-effects sub-analyses showed a significant correlation between EDSS and NAWM MTR (r = −0.42, z-value = −2.17, P = 0.030, four studies, 122 RRMS), and not grey matter (r = −0.10, z-value = −0.42, P = 0.675, three studies, 82 RRMS). Sub-analyses were not performed when the number of studies, k < 3. *MTR values were averaged over sub-regions of NAWM. GM, grey matter; NABT, normal-appearing brain tissue; NAWM, normal-appearing white matter; WML, white matter lesions; RE, random effects; CI, confidence interval.
Figure 6
Figure 6
Random-effects meta-analysis of magnetization transfer compartmental model parameters in WM. Metric was a nested factor within study and subgroup (e.g. DAWM versus NAWM) was nested within metric. T1 and T2 were converted to R1 and R2, respectively, for comparability. For people with RRMS, compartmental model metrics were significantly lower than HCs (standardized mean difference −0.60, z-value = −3.51, P = 0.002, nine studies, 87 RRMS/98 HC). Random-effects models for individuals metrics were not significant after correction for multiple comparisons, despite a trend for the forward exchange rate, kf (standardized mean difference −1.36, z-value = −3.87, P = 0.018, four studies). R1 (−0.26, z-value = −0.79, P = 0.45, seven studies), R2B (−0.04, z-value = −0.10, P = 0.95, three studies) and f (−0.86, z-value = 1.81, P = 0.15, three studies) did not differ between patients and HCs. DAWM, dirty-appearing white matter; NAWM, normal-appearing white matter; Stand Mean Diff, standardized mean difference. (*) frontal white matter; α = 0.05 for omnibus test and α = 0.05/4 = 0.0125 for subgroups.

References

    1. National Multiple Sclerosis Society . Accessed 21 June 2019. https://www.nationalmssociety.org/What-is-MS/Definition-of-MS.
    1. Harris VK, Tuddenham JF, Sadiq SA. Biomarkers of multiple sclerosis: Current findings. Degener Neurol Neuromuscul Dis. 2017;7:19–29. - PMC - PubMed
    1. Barkhof F. MRI in multiple sclerosis: Correlation with expanded disability status scale (EDSS). Mult Scler. 1999;5(4):283–286. - PubMed
    1. Li DK, Held U, Petkau J, et al. . MRI T2 lesion burden in multiple sclerosis: A plateauing relationship with clinical disability. Neurology. 2006;66(9):1384–1389. - PubMed
    1. Agosta F, Rovaris M, Pagani E, Sormani MP, Comi G, Filippi M. Magnetization transfer MRI metrics predict the accumulation of disability 8 years later in patients with multiple sclerosis. Brain. 2006;129(Pt 10):2620–2627. - PubMed

LinkOut - more resources