. 2022 Aug;9(22):e2104823.
doi: 10.1002/advs.202104823. Epub 2022 Jun 2.

A Temporal PROTAC Cocktail-Mediated Sequential Degradation of AURKA Abrogates Acute Myeloid Leukemia Stem Cells

Affiliations

A Temporal PROTAC Cocktail-Mediated Sequential Degradation of AURKA Abrogates Acute Myeloid Leukemia Stem Cells

Fang Liu et al. Adv Sci (Weinh). 2022 Aug.

Abstract

AURKA is a potential kinase target in various malignancies. The kinase-independent oncogenic functions partially disclose the inadequate efficacy of the kinase inhibitor in a Phase III clinical trial. Simultaneously targeting the catalytic and noncatalytic functions of AURKA may be a feasible approach. Here, a set of AURKA proteolysis targeting chimeras (PROTACs) are developed. The CRBN-based dAurA383 preferentially degrades the highly abundant mitotic AURKA, while cIAP-based dAurA450 degrades the lowly abundant interphase AURKA in acute myeloid leukemia (AML) cells. The proteomic and transcriptomic analyses indicate that dAurA383 triggers the "mitotic cell cycle" and "stem cell" processes, while dAurA450 inhibits the "MYC/E2F targets" and "stem cell" processes. dAurA383 and dAurA450 are combined as a PROTAC cocktail. The cocktail effectively degrades AURKA, relieves the hook effect, and synergistically inhibits AML stem cells. Furthermore, the PROTAC cocktail induces AML regression in a xenograft mouse model and primary patient blasts. These findings establish the PROTAC cocktail as a promising spatial-temporal drug administration strategy to sequentially eliminate the multifaceted functions of oncoproteins, relieve the hook effect, and prevent cancer stem cell-mediated drug resistance.

Keywords: Aurora kinase A (AURKA); E3 ubiquitin ligase; PROTAC cocktail; acute myeloid leukemia stem cells.


Conflict of interest statement

The authors declare no conflict of interest.

Figures

Figure 1
Figure 1
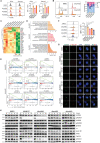
Design and characterization of different E3 ubiquitin ligase‐based AURKA PROTACs. A) Crystal structure of AURKA in complex with MLN8054 (PDB code 2×81). The lysine residues on the surface of AURKA are highlighted. B) Chemical structures of AURKA PROTAC based on MLN8237 and the ligands of CRBN, VHL, and cIAP. MW, molecular weight (Daltons). C) SPR sensorgrams and KD values of MLN8237 and AURKA PROTACs binding to the AURKA protein. D) Dual‐colored fluorescence SPPIER (DF‐SPPIER) imaging of ternary complex formation in HEK293T cells with PROTACs and E3 ligands induction (500 × 10−9 m) for 3 h. Fluorescence histogram of the line across the cells (normalized fluo., normalized fluorescence intensity) and the log10 normalized sum of pixel fluorescence intensity (normalized SPPIER, log10 (intensity + 1)) of yellow droplets in each cell are shown on the right. Scale bar: 5 µm. E) Degradation of endogenous AURKA in KG1A cells following 6 h treatment with the indicated concentration of PROTACs. F) Degradation of endogenous AURKA in KG1A cells following 6 h treatment with the indicated PROTACs (500 × 10−9 m) and E3 ligase ligands. G) Degradation of endogenous AURKA in KG1A cells with or without doxycycline (DOX, 0.5 µg mL−1) treatment for 72 h following 6 h treatment with the indicated PROTACs (500 × 10−9 m). H) TMT‐based quantitative proteomics after treatment with dAurA383 (500 × 10−9 m), dAurA450 (500 × 10−9 m) or the DMSO Vehicle for 6 h in KG1A cells. The differentially expressed proteins are presented in the volcano plot. I. KG1A cells were synchronized at the G1/S boundary by a double thymidine method, released into fresh media, and harvested at the indicated times (T/T release). The cell cycle profile was assayed by FACS with propidium iodide (PI) staining. Ctrl, proliferating KG1A cells under normal cell culture condition were used as control. J) The protein expression levels of the indicated proteins after T/T release were measured by Western blot. K) Schematic depiction of the relative protein levels of AURKA, CRBN, cIAP1, and VHL in KG1A cells. Statistics, significance: one‐way ANOVA with Bonferroni correction (D); ns, not significant; ***P < 0.001.
Figure 2
Figure 2
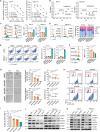
AURKA PROTACs inhibit cell growth and induce apoptosis of AML cells in vitro. A) Dose–response curves of KG1A or Kasumi‐1 treated with AURKA PROTACs. Cells were treated with various concentrations of AURKA PROTACs for 72 h and were stained with CCK8. For IC50 in KG1A cells, dAurA383 = 3.04 ± 0.28 × 10−6 m, dAurA425 = 9.23 ± 2.00 × 10−6 m, dAurA450 = 3.41 ± 0.28 × 10−6 m. For IC50 in Kasumi‐1 cells, dAurA383 = 1.17 ± 0.08 × 10−6 m, dAurA425 = 3.75 ± 0.32 × 10−6 m, dAurA450 = 3.19 ± 0.35 × 10−6 m. B) Cell proliferation of KG1A or Kasumi‐1 treated with AURKA PROTACs. Cells were treated with AURKA PROTACs (1 × 10−6 m) and were stained with CCK8. C,D) Cell apoptosis of KG1A cells treated with AURKA PROTACs (1 × 10−6 m) for 48 h. E,F) Methylcellulose‐based colony forming cell (CFC) assays show the effects of AURKA PROTACs (1 × 10−6 m) on KG1A cells for 14 days. Sphere number (diameter > 50 µm, left panel) and size (diameter, right panel) were calculated. Scale bar: 50 µm. Statistics, significance: one‐way ANOVA with Bonferroni correction (B,D,F); ns, not significant; *P < 0.05; **P < 0.01; ***P < 0.001.
Figure 3
Figure 3
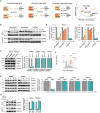
Characterization of cellular response to PROTACs in AML cells. A) KG1A and Kasumi‐1 cells were stained with a carboxyfluorescein succinimidyl amino ester (CFSE) probe and cultured with AURKA PROTACs (1 × 10−6 m) for 72 h. CFSE fluorescence was analyzed by flow cytometry. MFI, mean fluorescence intensity. B) KG1A cells were treated with AURKA PROTACs (1 × 10−6 m) for 48 h. The cell cycle profile was assayed by FACS with propidium iodide (PI) staining. The cell cycle phase distribution was analyzed by FlowJo software. C) A heatmap of the relative normalized abundance of proteins in TMT‐based quantitative proteomic assays. D) TMT‐based quantitative proteomics after treatment with PROTACs (500 × 10−9 m) or the DMSO Vehicle for 6 h in KG1A cells. The top 100 decreased proteins were subjected to g:Profiler to perform gene ontology (GO) analysis. E) Gene set enrichment analysis (GSEA) of RNA‐seq data from KG1A cells treated with AURKA PROTACs (1 × 10−6 m) for 48 h. F) KG1A cells were treated with AURKA PROTACs (1 × 10−6 m) or ATRA (0.6 × 10−6 m) for 48 h. Cell surface CD34 expression was analyzed by FACS. MFI, mean fluorescence intensity. G) KG1A cells were arrested with nocodazole (0.1 µg mL−1) for 16 h followed by PROTACs or MLN8237 treatment with indicated concentration for 6 h. AURKA localization were detected by immunofluorescence. Scale bar: 5 µm. H) KG1A cells were arrested with nocodazole (0.1 µg mL−1) for 16 h followed by DMSO, PROTACs (1 × 10−6 m) or MLN8237 (50 × 10−9 m) treatment for indicated times. The expression of AURKA and related proteins were detected. Statistics, significance: one‐way ANOVA with Bonferroni correction (A,F); ns, not significant; *P < 0.05; **P < 0.01; ***P < 0.001.
Figure 4
Figure 4
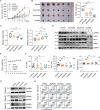
dAurA383 and dAurA450 synergistically inhibit the growth and stemness of AML cells. A,B) KG1A and Kasumi‐1 cells were treated with various concentrations of dAurA383, dAurA450 alone or in combination for 72 h. The growth inhibitory effects were determined by CCK8 staining. The CI value was calculated with CompuSyn software. C) KG1A and Kasumi‐1 cells were stained with carboxyfluorescein succinimidyl amino ester (CFSE) probe and cultured with PROTACs (500 × 10−9 m) for 72 h. CFSE fluorescence was analyzed by flow cytometry. MFI, mean fluorescence intensity. D) KG1A and Kasumi‐1 cells were treated with AURKA PROTACs (500 × 10−9 m) for 48 h. The cell cycle profile was assayed by FACS with propidium iodide (PI) staining. The cell cycle phase distribution was analyzed by FlowJo software. E) The apoptosis of KG1A and Kasumi‐1 cells treated with the indicated PROTACs (500 × 10−9 m) for 48 h. The rate of Annexin V positive cells was calculated. F) KG1A cells were treated with AURKA PROTACs (500 × 10−9 m) for 48 h. Cell surface CD34 expression was analyzed by FACS. MFI, mean fluorescence intensity. G) Methylcellulose‐based colony forming cell (CFC) assays to examine the stemness of KG1A cells treated with PROTACs (500 × 10−9 m) for 14 days. Sphere number (diameter > 50 µm, left panel) and size (diameter, right panel) were calculated. Scale bar: 50 µm. H,I) KG1A cells were treated with AURKA PROTACs (500 × 10−9 m) for 48 h. ALDH positive cells were analyzed by flow cytometry assays. J&K. KG1A and Kasumi‐1 cells were treated with AURKA PROTACs (1 × 10−6 m) and MLN8237 (50 × 10−9 m) for 48 h. Western blot analysis of AURKA as well as stemness markers c‐Myc, NANOG, STAT5A, and FOXM1. Statistics, significance: one‐way ANOVA with Bonferroni correction (A,C,E,F,G,I); ns, not significant; *P < 0.05; **P < 0.01; ***P < 0.001.
Figure 5
Figure 5
An AURKA PROTAC cocktail relieves the hook effect. A) Scheme depicting the strategy to combine dAurA383 and dAurA450 to relieve the hook effect. B) Degradation of endogenous AURKA in KG1A and Kasumi‐1 cells following 12 h treatment with the indicated concentration of PROTACs. C) Relative AURKA protein levels in panel B were quantified using the ImageJ software. D) KG1A and Kasumi‐1 cells were treated with PROTAC cocktail (4 × 10−6 m) for 12 h. The expression of AURKA and related proteins were detected. E) KG1A cells were arrested with nocodazole (0.1 µg mL−1) for 16 h followed by PROTAC cocktail (4 × 10−6 m) treatment for indicated times. The expression of AURKA and related proteins were detected. F) TMT‐based quantitative proteomics after treatment with dAurA383 and dAurA450 cocktail (1 × 10−6 m) or the DMSO Vehicle for 6 h in KG1A cells. The differentially expressed proteins are presented in the volcano plot. G) Degradation of endogenous AURKA in KG1A and Kasumi‐1 cells following 12 h treatment with PROTAC cocktail (4 × 10−6 m), NEDD8‐activating enzyme inhibitor MLN4924 (1 × 10−6 m) or proteasomal inhibitor Bortezomib (25 × 10−9 m).
Figure 6
Figure 6
AURKA PROTAC cocktail induces AML regression in a xenograft mouse model and primary blasts. A) Nude mice bearing KG1A xenografts were intraperitoneally injected with dAurA383, dAurA450, and cocktail (30 µmol kg−1 day−1). The tumor volume from 1 to 14 days is plotted versus time. B) Left panel, tumors resected from the mice in each group are shown. Right panel: statistical analysis of the tumor weight. C) The surface CD34 and CD11b of dissected tumors were analyzed by FACS assays. D) The indicated proteins of dissected tumors were detected by Western blot. E) The body weight of the mice were measured and plotted against time. F) Plasma ALT, AST, and BUN of the mice were measured. The dotted lines display the normal reference values of BALB/c nude mice in Charles River Laboratories. G) AURKA expression was detected by Western blot in AML primary blasts treated with AURKA PROTACs (1 × 10−6 m) for 6 h. H) Cell apoptosis was analyzed in AML primary blasts treated with AURKA PROTACs (1 × 10−6 m) for 48 h. Statistics, significance: one‐way ANOVA with Bonferroni correction (A,B,C,F); ns, not significant; *P < 0.05; **P < 0.01; ***P < 0.001.
Figure 7
Figure 7
Graphic depiction of the working model of AURKA PROTAC cocktail. AURKA kinase inhibitor or the mitotic AURKA PROTAC preferentially inhibits or degrades mitotic kinase‐dependent AURKA and kills the proliferative AML cells, while the interphase AURKA PROTAC preferentially degrades the interphase kinase‐independent AURKA and attenuates cancer stemness. The PROTAC cocktail eliminates both the proliferative AML cells and AML stem cells.

References

    1. Marumoto T., Zhang D., Saya H., Nat. Rev. Cancer 2005, 5, 42. - PubMed
    1. Liu Q., Ruderman J. V., Proc. Natl. Acad. Sci. USA 2006, 103, 5811. - PMC - PubMed
    1. Huang X.‐F., Luo S.‐K., Xu J., Li J., Xu D.‐R., Wang Li.‐H, Yan M., Wang X.‐R., Wan X.‐B., Zheng F.‐M., Zeng Y.‐X., Liu Q., Blood 2008, 111, 2854. - PubMed
    1. Tanaka T., Kimura M., Matsunaga K., Fukada D., Mori H., Okano Y., Cancer Res. 1999, 59, 2041. - PubMed
    1. Ewart‐Toland A., Dai Qi, Gao Y.‐T, Nagase H., Dunlop M. G., Farrington S. M., Barnetson R. A., Anton‐Culver H., Peel D., Ziogas A., Lin D., Miao X., Sun T., Ostrander E. A., Stanford J. L., Langlois M., Chan J. M., Yuan J., Harris C. C., Bowman E. D., Clayman G. L., Lippman S. M., Lee J. J., Zheng W., Balmain A., Carcinogenesis 2005, 26, 1368. - PubMed

Publication types