. 2022 Sep;112(3):615-626.
doi: 10.1002/cpt.2672. Epub 2022 Jun 28.

Coproporphyrin I as an Endogenous Biomarker to Detect Reduced OATP1B Activity and Shift in Elimination Route in Chronic Kidney Disease

Affiliations

Coproporphyrin I as an Endogenous Biomarker to Detect Reduced OATP1B Activity and Shift in Elimination Route in Chronic Kidney Disease

Hiroyuki Takita et al. Clin Pharmacol Ther. 2022 Sep.

Abstract

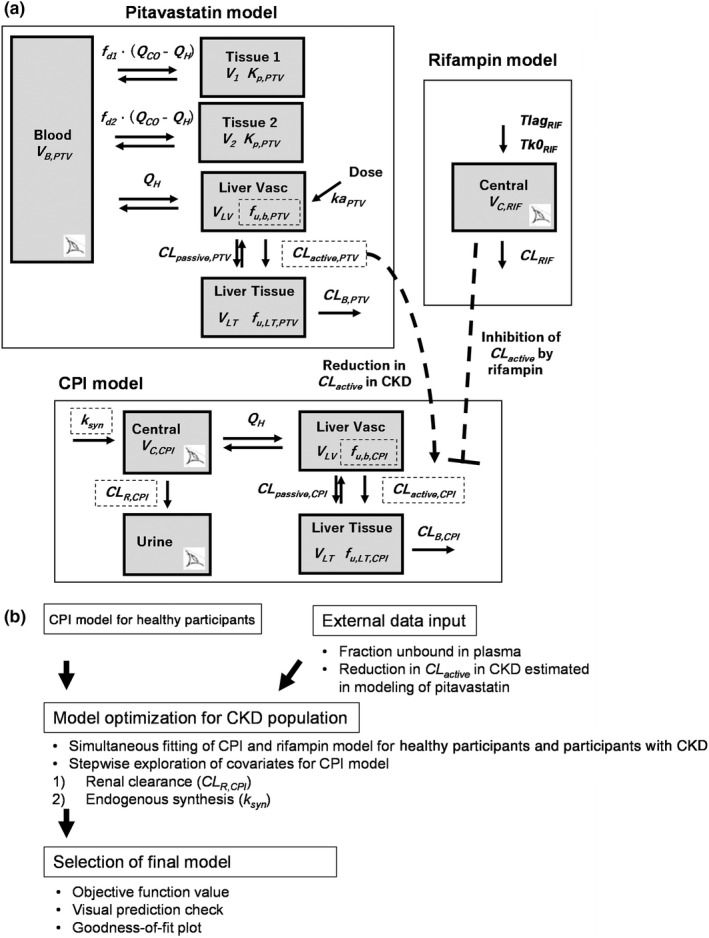
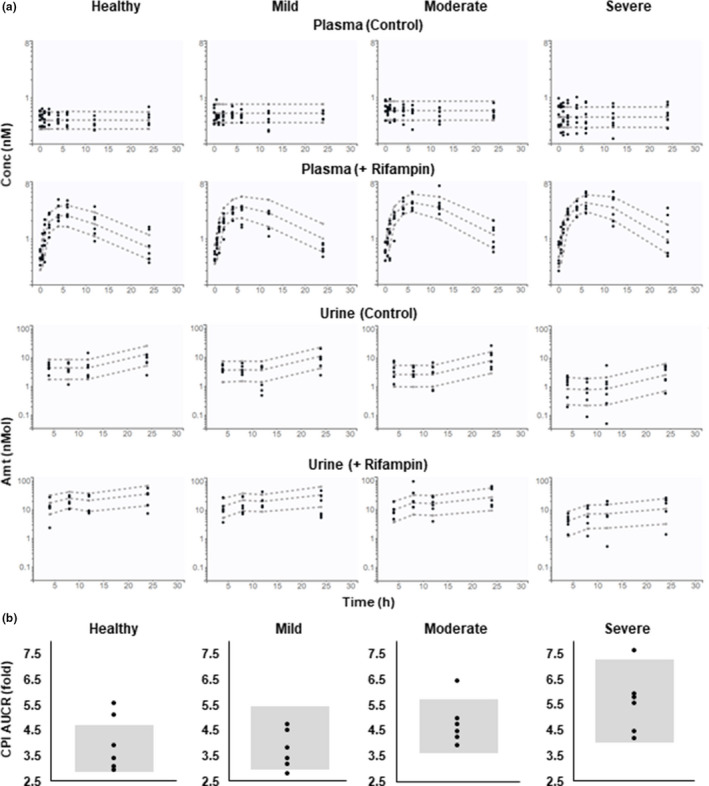
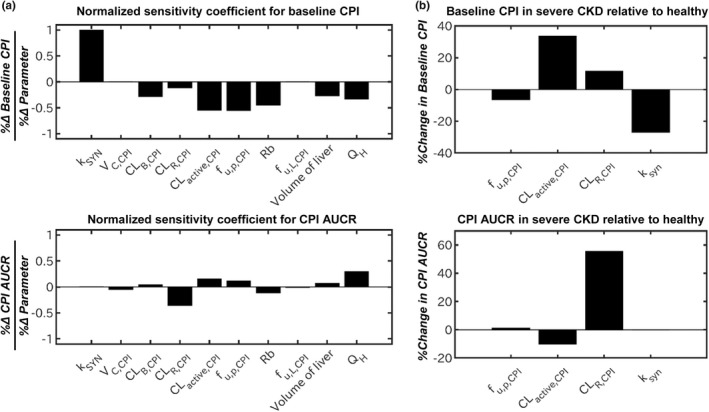
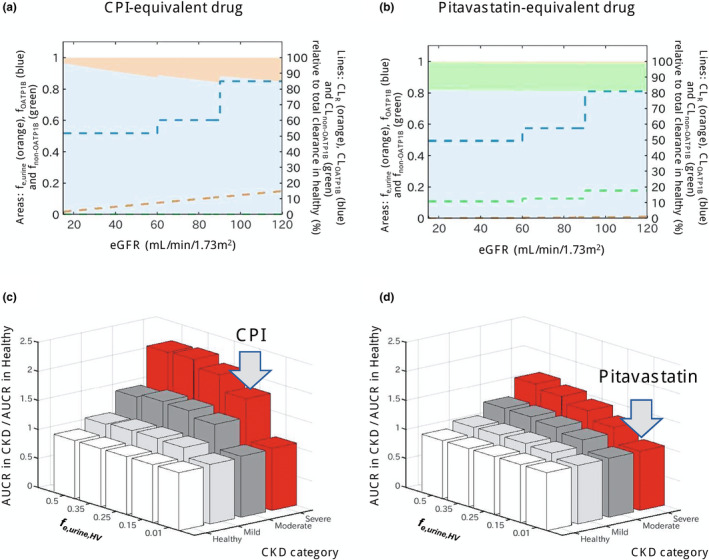
Coproporphyrin I (CPI) is an endogenous biomarker of organic anion transporting polypeptide 1B transporter (OATP1B). CPI plasma baseline was reported to increase with severity of chronic kidney disease (CKD). Further, ratio of CPI area under the plasma concentration-time curve (AUCR) in the presence/absence of OATP1B inhibitor rifampin was higher in patients with CKD compared with healthy participants, in contrast to pitavastatin (a clinical OATP1B probe). This study investigated mechanism(s) contributing to altered CPI baseline in patients with CKD by extending a previously developed physiologically-based pharmacokinetic (PBPK) model to this patient population. CKD-related covariates were evaluated in a stepwise manner on CPI fraction unbound in plasma (fu,p ), OATP1B-mediated hepatic uptake clearance (CLactive ), renal clearance (CLR ), and endogenous synthesis (ksyn ). The CPI model successfully recovered increased baseline and rifampin-mediated AUCR in patients with CKD by accounting for the following disease-related changes: 13% increase in fu,p , 29% and 39% decrease in CLactive in mild and moderate to severe CKD, respectively, decrease in CLR proportional to decline in glomerular filtration rate, and 27% decrease in ksyn in severe CKD. Almost complete decline in CPI renal elimination in severe CKD increased its fraction transported by OATP1B, rationalizing differences in the CPI-rifampin interaction observed between healthy participants and patients with CKD. In conclusion, mechanistic modeling performed here supports CKD-related decrease in OATP1B function to inform prospective PBPK modeling of OATP1B-mediated drug-drug interaction in these patients. Monitoring of CPI allows detection of CKD-drug interaction risk for OATP1B drugs with combined hepatic and renal elimination which may be underestimated by extrapolating the interaction risk based on pitavastatin data in healthy participants.


Conflict of interest statement

The other authors declared no competing interests for this work.

Figures

Figure 1
Figure 1
Strategy of CPI model development for the population with CKD. (a) Structure of models for coproporphyrin I (CPI), pitavastatin (PTV), and rifampin (RIF). Eye symbols represent observed compartments. Dashed squares represent parameters for which CKD effects were evaluated. (b) Workflow of CPI model development for the population with chronic kidney disease (CKD). CL active , hepatic uptake clearance (unbound); CL B , biliary clearance; CL passive , hepatic passive clearance (unbound); CL R , renal clearance; CL RIF , clearance of rifampin; f d1 and f d2 , fractions of Q CO for tissue compartment 1 and 2, respectively; f u,b , fraction unbound in the blood; f u,LT , fraction unbound in liver tissue; ka, first‐order absorption rate constant; Ki, total rifampin inhibition constant for CL active of CPI; Kp ; tissue partition coefficient; Q CO ; cardiac blood flow; Q H , hepatic blood flow; Tk0 RIF , duration of zero‐order absorption; Tlag RIF , lag time; V 1 and V 2 , volumes of tissue compartment 1 and 2, respectively; V B , volume of blood compartment; V C , volume of central compartment; V LT , volume of liver tissue; V LV , volume of liver vascular.
Figure 2
Figure 2
Correlation between baseline coproporphyrin I (CPI) exposure and pitavastatin PK parameters of healthy participants and participants with chronic kidney disease (CKD). Correlations between mean baseline concentration of CPI (Cbase,CPI) and (a) individuals' CL active,PTV estimated in the final pitavastatin CKD model (expressed as relative values to median of those in the healthy group) or (b) pitavastatin AUC without rifampin (AUCPTV,control). Marks represent individual participants, and symbols represent CKD groups: healthy (circle), mild CKD (triangle), moderate CKD (square), and severe CKD (cross). Dashed lines represent regression lines. AUC, area under the plasma concentration‐time curve; CL active,PTV , hepatic uptake clearance of pitavastatin; PK, pharmacokinetic.
Figure 3
Figure 3
VPC (Visual predictive check) for coproporphyrin I (CPI) in plasma and urine, and CPI AUCR in healthy and chronic kidney disease (CKD) groups. (a) CPI in plasma and urine on two occasions with (+ Rifampin) or without rifampin treatment (Control) was simulated for each group. Circles, observed data; dashed lines, 10%, 50%, and 90% quantiles of the prediction (based on 5,000 simulated individuals in each group). (b) CPI AUCR (AUC with rifampin/AUC without rifampin) was simulated for each group. Circles and gray areas represent observed data and 10–90% quantiles of the prediction (based on 5,000 simulated individuals in each group), respectively. Amt, amount; AUC, area under the plasma concentration‐time curve; Conc, concentration.
Figure 4
Figure 4
Parameter sensitivity analysis for baseline plasma concentration of coproporphyrin I (CPI) and AUCR for CPI–rifampin interaction. (a) Normalized sensitivity coefficient of CPI model parameters for baseline CPI or CPI AUCR (AUC with rifampin/AUC without rifampin) calculated based on the developed CPI model for a typical healthy participant. (b) Percent change in baseline CPI or CPI AUCR in severe CKD relative to healthy population calculated based on the magnitude of CKD‐related physiological changes estimated in the CPI CKD model. Volume of liver represents volume of the whole liver including both V LV and V LT . AUC, area under the plasma concentration‐time curve; CKD, chronic kidney disease; CL active,CPI , hepatic uptake clearance; CL B,CPI , biliary clearance; CL R,CPI , renal clearance; f u,p,CPI , fraction unbound in plasma; f u,L,CPI , fraction unbound in liver; k syn , endogenous synthesis rate; Q H , hepatic blood flow; Rb, blood to plasma ratio; V C,CPI , volume of central compartment; V LT , volume of liver tissue; V LV , volume of liver vascular.
Figure 5
Figure 5
Effect of chronic kidney disease (CKD) on OATP1B‐mediated interactions for drugs with different contributions of hepatic and renal elimination. (a,b) Change in fraction transported of CPI‐equivalent and pitavastatin‐equivalent drugs by OATP1B (f OATP1B , blue area), non‐OATP1B hepatic uptake (f non‐OATP1B , green area), and renal elimination (f e,urine , orange area) derived from CKD‐derived decline in each route. Dashed lines represent clearances via each elimination route (CL OATP1B , CL non‐OATP1B , and CL R ) in different stages of CKD, expressed as relative values to a total clearance in healthy population (label on the right axis). The CPI‐equivalent drug has f e,urine in the healthy population (f e,urine,HV ) of 0.15 and hepatic uptake via OATP1B only (f OATP1B,HV of 0.85). The pitavastatin‐equivalent drug has minimal renal elimination (f e,urine,HV of 0.01) and hepatic uptake via OATP1B (f OATP1B of 0.812, 82% of nonrenal clearance) and non‐OATP1B route (f non‐OATP1B,HV of 0.178, 18% of nonrenal clearance). Simulations were performed assuming that both OATP1B and non‐OATP1B routes contributing to CL active decline to the same extent in CKD and that decrease in CL R is proportional to decline in eGFR (healthy: CL active 100% and CL R 100%; mild CKD: CL active 71% and CL R 75%; moderate CKD: CL active 61% and CL R 50%; severe CKD: CL active 61% and CL R 13%). (c,d) Ratio of AUCR (with/without OATP1B inhibitor) in the population with CKD relative to the healthy population calculated for hypothetical OATP1B drugs with f e,urine,HV ranging from 0.01 to 0.5 and different proportion of non‐OATP1B route to total hepatic uptake clearance (c: none, d: 18%); all assumptions as highlighted above. Gray arrows indicate drugs equivalent to CPI and pitavastatin. Simulations illustrate that presence of non‐OATP1B‐mediated hepatic clearance (assumed to decline in the same manner as OATP1B in CKD) decreases the difference in OATP1B AUCR between CKD and healthy, as the CKD‐derived shift in fraction transported is then not solely attributed to OATP1B. AUCR, ratio of area under the plasma concentration‐time curve; CL active , hepatic uptake clearance; CL R , renal clearance; CPI, coproporphyrin I; eGFR, estimated glomerular filtration rate; OATP1B, organic anion transporting polypeptide 1B.

References

    1. Evers, R. et al. Disease‐associated changes in drug transporters may impact the pharmacokinetics and/or toxicity of drugs: a white paper from the International Transporter Consortium. Clin. Pharmacol. Ther. 104, 900–915 (2018). - PMC - PubMed
    1. Lea‐Henry, T.N. , Carland, J.E. , Stocker, S.L. , Sevastos, J. & Roberts, D.M. Clinical pharmacokinetics in kidney disease: fundamental principles. Clin. J. Am. Soc. Nephrol. 13, 1085–1095 (2018). - PMC - PubMed
    1. Yeung, C.K. et al. Organ impairment‐drug‐drug interaction database: a tool for evaluating the impact of renal or hepatic impairment and pharmacologic inhibition on the systemic exposure of drugs. CPT Pharmacometrics Syst. Pharmacol. 4, 489–494 (2015). - PMC - PubMed
    1. Miners, J.O. , Yang, X. , Knights, K.M. & Zhang, L. The role of the kidney in drug elimination: transport, metabolism, and the impact of kidney disease on drug clearance. Clin. Pharmacol. Ther. 102, 436–449 (2017). - PubMed
    1. Tan, M.L. et al. Effect of chronic kidney disease on nonrenal elimination pathways: a systematic assessment of CYP1A2, CYP2C8, CYP2C9, CYP2C19, and OATP. Clin. Pharmacol. Ther. 103, 854–867 (2018). - PMC - PubMed

Publication types