. 2022 Aug;37(8):1545-1561.
doi: 10.1002/jbmr.4616. Epub 2022 Jun 29.

Skeletal Stem/Progenitor Cells in Periosteum and Skeletal Muscle Share a Common Molecular Response to Bone Injury

Affiliations

Skeletal Stem/Progenitor Cells in Periosteum and Skeletal Muscle Share a Common Molecular Response to Bone Injury

Anais Julien et al. J Bone Miner Res. 2022 Aug.

Abstract

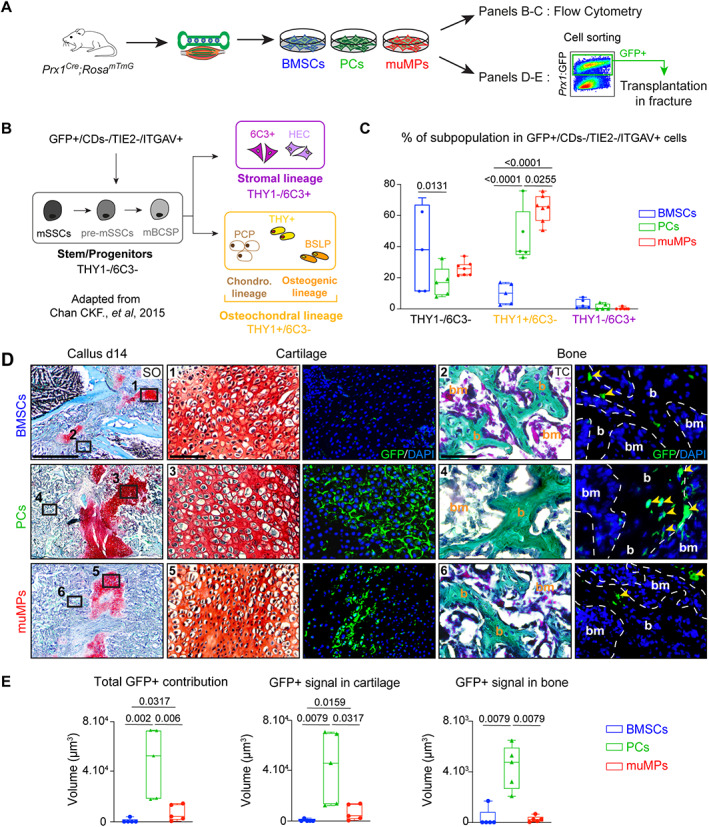
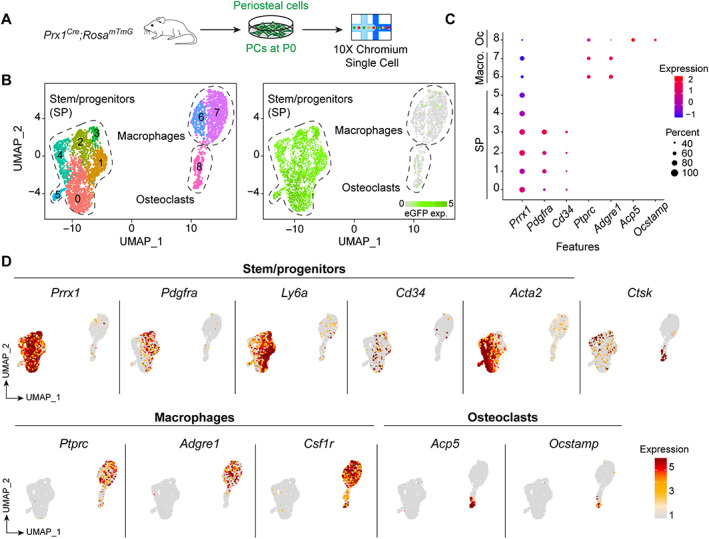
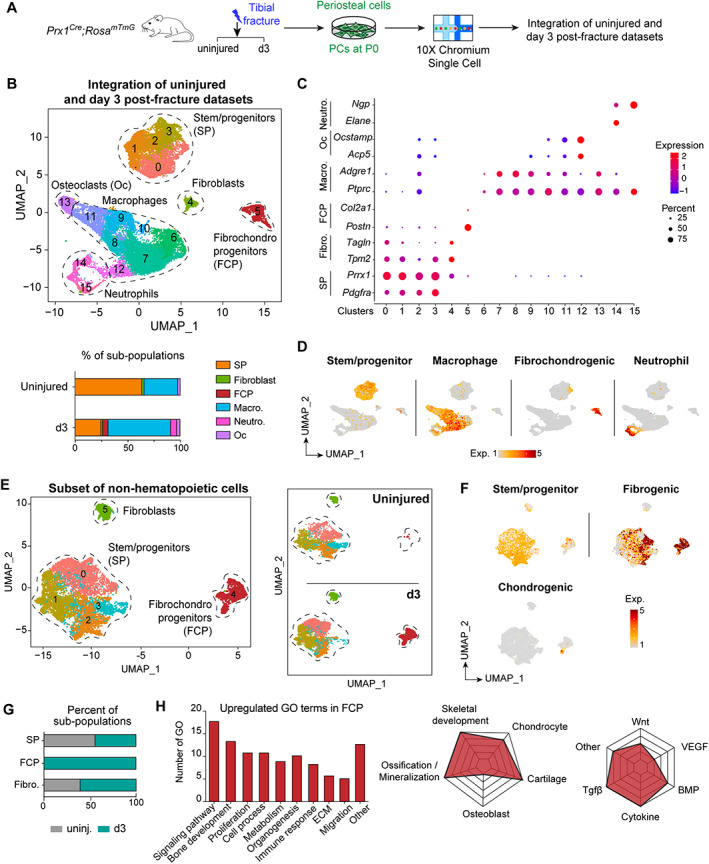
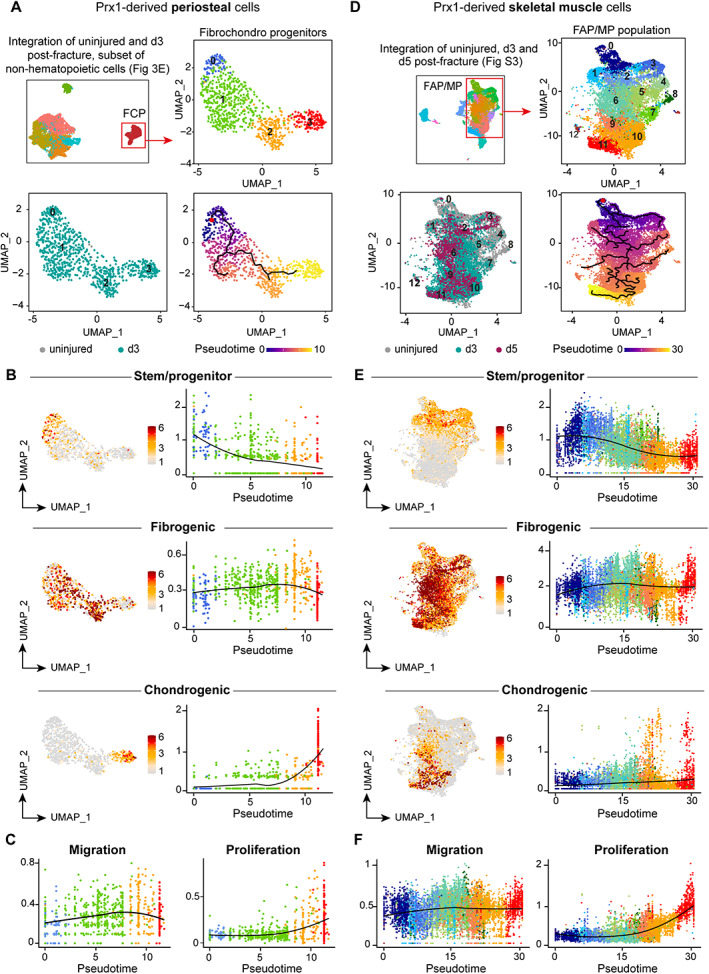
Bone regeneration involves skeletal stem/progenitor cells (SSPCs) recruited from bone marrow, periosteum, and adjacent skeletal muscle. To achieve bone reconstitution after injury, a coordinated cellular and molecular response is required from these cell populations. Here, we show that SSPCs from periosteum and skeletal muscle are enriched in osteochondral progenitors, and more efficiently contribute to endochondral ossification during fracture repair as compared to bone-marrow stromal cells. Single-cell RNA sequencing (RNAseq) analyses of periosteal cells reveal the cellular heterogeneity of periosteum at steady state and in response to bone fracture. Upon fracture, both periosteal and skeletal muscle SSPCs transition from a stem/progenitor to a fibrogenic state prior to chondrogenesis. This common activation pattern in periosteum and skeletal muscle SSPCs is mediated by bone morphogenetic protein (BMP) signaling. Functionally, Bmpr1a gene inactivation in platelet-derived growth factor receptor alpha (Pdgfra)-derived SSPCs impairs bone healing and decreases SSPC proliferation, migration, and osteochondral differentiation. These results uncover a coordinated molecular program driving SSPC activation in periosteum and skeletal muscle toward endochondral ossification during bone regeneration. © 2022 The Authors. Journal of Bone and Mineral Research published by Wiley Periodicals LLC on behalf of American Society for Bone and Mineral Research (ASBMR).

Keywords: BMP PATHWAY; BONE REPAIR; PERIOSTEUM; SINGLE CELL RNA SEQUENCING; SKELETAL STEM/PROGENITOR CELLS.


Conflict of interest statement

Authors declare no competing interests.

Figures

Fig. 1
Fig. 1
Periosteum‐derived and skeletal muscle‐derived cells are enriched in osteochondral progenitors and contribute efficiently to endochondral ossification during bone repair. (A) Experimental design. BMSCs, PCs, and skeletal muMPs were isolated from Prx1 Cre ;Rosa mTmG mice and cultured for one passage before flow cytometry analyses or cell sorting based on GFP expression prior to cell transplantation at the fracture site. (B) Schematic representation of hierarchical organization of skeletal stem/progenitor cells adapted from.( 38 ) Prx1‐derived GFP+ cells were gated first; hematopoietic and endothelial cells were excluded (CDs‐ = TER119−/CD45−/TIE2−) and ITGAV+ cells were included in the analysis. THY1 and 6C3 markers expression allow the identification of stem/progenitors (THY1−/6C3−), osteochondral (THY1+/6C3−) and stromal (THY1−/6C3+) subpopulations. (C) Percentage of skeletal stem/progenitor, osteochondral, and stromal cells in Prx1‐derived GFP+ BMSCs, PCs, and muMPs (n = 5–7 cell cultures per group). (D) Left, Longitudinal sections of fracture callus at d14 post‐fracture stained by SO. Middle‐right, High magnifications of boxed areas in cartilage and bone stained by SO and TC, respectively, and adjacent sections counterstained with DAPI (bone is delimited by a white dotted line). Boxed areas 1 and 2 showing limited contribution of BMSCs to cartilage and bone, boxed areas 3 and 4 showing robust contribution of PCs to cartilage and bone, and boxed areas 5 and 6 showing contribution of muMPs to cartilage and limited contribution to bone. Yellow arrowheads indicate contribution of transplanted cells to bone. (E) Histomorphometric quantification of total GFP+ signal and GFP+ signal in cartilage and bone, respectively. (C) Each dot represents an independent cell culture; (E) each dot represents a single animal. Values represent the median and interquartile range. (C) Exact p value calculated by two‐way ANOVA followed by Tukey test. (E) n = 5 per group, exact p value calculated with one‐way ANOVA followed by two‐sided Mann‐Whitney test. Scale bars: SO low magnification= 1 mm, cartilage high magnification = 200 μm, bone high magnification = 50 μm. b = bone; bm = bone marrow; BMSC = bone marrow stromal cell; muMP = muscle mesenchymal progenitor; PC = periosteal cell; SO = Safranin O; TC = trichrome.
Fig. 2
Fig. 2
Single‐cell RNAseq of periosteal cells at steady state. (A) Experimental design of scRNAseq of PCs at steady state. PCs were isolated from uninjured tibia of Prx1 Cre ;Rosa mTmG mice by explant culture without expansion and subjected to scRNAseq analyses at P0. (B) Left: clusterization of PCs. Right: Feature plot of eGFP expression. (C) Expression of markers used to define SP, Macro, and Oc clusters. (D) Representation of SP, Macro, and OC marker expression. Macro = macrophage; Oc = osteoclast; P0 = passage 0; PC = periosteal cell; SP = stem/progenitor.
Fig. 3
Fig. 3
Single‐cell RNAseq of periosteal cells post‐fracture. (A) Experimental design of scRNAseq. PCs were isolated from Prx1 Cre ;Rosa mTmG mice by explant culture from uninjured tibia and from fractured tibia at d3 post‐fracture and used at P0 for scRNAseq. (B) Top, Clusterization of integrated uninjured and d3 post‐fracture datasets define six subpopulations (delimited by a black dotted line and named). Bottom, Percentage of subpopulations per sample. (C) Dot plot of markers used to define cell populations. (D) Feature plot of stem/progenitor, macrophage, fibrochondrogenic, and neutrophil lineage scores. (E) Left, UMAP projection of uninjured and d3 post‐fracture datasets subclusterized for non‐hematopoietic cells. Right, Split UMAP visualization of non‐hematopoietic cells from uninjured and d3 post‐fracture datasets. (F) Feature plot of stem/progenitor, fibrogenic, and chondrogenic lineage scores in the non‐hematopoietic cells. (G) Percentage of subpopulations per sample. (H) Left, GO analyses of upregulated genes in FCP subpopulation. Middle, Radar chart of skeletal related functions. Right, signaling pathways enriched in GO analyses. d3 = day 3; FCP = fibrochondro progenitor; Fibro. = fibroblast; GO = gene ontology; Macro. = macrophage; Neutro. = neutrophil; Oc = osteoclast; PC = periosteal cell; SP = stem/progenitor; UMAP = uniform manifold approximation and projection.
Fig. 4
Fig. 4
Single‐cell RNAseq reveals similar activation patterns of periosteum and muscle progenitors after bone fracture. (A) Top left, UMAP projection of subclusterization of non‐hematopoietic PCs as in Fig. 3E. Top right, UMAP projection of FCPs used for the subsequent analyses. Bottom left, UMAP visualization of sample origin of FCPs (uninjured in gray and d3 post‐fracture in green). Bottom right, Pseudotime trajectory analysis of periosteum‐derived FCPs. (B) Feature plot and scatter plot of stem/progenitor (top), fibrogenic (middle), and chondrogenic (bottom) lineage scores along pseudotime in periosteum derived FCPs. (C) Scatter plot of migration and proliferation lineage scores along pseudotime in FCPs. (D) Top left, UMAP projection of Prx1‐derived skeletal muscle cells from uninjured tissue and from d3 and d5 post‐fracture samples as in Fig. S4. Top right, UMAP projection of subclusterization of Prx1‐derived skeletal muscle FAP/MP used for the subsequent analyses. Bottom left, UMAP visualization of sample origin of Prx1‐derived skeletal muscle FAP/MP (uninjured in gray, d3 post‐fracture in green and d5 post‐fracture in purple). Bottom right, Pseudotime trajectory analysis of Prx1‐derived skeletal muscle FAP/MP. (E) Feature plot and scatter plot of stem/progenitor (top), fibrogenic (middle), and chondrogenic (bottom) lineage scores along pseudotime in FAP/MP. (F) Scatter plot of migration and proliferation lineage scores along pseudotime in FAP/MP. Color scheme used in B and C corresponds to the color of clusters used in A, and color scheme used in and E and F corresponds to the color of clusters used in D. d3 = day 3; FAP = fibroadipogenic progenitor; FCP = fibrochondro progenitor; MP = mesenchymal progenitor; PC = periosteal cell; UMAP = uniform manifold approximation and projection.
Fig. 5
Fig. 5
BMP signaling is upregulated in injury‐activated periosteum and muscle progenitors. (A) Experimental design of microarray analyses.( 33 ) Tibia and adjacent skeletal muscle were harvested from uninjured hindlimbs at d2 and d7 post‐fracture and used for microarray analyses. (B) Representation of upregulated signaling pathways from Gene Ontology analyses between d2 versus uninjured (in orange, left) and between d7 versus d2 (in purple, right). (C) Heat map of BMP signaling components from microarray dataset. (D,E) Experimental design of scRNAseq of Prx1‐derived periosteal cells and skeletal muscle progenitors. Violin plot of BMP signaling pathway expression (left) and detailed visualization of receptor (Acvr1, Bmpr1a, Bmpr1b, Bmpr2), co‐factor (Smad1, Smad4, Smad5), and target (Id1) gene expression (right) in Prx1‐derived FCPs (D) and skeletal muscle FAP/MP (E). (F) Transverse section of d3 post‐fracture Prx1 Cre ;Rosa mTmG hindlimb stained with PS showing activated periosteum (delimited by a black dotted line). High magnifications of boxed areas from adjacent section counterstained with DAPI show phosphoSMAD1/5/9 positive nuclei (white, pointed with yellow arrowhead) in GFP+ cells (in green) within periosteum (middle), and adjacent skeletal muscle (right). Scale bars: low magnification = 200 μm, high magnification = 50 μm. bm = bone‐marrow; d2 = day 2; PS = Picrosirius.
Fig. 6
Fig. 6
Loss of Bmpr1a in Pdgfra‐derived progenitors impairs bone healing. (A) Experimental design. Bmpr1a fl/fl (control) and Pdgfra CreERT ;Bmpr1a fl/fl mice were induced with TMX at days 7 and 1 before fracture, day 0 and day 1 post‐fracture. Tibial fractures were induced at d0 and calluses were harvested at d14 and d21 post‐fracture. (B) Histomorphometric quantification of callus, cartilage, and bone volumes at d14 and d21 post‐fracture in Bmpr1a fl/fl control and Pdgfra CreERT ;Bmpr1a fl/fl mutant mice (in black and orange, respectively) (n = 6–7 animals per group). (C) Longitudinal callus sections from Pdgfra CreERT ;Rosa mTmG ;Bmpr1a +/+ control (left) and Pdgfra CreERT ;Rosa mTmG ;Bmpr1a fl/fl mutant (right) mice at d14 post‐fracture stained with SO (callus delimited by a black dotted line). High magnifications of boxed areas of cartilage (1 and 3) and bone (2 and 4) show Pdgfra‐derived cells in cartilage and bone. (D) Quantification of GFP+ signal normalized on total GFP+ and Tomato+ signal in cartilage and bone. n = 4–5 animals per group, each dot represents a single animal. Exact p value calculated with two‐sided Mann‐Whitney test, values represent median and interquartile range. Scale bars: low magnification = 1 mm, high magnification = 200 μm. b = bone; bm = bone‐marrow; d0 = day 0; SO = Safranin O; TMX = tamoxifen.
Fig. 7
Fig. 7
Bmpr1a inactivation in Pdgfra‐derived cells affects periosteum and muscle progenitors during bone repair. (A) Top, Experimental design of periosteum or EDL grafts from Pdgfra CreERT ;Rosa mTmG ;Bmpr1a +/+ (Bmpr1a control ) or Pdgfra CreERT ; Rosa mTmG ;Bmpr1a fl/fl (Bmpr1a cKO ) mice transplanted at the fracture site of wild‐type hosts. Donor mice were induced with TMX at d7, d6, d5, and d1 prior to fracture. Fractures were induced at d0, and samples were collected at d14 post‐fracture. Bottom, Longitudinal callus sections stained with SO at d14 post‐fracture and periosteum (left) or EDL muscle (right) graft from Bmpr1a control (top) and Bmpr1a cKO (bottom) mice (callus delimited by a black dotted line, graft delimited by an orange/yellow dotted line). High magnifications of boxed areas of cartilage show reduced contribution to cartilage of Pdgfra‐derived cells from Bmpr1a cKO periosteal and EDL muscle grafts compared to Bmpr1a control . Magenta boxed areas show GFP+ hypertrophic chondrocytes from EDL muscle grafts. (B) Quantification of GFP+ contribution normalized on total cellular contribution to cartilage and bone of periosteum and EDL muscle grafts. n = 5–6 animals per group, each dot represents a single animal. (C) Distance between GFP+ chondrocytes and the border of periosteum or EDL grafts (delimited by an orange dotted line) from Bmpr1a control and Bmpr1a cKO donors. Control periosteum: n = 284 cells, mutant periosteum: n = 99 cells, control EDL: n = 302 cells, and mutant EDL: n = 120 cells. Five animals were used per group. Each dot represents an individual cell. (D) Left, Experimental design. Bmpr1a control and Bmpr1a cKO mice were induced with TMX at d7 and d1 before fracture, d0 and d1 post‐fracture. Samples were harvested at d3 post‐fracture. Right, Transverse sections of fracture site at d3 post‐fracture were stained with PS and adjacent sections were immunostained for Ki67 (Ki67 cells in yellow, pointed with yellow arrowhead). High magnifications of boxed areas in activated periosteum (delimited by a dotted line) and skeletal muscle adjacent to fracture site show less Ki67+/GFP+ cells in Bmpr1a cKO mice compared to Bmpr1a control mice. (E) Quantification of GFP + Ki67+ over the total GFP+ cells in activated periosteum and skeletal muscle at d3 post‐fracture in tamoxifen induced Bmpr1a control and Bmpr1a cKO mice. n = 3–4 animals per group, each dot represents a single animal. (F) Left, Experimental design of in vitro cell differentiation, migration, and proliferation assays. Bmpr1a control and Bmpr1a cKO mice were induced with tamoxifen at d7, d6, d5, and d1 before experiment. Pdgfra‐derived GFP+ cells were collected from skeletal muscles surrounding the tibia, sorted based on GFP expression and cultured in vitro prior analyses. (i) Representative images of osteogenic (top, osteo) and chondrogenic (bottom, chondro) differentiation assays of GFP+ cells isolated from Bmpr1a control and Bmpr1a cKO mice, (ii) Percentage of migrating cells assessed by in vitro transwell migration assay, (iii) AUC of proliferation. n = 3 independent primary cultures per group, each dot represents a primary culture. Statistical analyses: Exact p value calculated with two‐sided Mann‐Whitney test; values represent median and interquartile range. Scale bars: low magnification = 200 μm, high magnification = 50 μm. AUC = area under the curve; b = bone; bm = bone‐marrow; cart = cartilage; chondro = chondrogenic; d0 = day 0; osteo = osteogenic; PS = Picrosirius; SO = Safranin O; TMX = tamoxifen.

References

    1. Colnot C. Skeletal cell fate decisions within periosteum and bone marrow during bone regeneration. J Bone Miner Res. 2009;24(2):274‐282. - PMC - PubMed
    1. Julien A, Kanagalingam A, Martínez‐Sarrà E, et al. Direct contribution of skeletal muscle mesenchymal progenitors to bone repair. Nat Commun. 2021;12(1):1‐14. - PMC - PubMed
    1. Bianco P, Cao X, Frenette PS, et al. The meaning, the sense and the significance: translating the science of mesenchymal stem cells into medicine. Nat Med. 2013;19(1):35‐42. - PMC - PubMed
    1. Crane JL, Cao X. Bone marrow mesenchymal stem cells and TGF‐β signaling in bone remodeling. J Clin Invest. 2014;124(2):466‐472. - PMC - PubMed
    1. Roberts SJ, van Gastel N, Carmeliet G, Luyten FP. Uncovering the periosteum for skeletal regeneration: the stem cell that lies beneath. Bone. 2015;70:10‐18. - PubMed

Publication types