. 2022 Jul 1;132(13):e149906.
doi: 10.1172/JCI149906.

A mitochondrial unfolded protein response inhibitor suppresses prostate cancer growth in mice via HSP60

Affiliations

A mitochondrial unfolded protein response inhibitor suppresses prostate cancer growth in mice via HSP60

Rahul Kumar et al. J Clin Invest. .

Abstract

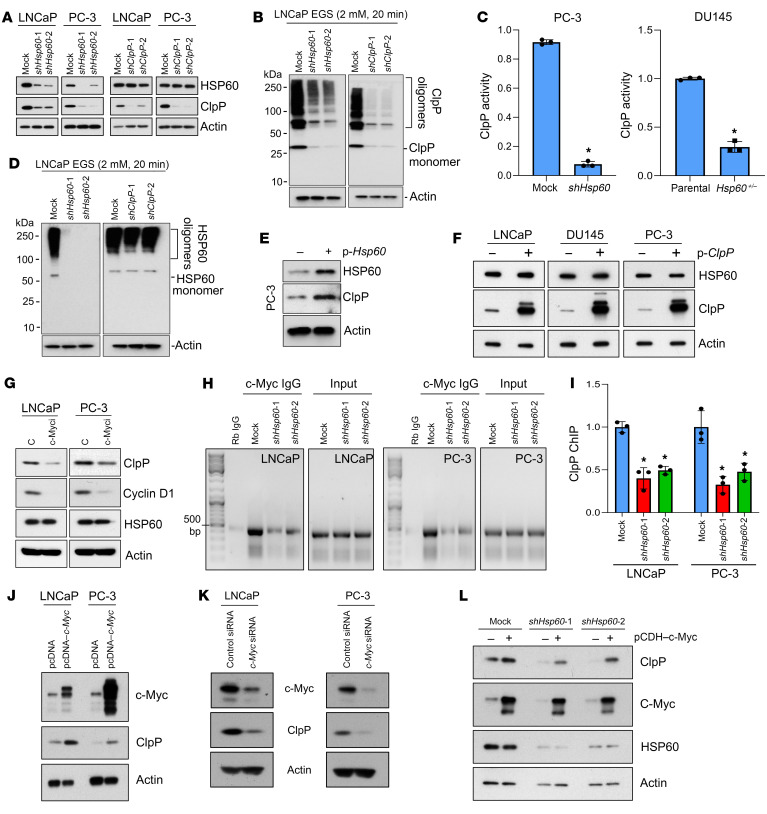
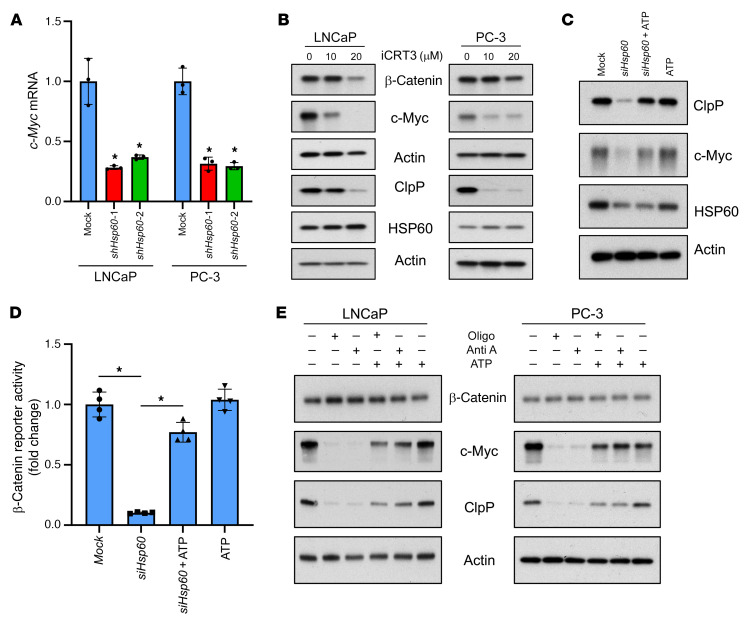
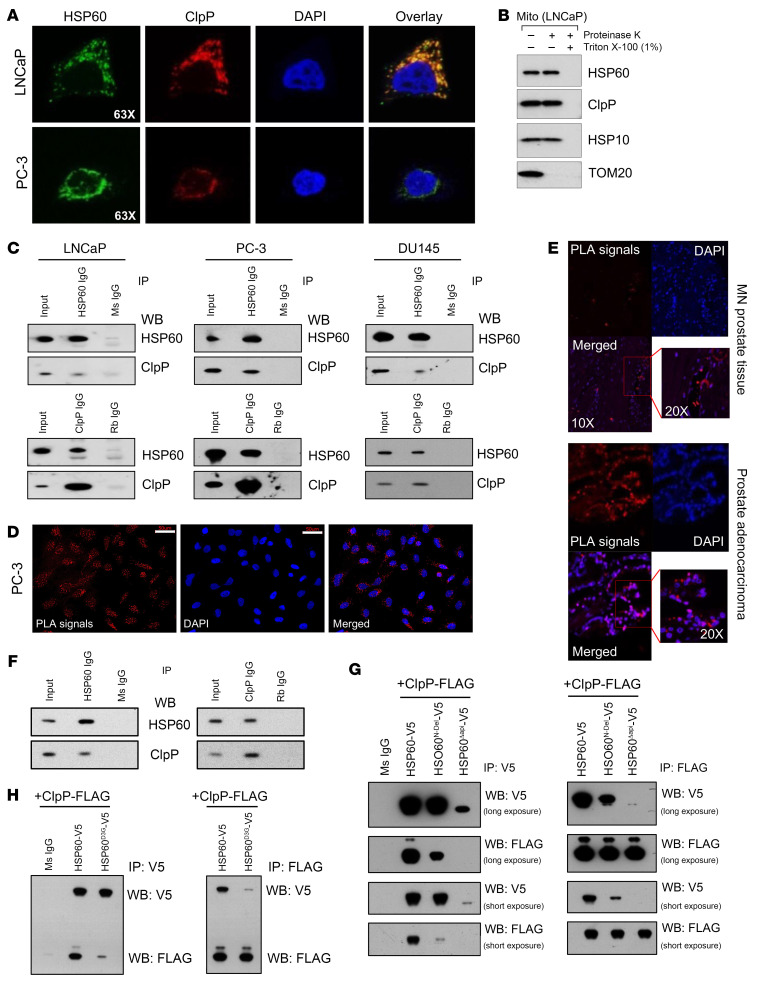
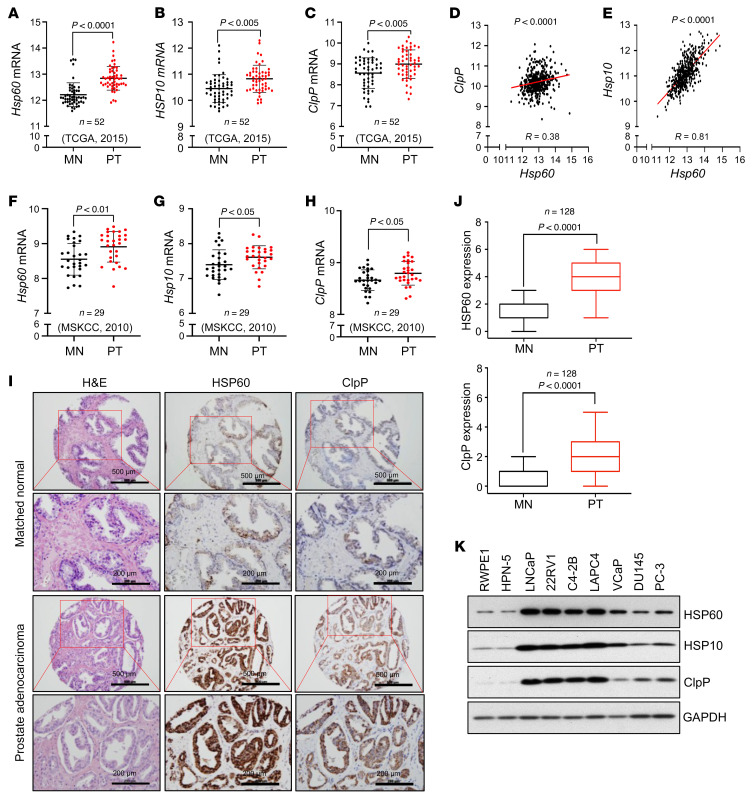
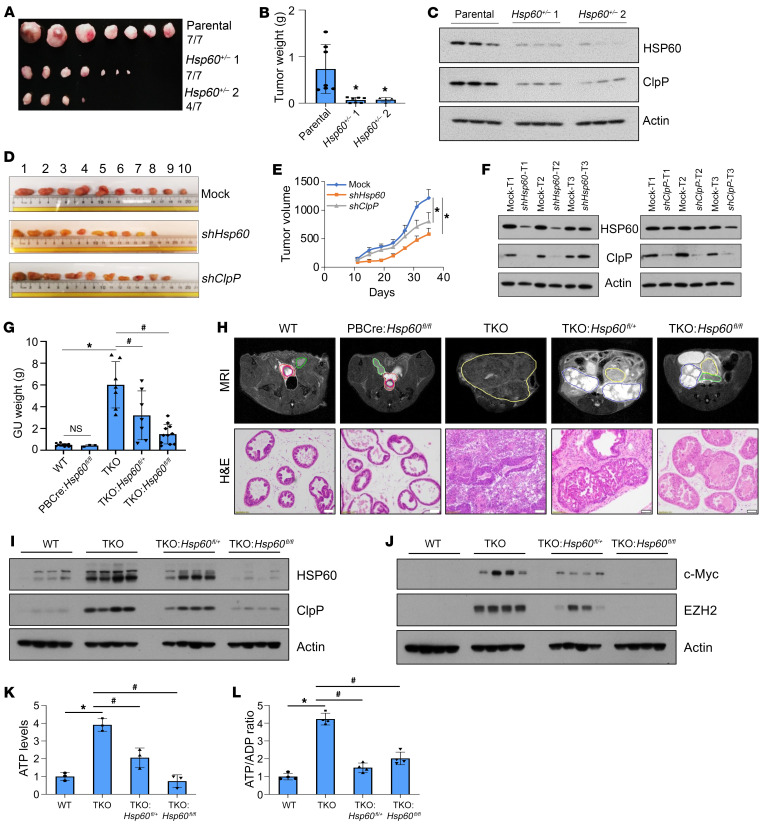
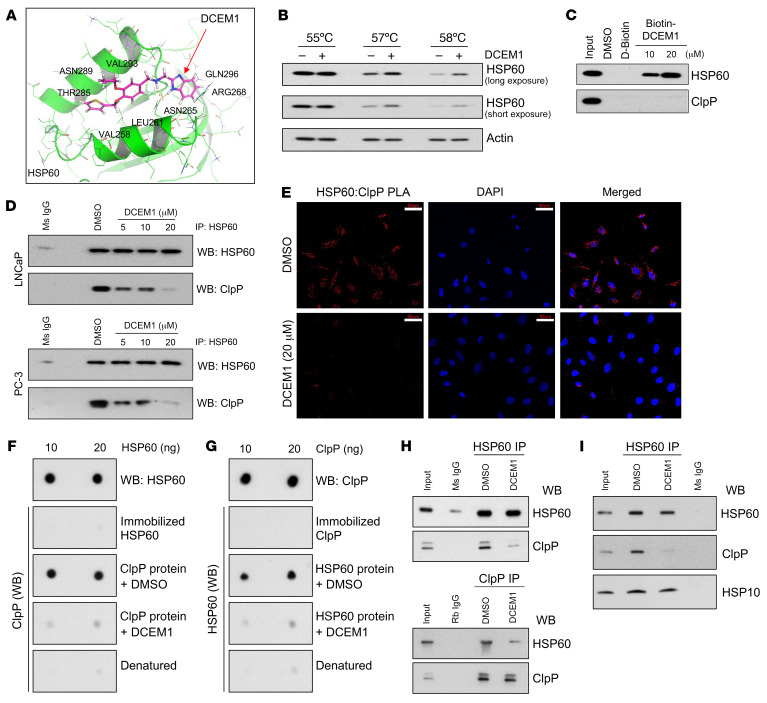
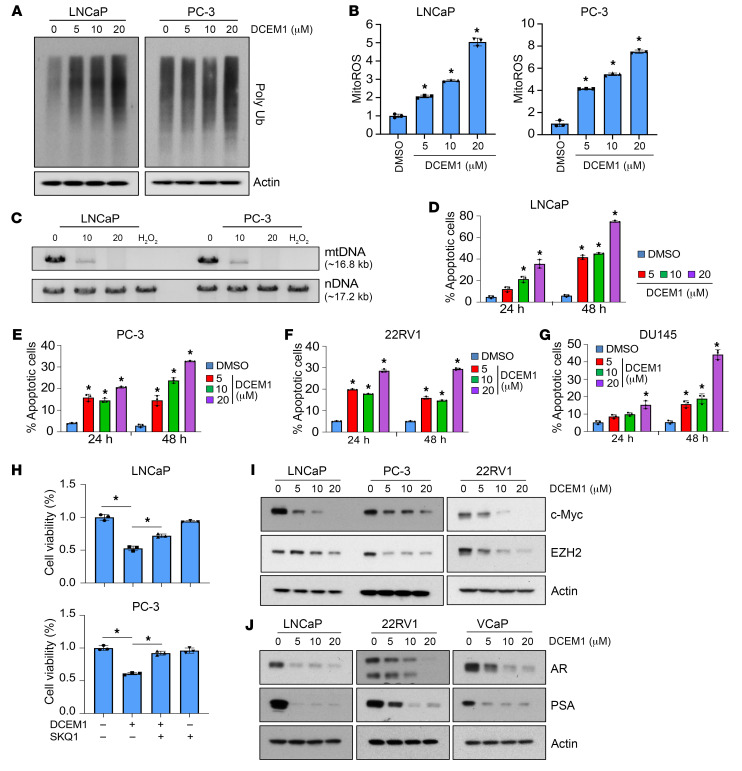
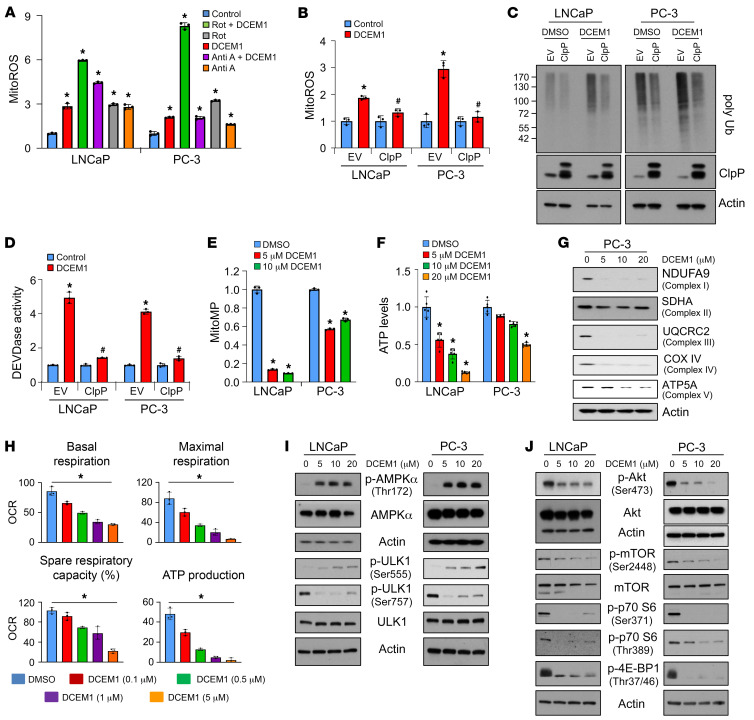
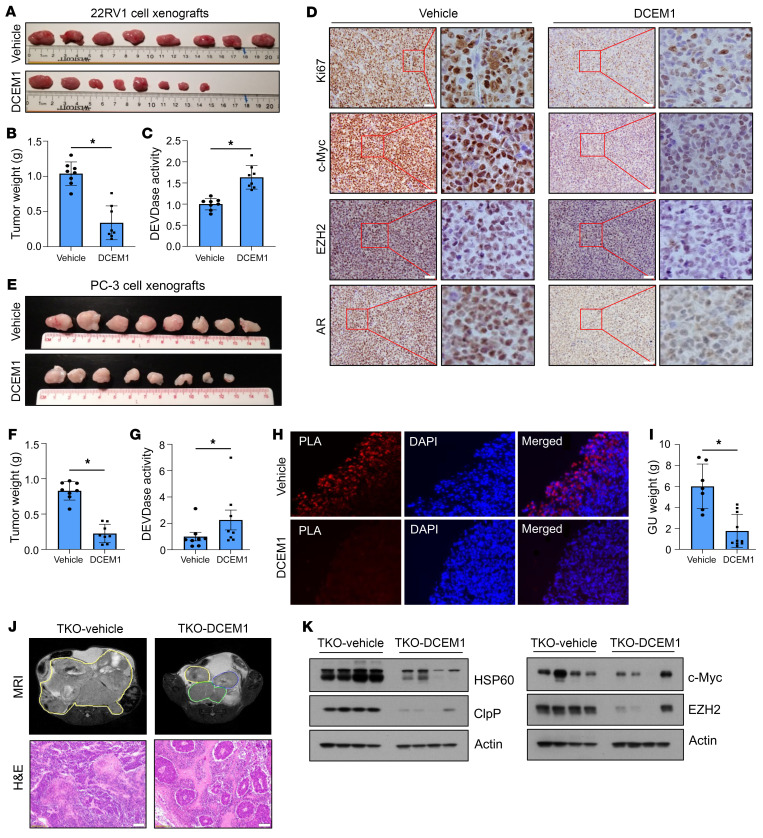
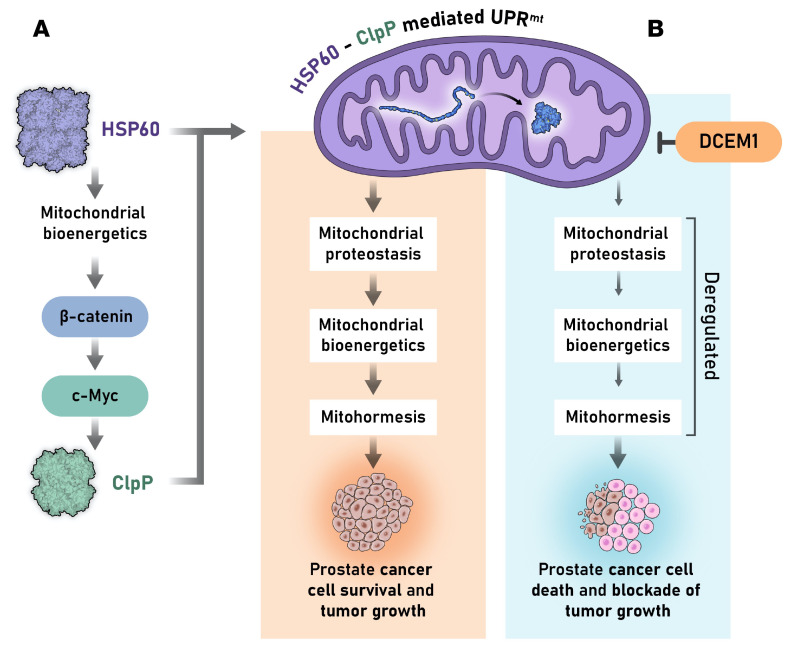
Mitochondrial proteostasis, regulated by the mitochondrial unfolded protein response (UPRmt), is crucial for maintenance of cellular functions and survival. Elevated oxidative and proteotoxic stress in mitochondria must be attenuated by the activation of a ubiquitous UPRmt to promote prostate cancer (PCa) growth. Here we show that the 2 key components of the UPRmt, heat shock protein 60 (HSP60, a mitochondrial chaperonin) and caseinolytic protease P (ClpP, a mitochondrial protease), were required for the development of advanced PCa. HSP60 regulated ClpP expression via c-Myc and physically interacted with ClpP to restore mitochondrial functions that promote cancer cell survival. HSP60 maintained the ATP-producing functions of mitochondria, which activated the β-catenin pathway and led to the upregulation of c-Myc. We identified a UPRmt inhibitor that blocked HSP60's interaction with ClpP and abrogated survival signaling without altering HSP60's chaperonin function. Disruption of HSP60-ClpP interaction with the UPRmt inhibitor triggered metabolic stress and impeded PCa-promoting signaling. Treatment with the UPRmt inhibitor or genetic ablation of Hsp60 inhibited PCa growth and progression. Together, our findings demonstrate that the HSP60-ClpP-mediated UPRmt is essential for prostate tumorigenesis and the HSP60-ClpP interaction represents a therapeutic vulnerability in PCa.

Keywords: Cell Biology; Cell stress; Mitochondria; Oncology; Prostate cancer.


Figures

Figure 1
Figure 1. HSP60 regulates ClpP expression and function via c-Myc but not vice versa.
(A) Hsp60- and ClpP-silenced LNCaP and PC-3 cells were analyzed for HSP60 and ClpP expression. (B) Hsp60-and ClpP-silenced LNCaP cells were crosslinked with ethylene glycol bis(succinimidyl succinate) (EGS). Protein samples were resolved in an SDS-PAGE gel and probed with an anti-ClpP antibody to analyze its oligomerization status. (C) Enzymatic activity of ClpP was assayed from mitochondrial pellets isolated from Hsp60-silenced PC-3 cells and Hsp60+/– DU145 cells. Data are presented as fold change compared to respective controls. (D) Hsp60- and ClpP-silenced LNCaP cells were crosslinked with EGS. Protein samples were resolved in an SDS-PAGE gel and probed with an anti-HSP60 antibody to analyze its oligomerization status. (E) HSP60 was overexpressed in PC-3 cells and analyzed for ClpP expression. (F) ClpP was overexpressed in LNCaP, DU145, and PC-3 cells and analyzed for HSP60 expression. (G) LNCaP and PC-3 cells were untreated (C) or treated with c-Myc inhibitor (c-Myci, 10058-F4, 50 μM) for 24 hours. Whole-cell lysates (WCLs) were prepared and analyzed for cyclin D1, ClpP, and HSP60 expression. (H) Efficiency of c-Myc binding to the ClpP promoter in Hsp60-silenced LNCaP and PC-3 cells was determined using a chromatin immunoprecipitation (ChIP) assay. (I) Quantitation of the data shown in H, represented as fold change compared to mock cells. (J) c-Myc was overexpressed in LNCaP and PC-3 cells and analyzed for ClpP expression. (K) c-Myc was silenced in LNCaP and PC-3 cells using c-Myc–specific siRNA (100 nM) and analyzed for ClpP expression. (L) c-Myc was overexpressed in Hsp60-silenced LNCaP cells and analyzed for ClpP expression. Data are mean ± SD. *P < 0.05 by 2-tailed Student’s t test (C) or 1-way ANOVA followed by Dunnett’s multiple-comparison test (I). Actin serves as a loading control.
Figure 2
Figure 2. HSP60 regulates c-Myc expression via the β-catenin pathway.
(A) Analysis of c-Myc mRNA expression levels in Hsp60-silenced LNCaP and PC-3 cells by real-time PCR using actin mRNA as an internal control. (B) Treatment of PCa cells with β-catenin inhibitor iCRT3 for 48 hours downregulated expression of c-Myc and ClpP proteins without any effect on HSP60 protein expression. (C) Treatment of Hsp60-silenced LNCaP cells with 2 mM ATP for 24 hours rescued the expression of c-Myc and ClpP. (D) Assessment of β-catenin promoter reporter activity in Hsp60-silenced LNCaP cells; treatment of cells with 2 mM ATP rescued the promoter activity. (E) Treatment with mitochondrial OXPHOS complex inhibitors oligomycin (Oligo, 2 μM) and antimycin A (Anti A, 10 μM) for 48 hours downregulated c-Myc and ClpP expression in PCa cells without affecting the expression of β-catenin. Pretreatment of cells with 2 mM ATP rescued the expression of c-Myc and ClpP proteins. Data are mean ± SD. *P < 0.05 by 1-way ANOVA followed by Dunnett’s multiple-comparison test (A) or 1-way ANOVA followed by Tukey’s multiple-comparison test (D). Actin serves as a loading control.
Figure 3
Figure 3. HSP60 and ClpP directly interact in mitochondria.
(A) Representative immunofluorescence images showing colocalization of HSP60 and ClpP. (B) Proteinase K and Triton X-100 digests were performed to determine HSP60, ClpP, and HSP10 colocalization in mitochondria (Mito). (C) Co-IPs were performed to determine HSP60 and ClpP interactions in LNCaP, PC-3, and DU145 cells. (D) Proximity ligation assay (PLA) between HSP60 and ClpP was performed in PC-3 cells. Scale bars: 50 μm. (E) PLA between HSP60 and ClpP was performed in TMA (n = 128) constructed from matched normal prostate (MN) and prostate adenocarcinoma tissue. (F) Co-IPs were performed to determine HSP60 and ClpP interactions in TKO prostatic tumor tissues. (G) Mitochondrial localization signal (HSP60N-Del) and apical domain (HSP60Δapi) were deleted from the HSP60 construct with a V5 tag and cotransfected with a ClpP construct with a FLAG tag in PC-3 cells. Co-IPs were performed using either anti-V5 antibody or anti-FLAG antibody. Ms IgG, control mouse IgG. (H) D3G mutant form of HSP60 (HSP60D3G) construct with V5 tag was cotransfected with the ClpP construct with a FLAG tag in PC-3 cells. Co-IPs were performed using either anti-V5 or -FLAG antibody. IP, immunoprecipitation; WB, Western blotting.
Figure 4
Figure 4. The UPRmt components are upregulated in human PCa.
(A) Hsp60 transcript reads in prostate tumors compared to matched normal counterparts from TCGA 2015 data set. (B) Hsp10 transcript reads in prostate tumors (PTs) compared to matched normal (MN) counterparts from TCGA 2015 data set. (C) ClpP transcript reads in PTs compared to MN counterparts from TCGA 2015 data set. (D) Correlative analysis between Hsp60 and ClpP transcript reads from TCGA 2015 data set. (E) Correlative analysis between Hsp60 and Hsp10 transcript reads from TCGA 2015 data set. (F) Hsp60 transcript reads in PTs compared to MN counterparts from the MSKCC 2010 data set. (G) Hsp10 transcript reads in PTs compared to MN counterparts from the MSKCC 2010 data set. (H) ClpP transcript reads in PTs compared to MN counterparts from the MSKCC 2010 data set. (I) Representative IHC images from PCa TMA stained with H&E and for HSP60 or ClpP. Scale bars: 500 μm (rows 1 and 3) and 200 μm (rows 2 and 4). (J) Anti-ClpP and -HSP60 IHC images were scored and quantified. (K) Protein expression of HSP60, HSP10, and ClpP in nonmalignant normal prostate cell lines (RWPE1 and HPN-5) and various PCa cell lines. GAPDH serves as a loading control. P values were calculated by 2-tailed Student’s t test (AH and J).
Figure 5
Figure 5. Ablating key UPRmt components inhibits PCa development and growth in vivo.
(A and B) Parental DU145 and Hsp60+/– DU145 cells were transplanted into SCID mice. Xenograft tumors were harvested and photographed (A) and weighed, with the results presented in grams (B). (C) Whole-cell lysates (WCLs) from parental and Hsp60+/– DU145 xenografts were analyzed for HSP60 and ClpP by Western blotting. (D) Hsp60- or ClpP-silenced PC-3 cells were transplanted into SCID mice. Xenografts were harvested and photographed. (E) Hsp60- or ClpP-silenced PC-3 cells were transplanted into SCID mice. Tumor size was checked every 4 days and is represented as tumor volume (mm3). (F) HSP60 and ClpP silencing efficiency in PC-3 cell xenografts was determined using Western blotting. T, tumor. (G) WT, PB-Cre4 Hsp60fl/fl, TKO, TKO Hsp60fl/+, and TKO Hsp60fl/fl prostate tissue and tumors were harvested at 16 weeks of age and the whole genitourinary (GU) tract was weighed and is presented in grams. (H) WT, PB-Cre4 Hsp60fl/fl, TKO, TKO Hsp60fl/+, and TKO Hsp60fl/fl prostates were imaged by MRI and outlined as indicated (green, normal seminal vesicle [SV]; red, normal prostate; magenta, urethra; yellow, prostate tumor; blue, SV tumor). Mouse prostate tissue and tumors were harvested at 16 weeks and representative H&E-stained images are shown. Scale bar: 100 μm. (I and J) WT, PB-Cre4 Hsp60fl/fl, TKO, TKO Hsp60fl/+, and TKO Hsp60fl/fl prostate tissue and tumors were harvested at 16 weeks of age and WCLs were prepared and analyzed for HSP60 and ClpP (I) and c-Myc and EZH2 (J) by Western blotting. (K) ATP levels and (L) ATP/ADP ratio were analyzed in WT, TKO, TKO Hsp60fl/+, and TKO Hsp60fl/fl prostate tissue, represented as fold change compared to WT tissue. Data are mean ± SD (n ≥ 3). *P < 0.05 by 1-way ANOVA followed by Dunnett’s multiple-comparison test (B and E). *P < 0.05; #P < 0.05 by 1-way ANOVA followed by Tukey’s multiple-comparison test (G, K, and L). Actin serves as a loading control.
Figure 6
Figure 6. The UPRmt inhibitor DCEM1 disrupts HSP60-ClpP interaction in PCa cells and in vitro.
(A) Docking of DCEM1 into apical domain of HSP60. (B) PC-3 cells were treated with DCEM1 for 1 hour and cellular thermal shift assay (CETSA) was performed for HSP60 protein. Long exposure (LE) and short exposure (SE) of HSP60 are shown. Actin serves as a loading control. (C) Western blot analysis of endogenous HSP60 and ClpP protein after biotin-DCEM1 pull-down in PC-3 cell lysates. (D) LNCaP and PC-3 cells were treated with DCEM1 for 24 hours and HSP60-ClpP interaction was analyzed by co-IP assay. Ms IgG, mouse control IgG. (E) PLA between HSP60 and ClpP was performed in DCEM1-treated PC-3 cells. Scale bars: 50 μm. (F) Purified HSP60 protein was dot blotted onto a nitrocellulose membrane and far-Western blotting with ClpP protein with or without DCEM1 (20 μM) was performed. (G) Purified ClpP protein was dot blotted onto a nitrocellulose membrane and far-Western blotting with HSP60 protein with or without DCEM1 (20 μM) was performed. (H) In vitro co-IP with purified HSP60 and ClpP proteins with or without DCEM1 (20 μM) was performed using either anti-HSP60 or -ClpP antibody. (I) LNCaP cells were treated with DCEM1 (20 μM) for 24 hours and HSP60 IP was performed. Samples were analyzed for HSP60, ClpP, and HSP10 by Western blotting.
Figure 7
Figure 7. DCEM1 induces proteostatic stress and cell death in PCa cells.
(A) LNCaP and PC-3 cells were treated with DCEM1 for 24 hours, and poly-Ub protein levels were analyzed by Western blotting. (B) LNCaP and PC-3 cells were treated with DCEM1 for 24 hours, and mitoROS levels were analyzed by flow cytometry using mitoSOX dye and are represented as fold change compared to control. (C) LNCaP and PC-3 cells were treated with either DCEM1 or H2O2 (200 μM) for 24 hours, and total DNA was isolated and analyzed for mtDNA damage. (D) LNCaP cells were treated with DCEM1 for 24 and 48 hours, and apoptotic cell populations were analyzed using annexin V–FITC/PI. (E) PC-3 cells were treated with DCEM1 for 24 and 48 hours, and apoptotic cell populations were analyzed using annexin V–FITC/PI. (F) 22RV1 cells were treated with DCEM1 for 24 and 48 hours, and apoptotic cell populations were analyzed using annexin V–FITC/PI. (G) DU145 cells were treated with DCEM1 for 24 and 48 hours, and apoptotic cell populations were analyzed using annexin V–FITC/PI. (H) LNCaP and PC-3 cells were pretreated with SQM1 (750 nM) followed by DCEM1 (10 μM) treatment, and analyzed for cell viability by MTT assay and are represented as fold change compared to control. (I) LNCaP, PC-3, and 22RV1 cells were treated with DCEM1 and analyzed for c-Myc and EZH2 protein expression after 24 hours of treatment. (J) LNCaP, 22RV1, and VCaP cells were treated with DCEM1 and analyzed for AR and PSA protein expression after 24 hours of treatment. Data are mean ± SD (n ≥ 3). *P < 0.05 compared to respective control by 1-way ANOVA followed by Dunnett’s multiple-comparison test (B and DG) or 1-way ANOVA followed by Tukey’s multiple-comparison test (H). Actin serves as a loading control.
Figure 8
Figure 8. DCEM1 induces metabolic stress in PCa cells.
(A) LNCaP and PC-3 cells were pretreated with either rotenone (1 μM) or antimycin A (10 μM) followed by DCEM1 (10 μM) treatment, and mitochondrial ROS (mitoROS) were analyzed and are represented as fold change compared to control. (B) ClpP protein was overexpressed in LNCaP and PC-3 cells followed by DCEM1 treatment (10 μM), and mitoROS were analyzed and are represented as fold change compared to control. (C) ClpP protein was overexpressed in LNCaP and PC-3 cells followed by DCEM1 treatment (10 μM), and the level of poly-Ub protein was analyzed by Western blotting. (D) ClpP protein was overexpressed in LNCaP and PC-3 cells followed by DCEM1 treatment (10 μM), and DEVDase activity was analyzed and is represented as fold change compared to control. (E) Mitochondrial membrane potential (mitoMP) was analyzed in LNCaP and PC-3 cells treated with DCEM1 and is represented as fold change compared to control. (F) ATP level was analyzed in LNCaP and PC-3 cells treated with DCEM1 and is represented as fold change compared to control. (G) Protein expression levels of OXPHOS subunits were analyzed in PC-3 cells treated with DCEM1. (H) Oxygen consumption rate (OCR) was analyzed in PC-3 cells treated with DCEM1 and is represented as basal and maximal respiration rate, spare respiratory capacity, and ATP production potential. (I and J) AMPK (I) and mTOR (J) signaling pathways were analyzed in LNCaP and PC-3 cells treated with DCEM1. Data are mean ± SD (n ≥ 3). *P < 0.05 by 1-way ANOVA followed by Dunnett’s multiple-comparison test (A, E, F, and H). *P < 0.05, #P < 0.05 compared to DCEM1-treated Empty Vector (EV) groups by 1-way ANOVA followed by Tukey’s multiple-comparison test (B and D). Actin serves as a loading control.
Figure 9
Figure 9. DCEM1 inhibits oncogenic signaling and PCa tumor growth in vivo.
(A and B) 22RV1 cell xenografts were established in each flank of SCID mice and treated with DCEM1 (60 mg/kg body weight, i.p.) twice weekly. Tumors were harvested, photographed (A), and weighed (B) at 30 days, and results are presented in grams. (C) DEVDase activity was analyzed in 22RV1 xenograft tumor tissues following DCEM1 treatment and is represented as fold change compared to vehicle control. (D) 22RV1 xenograft tissues were sectioned and expression of Ki67, c-Myc, EZH2, and AR proteins was analyzed by immunohistochemistry. Scale bar: 50 μm. (E and F) PC-3 cell xenografts were established in each flank of SCID mice and treated with DCEM1 (60 mg/kg body weight, i.p.) twice weekly. Tumors were harvested, photographed (E), and weighed (F) at 35 days and results are presented in grams. (G) DEVDase activity was analyzed in PC-3 xenograft tumor tissue following DCEM1 treatment and is represented as fold change compared to control. (H) PC-3 xenograft tumor tissues were fixed and sections were used for in situ PLA to analyze HSP60-ClpP interactions in tumor tissue samples. Original magnification, x40. (IL) TKO animals were treated with either vehicle or DCEM1 (60 mg/kg body weight) twice weekly from 10 weeks of age. Animals were sacrificed at 16 weeks of age and the whole genitourinary tract was harvested and weighed (I). Animals were imaged by MRI at 16 weeks of age and sacrificed. Prostate tissues and tumors were harvested, and representative H&E-stained images are shown (J). Scale bar 100 μm. Whole-tissue lysates from vehicle- or DCEM1-treated (60 mg/kg body weight) TKO tumor tissues were prepared and analyzed for HSP60 and ClpP expression (K) and c-Myc and EZH2 expression (L) by Western blotting. Data are mean ± SD. *P < 0.05, by 2-tailed Student’s t test (B, C, and FI). Actin serves as loading control.
Figure 10
Figure 10. A brief overview of HSP60-ClpP–mediated UPRmt in PCa cell survival and prostate tumor growth.
(A) HSP60 transcriptionally regulates ClpP expression via c-Myc. Two arms of mitochondrial proteostasis, mitochondrial protein folding (e.g., HSP60) and mitochondrial protease degradation (e.g., ClpP) machineries, interact and cooperate to maintain proteostasis and mitochondrial functions that lead to PCa cell survival and tumor growth. (B) Disruption of HSP60-ClpP interactions by UPRmt inhibitor (i.e., DCEM1) deregulates mitochondrial proteostasis, mitochondrial bioenergetics, and mitohormesis, leading to PCa cell death and blockade of prostate tumor growth. Reproduced with permission from Roswell Park Comprehensive Care Center.

References

    1. Carrasco DR, et al. The differentiation and stress responsefactor XBP-1 drives multiple myeloma pathogenesis. Cancer Cell. 2007;11(4):349–360. doi: 10.1016/j.ccr.2007.02.015. - DOI - PMC - PubMed
    1. Oakes SA. Endoplasmic reticulum proteostasis: a key checkpoint in cancer. Am J Physiol Cell Physiol. 2017;312(2):C93–C102. doi: 10.1152/ajpcell.00266.2016. - DOI - PMC - PubMed
    1. Kenny TC, et al. Mitohormesis primes tumor invasion and metastasis. Cell Rep. 2019;27(8):2292–2303. doi: 10.1016/j.celrep.2019.04.095. - DOI - PMC - PubMed
    1. Karagoz GE, et al. The unfolded protein response: detecting and responding to fluctuations in the protein-folding capacity of the endoplasmic reticulum. Cold Spring Harb Perspect Biol. 2019;11(9):a033886. doi: 10.1101/cshperspect.a033886. - DOI - PMC - PubMed
    1. Jin Y, Saatcioglu F. Targeting the unfolded protein response in hormone-regulated cancers. Trends Cancer. 2020;6(2):160–171. doi: 10.1016/j.trecan.2019.12.001. - DOI - PubMed

Publication types