. 2022 Aug 1;33(9):br15.
doi: 10.1091/mbc.E21-06-0283. Epub 2022 Jun 2.

Tip60 acetylation of histone H3K4 temporally controls chromosome passenger complex localization

Affiliations

Tip60 acetylation of histone H3K4 temporally controls chromosome passenger complex localization

Ewa Niedzialkowska et al. Mol Biol Cell. .

Abstract

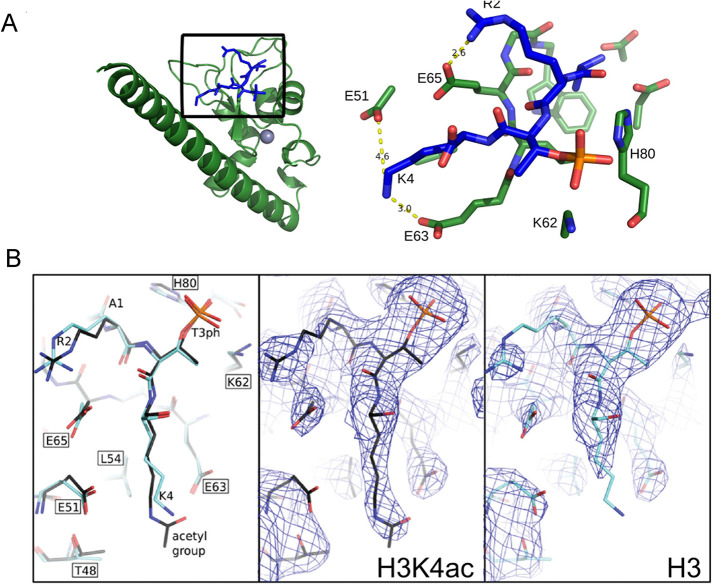
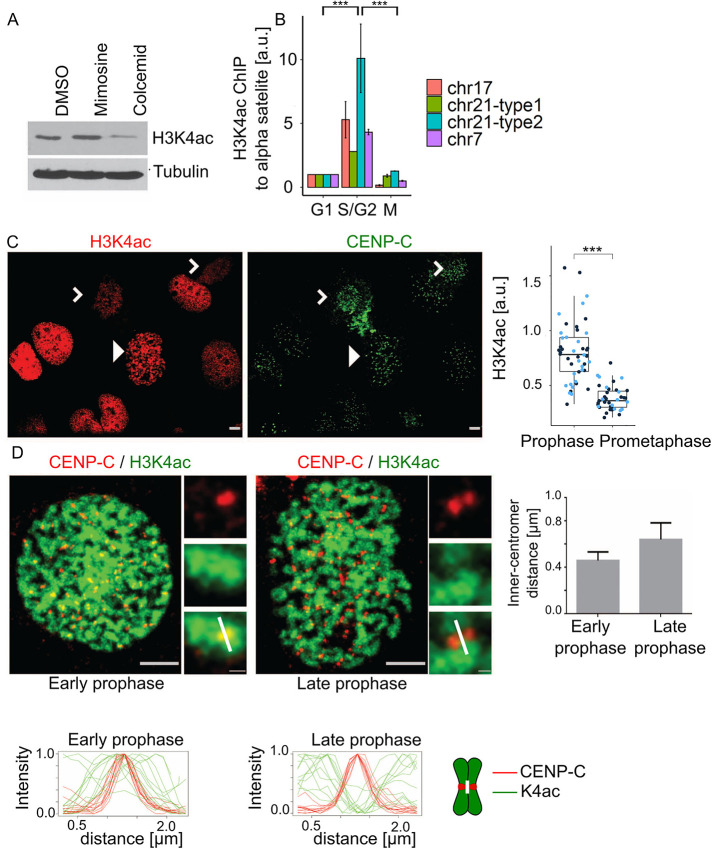
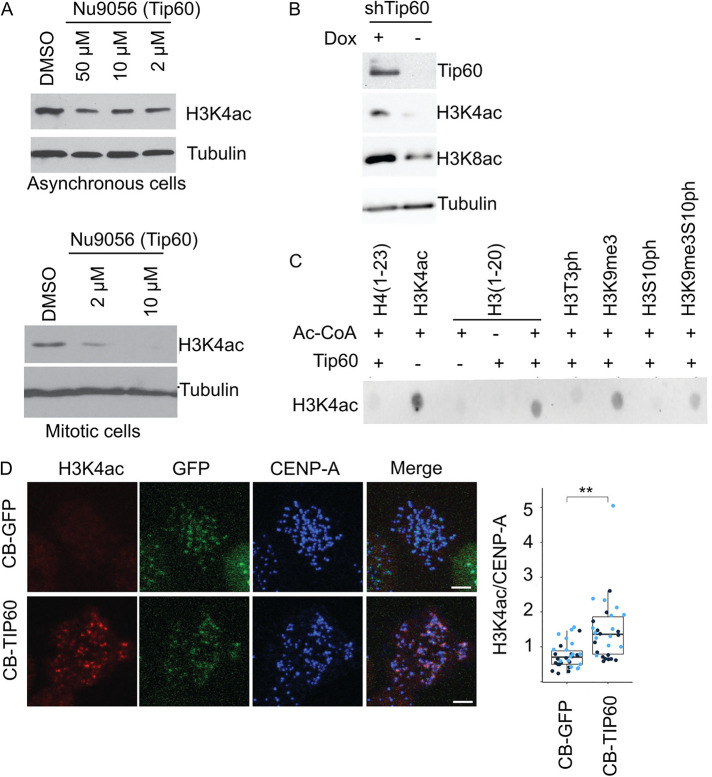
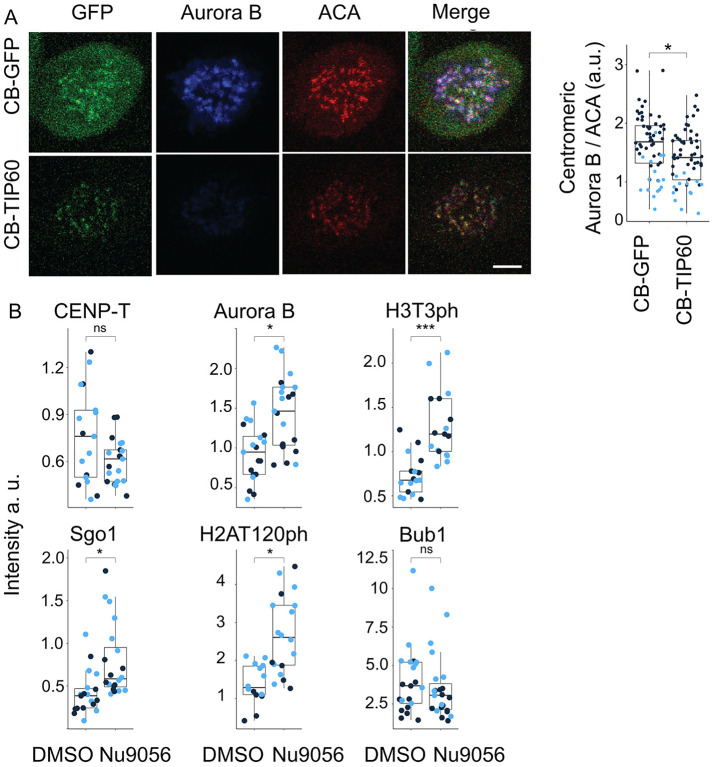
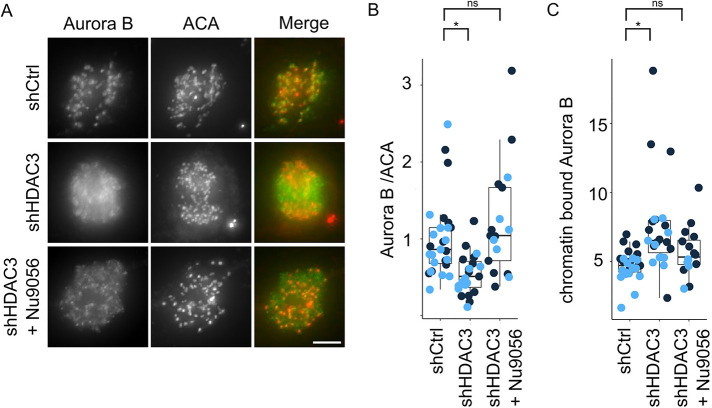
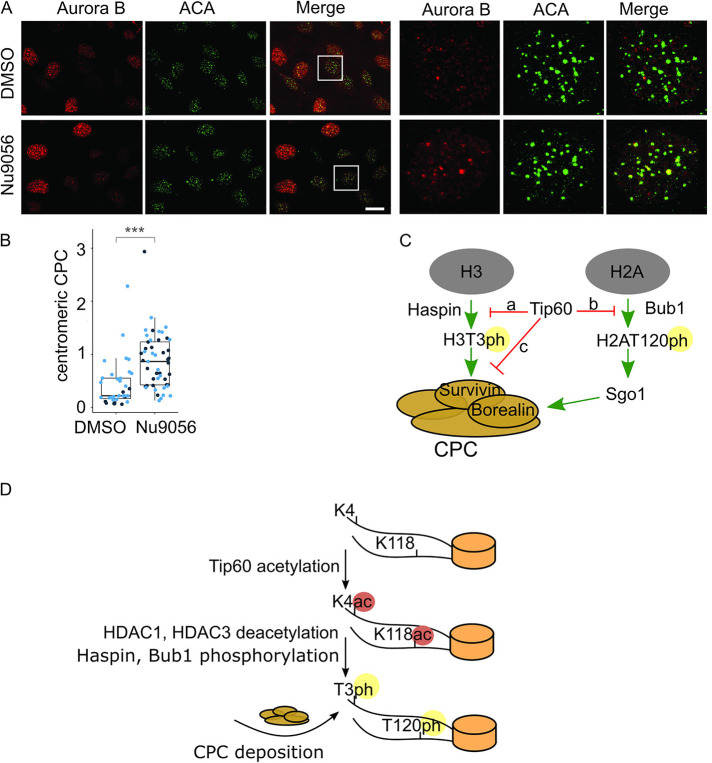
The Chromosome Passenger Complex (CPC) generates chromosome autonomous signals that regulate mitotic events critical for genome stability. Tip60 is a lysine acetyltransferase that is a tumor suppressor and is targeted for proteasomal degradation by oncogenic papilloma viruses. Mitotic regulation requires the localization of the CPC to inner centromeres, which is driven by the Haspin kinase phosphorylating histone H3 on threonine 3 (H3T3ph). Here we describe how Tip60 acetylates histone H3 at lysine 4 (H3K4ac) to block both the H3T3ph writer and the reader to ensure that this mitotic signaling cannot begin before prophase. Specifically, H3K4ac inhibits Haspin phosphorylation of H3T3 and prevents binding of the Survivin subunit to H3T3ph. Tip60 acetylates H3K4 during S/G2 at centromeres. Inhibition of Tip60 allows the CPC to bind centromeres in G2 cells, and targeting of Tip60 to centromeres prevents CPC localization in mitosis. The H3K4ac mark is removed in prophase by HDAC3 to initiate the CPC localization cascade. Together, our results suggest that Tip60 and HDAC3 temporally control H3K4 acetylation to precisely time the targeting of the CPC to inner centromeres.


Figures

FIGURE 1:
FIGURE 1:
Histone H3K4ac disrupts salt bridges between H3K4 and Survivin E51 and E63. (A) Structure of human Survivin (green) bound to the unacetylated histone H3 peptide (blue). Gray sphere represents zinc atom. Inset shows amino acids involved in interaction between the H3 peptide and the Survivin to highlight the binding interface between Survivin and the histone H3T3phK4 peptide; yellow dashed lines indicate formation of salt bridges between histone H3 lysine 4 side chain and Survivin glutamic acids E51 and E63. Survivin carbon, nitrogen, and oxygen atoms are shown as green, blue, and light red sticks, respectively. Histone atoms are shown in blue; phosphorous and oxygen atoms of phosphorylated T3 are colored orange and red, respectively. (B) Comparison of Survivin bound histone H3 peptide with and without K4 acetylation. Left, stick representation showing unacetylated (light blue) and acetylated (dark blue) peptides; center and right, electron density in the vicinity of Survivin histone H3 peptide binding site with the view on unmodified and acetylated lysine 4. The density around δ and ε carbon of lysine 4 is absent because unmodified K4 side chain can adopt many conformations including salt bridge formation between E51 or E63; therefore it appears disordered in the model. After K4 acetylation there are less possible conformations that can be adopted by acetylated K4 side chain due to steric effects; therefore lysine side chain appears ordered in the model. Map is contoured at 1 sigma.
FIGURE 2:
FIGURE 2:
Histone H3K4 is acetylated from S/G2 until midprophase during cell cycle progression. (A) Histone H3 K4ac level in lysates of U2OS either not synchronized (DMSO), arrested in G1/S with mimosine, or in mitosis with colcemid. (B) ChIP analysis where chromatin was immunoprecipitated with histone H3K4ac antibodies and probed by real-time PCR with primers that recognize four unique α-satellite sequences on the specified chromosomes. Note the increase in K4 acetylation signal in S/G2 (G2) relative to G1 and M phase. Experiment was performed twice. For statistical analysis an Anova test was applied; p value = 1.1⋅10–5; Tukey test was performed for pairwise comparisons; ***P < 0.001. (C) Immunofluorescence analysis of histone H3K4ac shows high level of H3K4ac in prophase cells (white arrowhead) n = (25, 14) but reduced H3K4ac signal during prometaphase (white carets) n = (25, 14); p value1 = (4.488⋅10–7, 2.564⋅10–5). For statistical analysis Welch’s t test was applied; ***P < 0.001. Red cells stained with anti-H3K4ac; green cells stained with anti-CENP-C; scale bar, 3 µm. The two blue-colored dots in the quantification represent the two experimental replicates. (D) The histone H3K4ac mark is removed from centromeres in midprophase. Images of an example of early and late prophase cells that were defined by the distance of CENP-C foci (plot on the right); the white mark in the merged inset shows a typical line portrayed in the intensity profiles in graphs below; scale bar, 3 µm; inset bar, 0.3 µm. Line graphs below images represent the fluorescent intensities of a 2.5-µm line drawn perpendicular to the axis of sister kinetochores are tiled for cells in either early or late prophase. Line graphs were normalized between 0 and 1, and the CENP-C peaks were centered; CENP-C (red, n = 12) and histone H3K4 (green, n = 12). A white line on the chromosome scheme next to line graphs highlights the region taken for analysis. There was enough CENP-C in inner centromere regions in late prophase chromosomes to define a central peak.
FIGURE 3:
FIGURE 3:
KAT5/Tip60 (Tip60) is the major histone acetyltransferase (HAT) for H3K4 in U2OS cells. (A) Histone H3 K4 acetylation detected by anti-H3K4ac immunoblot analysis from asynchronous and mitotic U2OS cells treated with Nu9056 inhibitor of Tip60’s acetyltransferase activity. Bottom cells arrested in nocodazole were treated with Nu9056 for 1 h. (B) Tip60 shRNA depleted cells show reduced level of histone H3K4ac. Cells were engineered to express an shRNA against Tip60 after addition of doxycyclin (Dox). (C) In vitro Tip60 HAT activity on histone H3 peptides was detected using histone H3K4ac immunoblot; 1 µg of each peptide was incubated with the specified reagents and then transferred to a membrane for immunodetection. (D) Targeting of Tip60 to centromeres increases histone H3K4ac to that region of mitotic chromosomes. Cells were engineered to express either CENP-B:GFP (CB-GFP) or CENP-B:GFP:Tip60 (CB-Tip60) after the addition of doxycyclin. Cells in doxycycline were stained for the indicated antibodies and mitotic cells were imaged by immunofluorescence. Dark and light blue dots in the plot represent independent experimental replicates. CB-GFP n = (11, 23); CB-Tip60 n = (16, 14) p value = (0.004; 0.005). For statistical analysis Welch’s t test was applied; **P < 0.01.
FIGURE 4:
FIGURE 4:
Targeting of Tip60 to centromeres dysregulates the localization of the Aurora B and other proteins of the Centromere Signaling Network (CSN). (A) Aurora B at centromeres is reduced when Tip60 is targeted to centromeres. Cells were arrested in mitosis with nocodazole and stained for the indicated antibody. CB-GFP n = (44, 16); CB-Tip60 n = (43, 13); p value = (0.0015; 0.033); scale bar, 5 µm. (B) Tip60 targeting affects many kinetochore/inner centromere events in an acetyltransferase dependent manner. Cells expressing CB-Tip60 were treated with either DMSO or the Tip60 acetyltransferase inhibitor Nu9056, and the localization of the indicated protein or PTM were imaged by immunofluorescence. Light and dark blue dots indicate two independent experimental replicates. Quantification of fluorescence signal of Aurora B nDMSO = (10, 9), nNU9056 = (11, 10), p value = (0.01, 0.0034); Sgo1 nDMSO = (10, 10), nNU9056 = (9, 11), p value = (0.049, 0.042); CENP-T nDMSO = (6, 11), nNU9056 = (10, 11), p value = (0.486, 0.051); Bub1 nDMSO = (11, 10), nNU9056 = (12, 11); p value = (0.4184, 0.6519); histone H3T3ph nDMSO = (8, 9), nNU9056 = (7, 9); p value (0.0018, 0.0025) and histone H2AT120ph nDMSO = (5, 9), nNU9056 = (6, 11) p value = (0.029, 0.0017) at centromeres in cells with Tip60 targeted to centromeres by CENP-B fusion and treated with Nu9016. For statistical analysis Welch’s t test was applied. ***P < 0.001, **P < 0.01, *P < 0.05, and ns P > 0.05.
FIGURE 5:
FIGURE 5:
The histone deacetylase HDAC3 activity opposes Tip60 activity to relocalize Aurora B from chromatin to inner centromeres. Cells treated to reduce HDAC3 by shRNA had reduced amounts of Aurora B but this was rescued by concurrent inhibition of Tip60 acetyltransferase activity. (A) Immunofluorescence images showing Aurora B inner centromeric localization in prometaphase cells treated with shHDAC3 knockdown with and without Tip60 inhibition. Note that most of the Aurora B remains on noninner centromeric (chromosome arm) regions after HDAC3 depletion. However, if Tip60 was inhibited in the previous S/G2 phase then HDAC3 is not required to localize Aurora B to inner centromeres; scale bar, 5 µm. (B) Quantification of Aurora B signal at centromeres after the indicated treatment: shCtrl n = (11, 13); shHDAC3 n = (13, 10); shHDAC3+Nu9056 n = (11, 5); p valueshCtrl-shHDAC3 = (0.0211, 0.0046); p valueshCtrl-shHDAC3+Nu9056 (0.49, 0.63). (C) Quantification of chromatin bound Aurora B signal after the centromeric signals have been subtracted to measure the amount of Aurora B on chromosome arms after the indicated treatments. shCtrl n = (11, 13); shHDAC3 n = (13, 10); shHDAC3+Nu9056 n = (11, 5); p valueshCtrl-shHDAC3 = (0.02678, 0.00065); p valueshCtrl-shHDAC3+Nu9056 (0.25, 0.41). For statistical analysis Welch’s t test was applied; ns > 0.05, *P < 0.05. Light and dark blue dots indicate two independent experimental replicates.
FIGURE 6:
FIGURE 6:
Inhibition of Tip60 promotes premature centromeric targeting of Aurora B in interphase cells. (A) Inhibition of Tip60 by Nu9056 leads to Aurora B localization at centromeres in interphase (S/G2) cells as shown by immunofluorescence; scale bar, 20 µm. (B) Quantification of S/G2 centromeric fluorescence signals for Aurora B in control cells (n = 9, 26) and in Tip60-inhibited cells (n = 26, 23) p value (2.833⋅10–7, 8.152⋅10–5). Aurora B signal that overlaps with an ACA mask was quantified in S/G2 cells as defined by Aurora B signal. G1 cells have low Aurora B signal since Aurora B is an APC substrate. For statistical analysis Welch’s t test was applied. ***P < 0.001. (C) A proposed model for Aurora B localization regulated by acetylation of H3K4 of H3 by Tip60. Our data suggest that histone H3K4ac by Tip60 during S/G2 prevents Haspin phosphorylation of H3T3 (arrow a) and Survivin binding to chromatin to inhibit CPC localization to centromeres (arrow c). During the middle of prophase HDAC3 removes H3K4ac mark to enable CPC accumulation at inner centromeres. Previous studies have shown that Tip60 inhibits Bub1 binding to H2AT120 (arrow b) (Lee et al., 2018) and together with our work it suggests that Tip60 is a master regulator of CPC localization. (D) A model to control the timing of CPC localization to inner centromeres through changes in chromatin PTMs. Tip60 acetylates histone H3 on K4 and histone H2A on K118 in S/G2 to prevent CPC localization. In midprophase HDAC1 and HDAC3 deacetylate these histone marks to enable Bub1 phosphorylation and subsequent Sgo1 recruitment, Haspin phosphorylation of histone H3T3 and subsequent Survivin binding of H3T3ph. Together these events drive CPC recruitment to inner centromeres in midprophase.

Similar articles

Cited by

References

    1. Ayrapetov MK, Gursoy-Yuzugullu O, Xu C, Xu Y, Price BD (2014). DNA double-strand breaks promote methylation of histone H3 on lysine 9 and transient formation of repressive chromatin. Proc Natl Acad Sci USA 111, 9169–9174. - PMC - PubMed
    1. Broad AJ, DeLuca KF, DeLuca JG (2020). Aurora B kinase is recruited to multiple discrete kinetochore and centromere regions in human cells. J Cell Biol 219, e201905144. - PMC - PubMed
    1. Carmena M, Pinson X, Platani M, Salloum Z, Xu Z, Clark A, Macisaac F, Ogawa H, Eggert U, Glover DM, et al. (2012). The chromosomal passenger complex activates Polo kinase at centromeres. PLoS Biol 10, e1001250. - PMC - PubMed
    1. Chen VB, Arendall WB, 3rd, Headd JJ, Keedy DA, Immormino RM, Kapral GJ, Murray LW, Richardson JS, Richardson DC (2010). MolProbity: all-atom structure validation for macromolecular crystallography. Acta Crystallogr D Biol Crystallogr 66, 12–21. - PMC - PubMed
    1. Cooke CA, Heck MM, Earnshaw WC (1987). The inner centromere protein (INCENP) antigens: movement from inner centromere to midbody during mitosis. J Cell Biol 105, 2053–2067. - PMC - PubMed

Publication types

LinkOut - more resources