. 2022 Jan;19(1):774-780.
doi: 10.1080/15476286.2022.2078093.

Sensitive and accurate analysis of gene expression signatures enabled by oligonucleotide-labelled cDNA

Affiliations

Sensitive and accurate analysis of gene expression signatures enabled by oligonucleotide-labelled cDNA

Žana Kapustina et al. RNA Biol. 2022 Jan.

Abstract

High-throughput RNA sequencing offers a comprehensive analysis of transcriptome complexity originated from regulatory events, such as differential gene expression, alternative polyadenylation and others, and allows the increase in diagnostic capacity and precision. For gene expression profiling applications that do not specifically require information on alternative splicing events, the mRNA 3' termini counting approach is a cost-effective alternative to whole transcriptome sequencing. Here, we report MTAS-seq (mRNA sequencing via terminator-assisted synthesis) - a novel RNA-seq library preparation method directed towards mRNA 3' termini. We demonstrate the specific enrichment for 3'-terminal regions by simple and quick single-tube protocol with built-in molecular barcoding to enable accurate estimation of transcript abundance. To achieve that, we synthesized oligonucleotide-modified dideoxynucleotides which enable the generation of cDNA libraries at the reverse transcription step. We validated the performance of MTAS-seq on well-characterized reference bulk RNA and further tested it with eukaryotic cell lysates.

Keywords: 3’-end sequencing; RNA-seq; gene expression profiling; library preparation; modified nucleotides; transcriptomics.


Conflict of interest statement

The authors declare the following competing interests: all authors are employees of Thermo Fisher Scientific Baltics. A patent covering oligonucleotide-tethered nucleotides and their uses is pending, Ž.K., J.M., S.Ž. and A.L. are among the inventors.

Figures
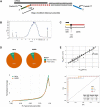
Figure 1.
Figure 1.
Overview of MTAS-seq technique. (A) Reverse transcription starts from an oligo (dT) primer containing a portion of the Illumina P7 adapter sequence. Primer extension terminates upon the incorporation of oligonucleotide-modified dideoxynucleotide bearing a portion of the Illumina P5 adapter sequence. This yields cDNA fragments which can be PCR-amplified using standard Illumina indexing primers. (B) A typical MTAS-seq library trace. (C) The structure of sequencing reads is as follows: 8 nt UMI sequence followed by a nucleotide complementary to the incorporated terminator (two or more bases are expected to appear at the indicated position if a mixture of OTDDNs with different nucleobases is used at the reverse transcription step) and a portion of 3′ UTR. (D) RNA species captured in MTAS-seq libraries prepared from well-characterized RNA and typical gene body coverage. Note that apart from non-mRNA transcript species, such as lincRNAs, ‘Other’ category includes ERCC RNA Spike-Ins which were captured via their polyA tails. (E) The correlation coefficient (R2) of detected ERCC counts versus expected in MTAS-seq library prepared from 500 ng of UHRR with ~2% of ERCC mix was 0.93, with 55 different ERCCs detected. ROC curves indicate erccdashboard analysis to assess the performance of differential expression estimation. TPR – true positive rate, FPR – false positive rate.
Figure 2.
Figure 2.
Gene expression profiling in HEK-293 total RNA and crude cell lysates. (A) Average numbers of detected genes in MTAS-seq libraries prepared from different amounts of RNA and cells. Error bars represent the standard error of the mean (SEM). (B) Venn diagrams depict the overlap of detected genes at a uniform read depth. Red circles correspond to crude lysate samples, while yellow circles correspond to bulk RNA samples. (C) Correlation of gene counts of corresponding RNA and lysate samples. I – 120 ng RNA or 10,000 cells, II – 12 ng RNA or 1,000 cells, III – 6 ng RNA or 500 cells, IV – 1.2 ng RNA or 100 cells, V – 0.12 ng RNA or 10 cells.

References

    1. Sharp PA. The centrality of RNA. Cell. 2009;136(4):577–580. - PubMed
    1. Manning KS, Cooper TA. The roles of RNA processing in translating genotype to phenotype. Nat Rev Mol Cell Biol. 2017;18(2):102–114. - PMC - PubMed
    1. Wang ET, Sandberg R, Luo S, et al. Alternative isoform regulation in human tissue transcriptomes. Nature. 2008;456(7221):470–476. - PMC - PubMed
    1. Wang Z, Gerstein M, Snyder M. RNA-Seq: a revolutionary tool for transcriptomics. Nat Rev Genet. 2009;10(1):57–63. - PMC - PubMed
    1. Licatalosi DD, Darnell RB. RNA processing and its regulation: global insights into biological networks. Nat Rev Genet. 2010;11(1):75–87. - PMC - PubMed

Publication types

MeSH terms