

Using genetic variation to disentangle the complex relationship between food intake and health outcomes
- PMID: 35653391
- PMCID: PMC9162356
- DOI: 10.1371/journal.pgen.1010162
Using genetic variation to disentangle the complex relationship between food intake and health outcomes
Abstract
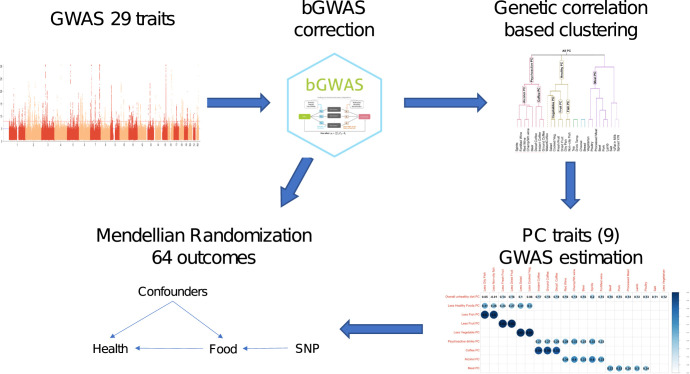
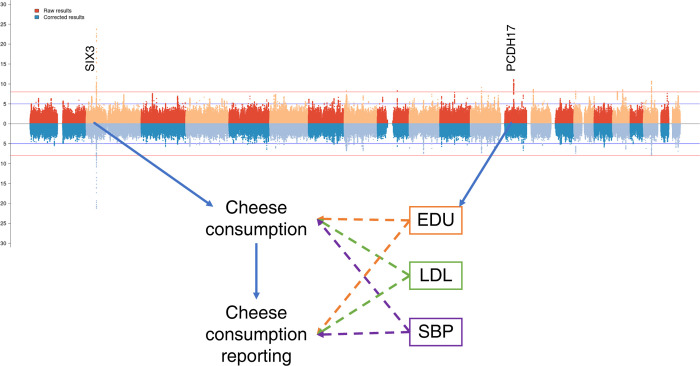
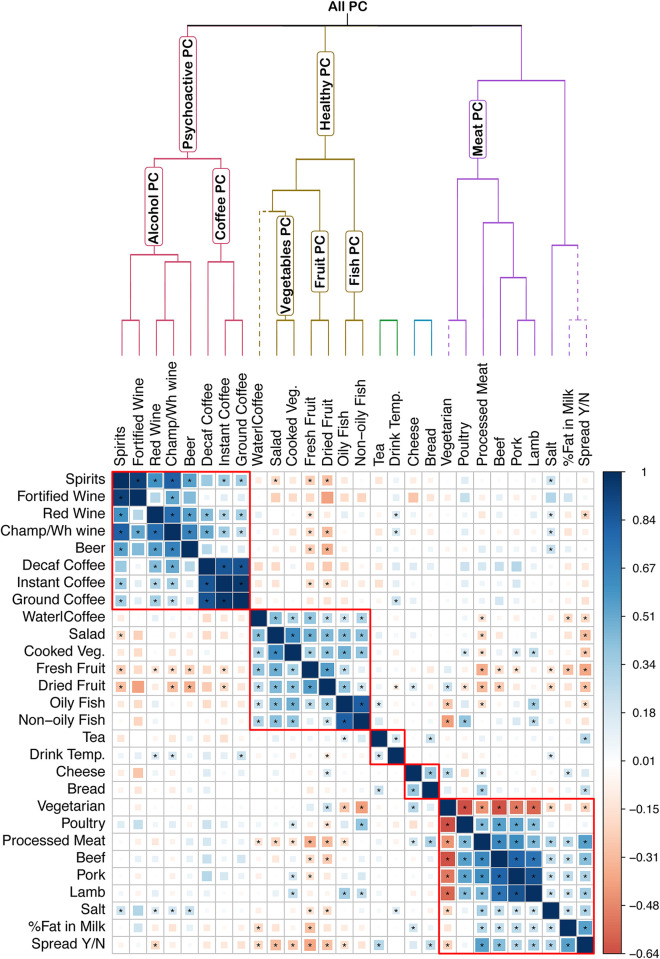
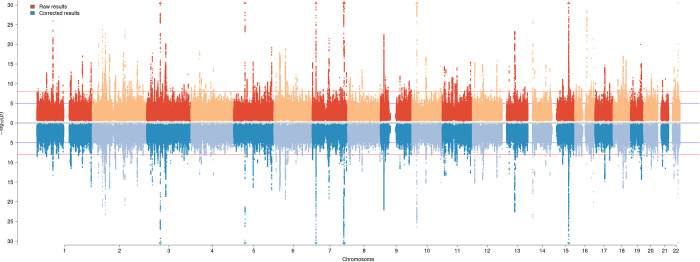
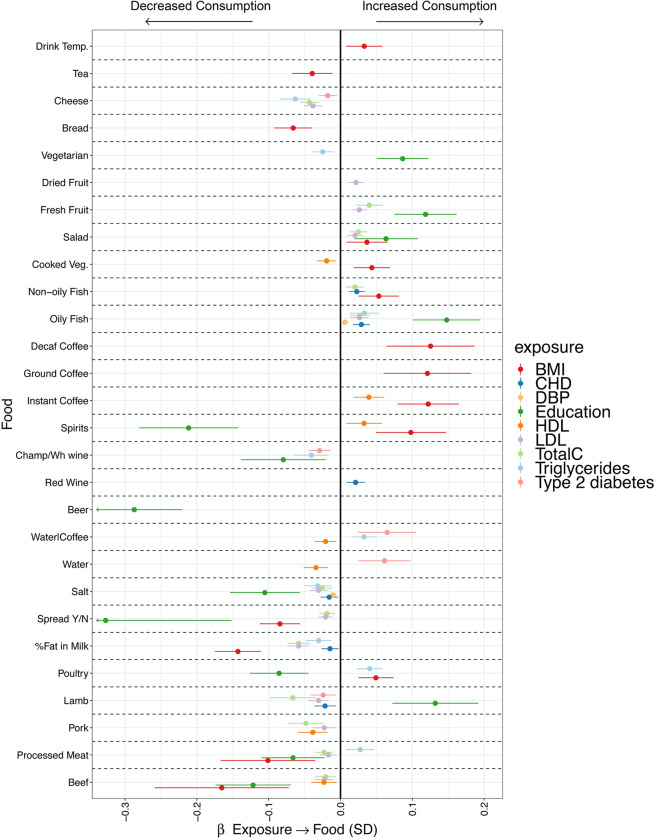
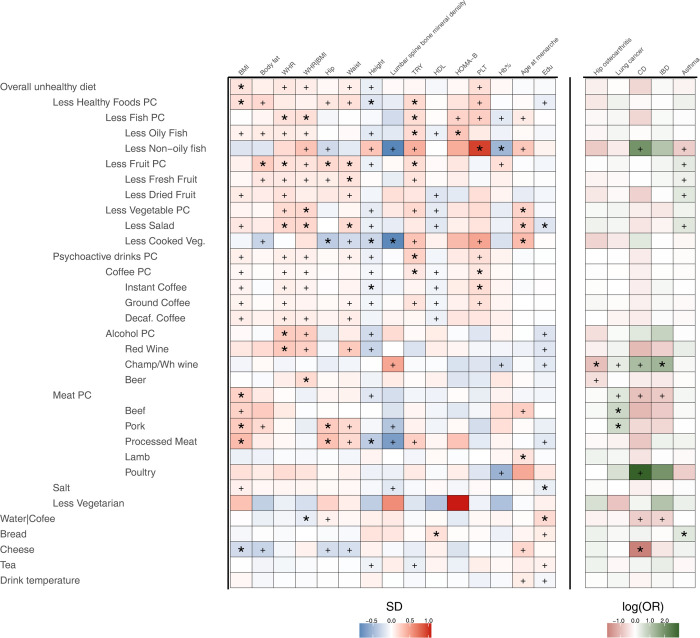
Diet is considered as one of the most important modifiable factors influencing human health, but efforts to identify foods or dietary patterns associated with health outcomes often suffer from biases, confounding, and reverse causation. Applying Mendelian randomization in this context may provide evidence to strengthen causality in nutrition research. To this end, we first identified 283 genetic markers associated with dietary intake in 445,779 UK Biobank participants. We then converted these associations into direct genetic effects on food exposures by adjusting them for effects mediated via other traits. The SNPs which did not show evidence of mediation were then used for MR, assessing the association between genetically predicted food choices and other risk factors, health outcomes. We show that using all associated SNPs without omitting those which show evidence of mediation, leads to biases in downstream analyses (genetic correlations, causal inference), similar to those present in observational studies. However, MR analyses using SNPs which have only a direct effect on the exposure on food exposures provided unequivocal evidence of causal associations between specific eating patterns and obesity, blood lipid status, and several other risk factors and health outcomes.
Conflict of interest statement
I have read the journal’s policy and the authors of this manuscript have the following competing interests: Dr Joshi is a paid consultant to Global Gene Corp and Humanity Inc.
Figures
References
-
- Freedman LS, Commins JM, Willett W, Tinker LF, Spiegelman D, Rhodes D, et al. Evaluation of the 24-hour recall as a reference instrument for calibrating other self-report instruments in nutritional cohort studies: Evidence from the Validation Studies Pooling Project. Am J Epidemiol. 2017;186: 73–82. doi: 10.1093/aje/kwx039 - DOI - PMC - PubMed
Publication types
MeSH terms
Grants and funding
- P30 DK040561/DK/NIDDK NIH HHS/United States
- MC_UU_00006/3/MRC_/Medical Research Council/United Kingdom
- 074548/WT_/Wellcome Trust/United Kingdom
- MC_UU_00011/4/MRC_/Medical Research Council/United Kingdom
- MC_UU_12015/1/MRC_/Medical Research Council/United Kingdom
- MR/N003284/1/MRC_/Medical Research Council/United Kingdom
- MC_UU_12015/2/MRC_/Medical Research Council/United Kingdom
- 14136/CRUK_/Cancer Research UK/United Kingdom
- G0401527/MRC_/Medical Research Council/United Kingdom
- MCPC_13048/MRC_/Medical Research Council/United Kingdom
- MC_PC_17228/MRC_/Medical Research Council/United Kingdom
- MC_UU_00006/2/MRC_/Medical Research Council/United Kingdom
- MC_UU_00006/1/MRC_/Medical Research Council/United Kingdom
- MC_QA137853/MRC_/Medical Research Council/United Kingdom
- MC-UU_12015/1/MRC_/Medical Research Council/United Kingdom
- G1000143/MRC_/Medical Research Council/United Kingdom
- MC_UU_00007/10/MRC_/Medical Research Council/United Kingdom
- MC_UU_12015/5/MRC_/Medical Research Council/United Kingdom
- WT_/Wellcome Trust/United Kingdom
LinkOut - more resources
Full Text Sources
