. 2022 Jun 2;18(6):e1010020.
doi: 10.1371/journal.pgen.1010020. eCollection 2022 Jun.

Evolutionarily stable gene clusters shed light on the common grounds of pathogenicity in the Acinetobacter calcoaceticus-baumannii complex

Affiliations

Evolutionarily stable gene clusters shed light on the common grounds of pathogenicity in the Acinetobacter calcoaceticus-baumannii complex

Bardya Djahanschiri et al. PLoS Genet. .

Abstract

Nosocomial pathogens of the Acinetobacter calcoaceticus-baumannii (ACB) complex are a cautionary example for the world-wide spread of multi- and pan-drug resistant bacteria. Aiding the urgent demand for novel therapeutic targets, comparative genomics studies between pathogens and their apathogenic relatives shed light on the genetic basis of human-pathogen interaction. Yet, existing studies are limited in taxonomic scope, sensing of the phylogenetic signal, and resolution by largely analyzing genes independent of their organization in functional gene clusters. Here, we explored more than 3,000 Acinetobacter genomes in a phylogenomic framework integrating orthology-based phylogenetic profiling and microsynteny conservation analyses. We delineate gene clusters in the type strain A. baumannii ATCC 19606 whose evolutionary conservation indicates a functional integration of the subsumed genes. These evolutionarily stable gene clusters (ESGCs) reveal metabolic pathways, transcriptional regulators residing next to their targets but also tie together sub-clusters with distinct functions to form higher-order functional modules. We shortlisted 150 ESGCs that either co-emerged with the pathogenic ACB clade or are preferentially found therein. They provide a high-resolution picture of genetic and functional changes that coincide with the manifestation of the pathogenic phenotype in the ACB clade. Key innovations are the remodeling of the regulatory-effector cascade connecting LuxR/LuxI quorum sensing via an intermediate messenger to biofilm formation, the extension of micronutrient scavenging systems, and the increase of metabolic flexibility by exploiting carbon sources that are provided by the human host. We could show experimentally that only members of the ACB clade use kynurenine as a sole carbon and energy source, a substance produced by humans to fine-tune the antimicrobial innate immune response. In summary, this study provides a rich and unbiased set of novel testable hypotheses on how pathogenic Acinetobacter interact with and ultimately infect their human host. It is a comprehensive resource for future research into novel therapeutic strategies.


Conflict of interest statement

The authors have declared that no competing interests exist.

Figures
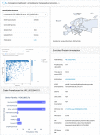
Fig 1
Fig 1. Aci-Dash–Interactive exploration of phylogenetic abundance patterns and accessory annotations for the Set-R pan-genome.
For each of the 232 strains, Aci-Dash provides further details about year and site of sampling. The map was generated with Plotly for Python with a basemap from Natural Earth (https://www.naturalearthdata.com). The interactive scatter plot reveals, for each gene of the selected strain, the abundance of orthologs in a user-defined in- and outgroup. For each gene individually, the ortholog abundance can be resolved on a clade level (cf. Fig 2), and further information including functional annotation transfer from KEGG and COG as well as known virulence factors is displayed.
Fig 2
Fig 2. The phylogeny of the genus Acinetobacter.
(A) Majority-rule consensus phylogeny of 232 Acinetobacter strains represented in SET-R. Solid branches are supported by all, and hatched branches by two out of three trees. A high-resolution image of this tree is provided in S2 Fig. (B) The maximum likelihood tree for all 3052 taxa in Set-F. Colored clades represent the same clades as in A). A high-resolution image of this tree is provided in S3 Fig. (C) The evolutionary backbone of the Acinetobacter genus with exemplary strains as clade representatives. The color scheme resembles that of Fig 2A. The pictograms next to the leaf labels indicate the sampling source of the particular strain. Red pictograms signal a strain that was isolated from an infected patient. The clipart used in this figure has been dedicated to the public domain (CCO 1.0 Universal) or was self-generated.
Fig 3
Fig 3. A phylogenetic stratification of the Acinetobacter pan-genome.
(A) Pie charts on the internal nodes indicate numbers of genes added (blue) or lost (yellow) from the respective pan-genome where the diameter is proportional to the sum of both gained and lost genes. Clades resemble those from Fig 2. (B) For each node, histograms represent the number of descending taxa an added gene is represented in. The minimum value is 2, the maximum value is the number of taxa subsumed in the corresponding clade.
Fig 4
Fig 4. Phylogenetic strata in the protein-coding gene set of Ab. ATCC 19606.
Each protein-coding gene was assigned to one of the nine layers specified in the inlay to the right (cf. Fig 3). All genes annotated with GO terms that were significantly enriched in the individual layers are colored in red. Genes assigned to orthologous groups which were ranked within the 10 percent groups with highest retention differences (RD > = 0.708, n = 355) across the ATCC 19606 gene set are colored in yellow. Red boxes highlight selected gene loci where neighboring genes contributed to the enrichment of the same GO term (biological processes).
Fig 5
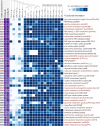
Fig 5. Phylogenetic profiles of 44 functionally annotated ESGCACB across the Set-F.
Shown are the selection of ESGCACB with the highest abundance difference between the ACB clade and non-ACB taxa (RD). Ids refer to the corresponding connected components provided in S6 Table. Gene clusters are ranked by decreasing RD. The CCD (cluster conservation difference, violet) is calculated as the difference between the relative fractions of ACB-genomes minus non-ACB genomes where the cluster is present. The heat map informs about the fraction of taxa per clade harboring the ESGCACB ranging from 0 (white) to 1 (dark blue). The total numbers of subsumed taxa per clade are given next to the leaf label in the above tree. IC1-8 represent the cluster abundance in the 8 international clones of A. baumannii. Clusters associated with metabolic pathways are highlighted in red. “#” marks an ESGC where we curated cluster boundaries based on literature evidence and confirmed cluster conservation using microsynteny (cf. Fig 4B). ‘*’ marks ESGCACB that encompass additional genes not covered by the functional annotation. Abbreviations: NRPS = non-ribosomal peptide synthesis; QS = quorum sensing; 2-AEP = 2-aminoethylphosphonate; PNAG = polymeric β-1,6-linked N-acetylglucosamine; NAMPT = nicotinamide phosphoribosyl transferase; PRPS = 5-phosphoribosyl pyrophosphate synthetase; GABA = gamma-aminobutyric acid; PQQ = pyrroloquinoline quinone.
Fig 6
Fig 6. Top 10 ESGCACB with unknown cluster function.
The genes of these clusters are mostly annotated as ‘hypothetical” or “DUF-containing protein”, i.e. proteins with annotated with a domain of unknown function. Due to their stable microsynteny and high prevalence across the ACB clade, they are highly interesting candidates for further functional characterization. The figure layout follows Fig 5.
Fig 7
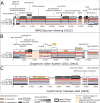
Fig 7. Three examples for ESGCACB in the genome of Ab ATCC 19606.
Bar plots indicate relative abundance within the selected taxonomic groups (see legend). The ESGCACB are embedded into two flanking protein-coding genes on each side that are not part of the cluster. Cluster boundaries are indicated by a pink background. Genes indicated in yellow have been either added to or excluded from the automatically generated clusters based on microsynteny analyses across Set-R. (A) ESGCACB− 0162 unites AbaR and AbaI (quorum sensing) with a non-ribosomal peptide synthetase cluster upstream. (B) ESGCACB− 0410 encompasses the cluster necessary for the Csu pilus formation. Note the deviating abundance pattern for CsuC and CsuD, which is due to the presence of prpC and prpD, two paralogous genes from the photoregulated pilus ABCD (prpABCD), in the respective orthologous groups. Microsynteny analyses confirmed that the entire Csu cluster forms one evolutionary unit (S1 Data id:0410). (C) ESGCACB− 0624 harbors a catalase and a cytochrome b561. Although the MFS transporter shares a similar abundance pattern across the taxa of Set-R, this transporter is not evolutionarily stably linked to the other two genes (S1 Data id:0624).
Fig 8
Fig 8. Abundances of micronutrient acquisition genes/clusters of Ab ATCC 19606 within and outside the ACB clade.
Absolute abundances were based on cluster-evaluation using microsynteny. Gene clusters are annotated with the ESGCACB identifiers in Fig 5. Genes that are part of a cluster but missed by the initial ESGC compilation share the same color but are marked as x. Gene clusters at the top right, e.g., feoABC, represent micronutrient acquisition clusters belonging to the genus’ core genome. Gene clusters at the top left, e.g., entAB, are confined to the ACB clade where they are ubiquitously present.
Fig 9
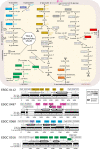
Fig 9. Members of the ACB clade have extended their basal carbohydrate metabolism.
The pathway map shows a model integrating four metabolic pathways represented by the ESGCACB-0112 (Entner-Doudoroff pathway; yellow), 0497 (biosynthesis of Pyrroloquinoline quinone; magenta), 0568 (glucarate/galactarate catabolism; blue/violet) and 0016 (carnitine catabolism; green) into the bacterial carbohydrate metabolism (grey boxes). Abbreviations: KDPG—2-keto-3-deoxy-6-phosphogluconate; G3P –glycerinealdehyde-3-phosphate. The corresponding gene clusters are shown below the pathway map with one protein-coding flanking gene on either side that is not part of the cluster. The layout follows Fig 7. ESGCACB-0112: GapD-like–glyceraldehyde-3-phosphate dehydrogenase [1.2.1.12]; GntK—gluconokinase [EC:2.7.1.12]; Edd—phosphogluconate dehydratase [EC:4.2.1.12]); Eda—2-dehydro-3-deoxyphosphogluconate aldolase / (4S)-4-hydroxy-2-oxoglutarate aldolase [EC:4.1.2.14 4.1.3.42]; GntP—gluconate permease [E2.7.1.12]. Note, GntP shares high sequence similarity with a gluconate transporter (H+ symporter) in Escherichia coli (98% coverage, 45% identity). ESGCACB-0497: pqqA-F. No abundance profile is shown for pqqA, since its length excluded it from orthology prediction (indicated by an ‘!’. See main text for details). ESGCACB-0568: GarD—galactarate dehydratase [EC:4.2.1.42]; gudD—glucarate dehydratase [EC:4.2.1.40]; kdgD—5-dehydro-4-deoxyglucarate dehydratase [EC:4.2.1.41]; aldH—2,5-dioxopentanoate dehydrogenase [EC:1.2.1.26]; gudP—MFS transporter, D-glucarate/D-galactarate permease; FadR—Fatty acid metabolism regulator protein. ESGCACB-0016: ttuc—D-malate dehydrogenase [EC:1.1.1.83]; Bet-Aci01347—glycine/betaine transporter Aci01347; ach?–putative acylcarnitine hydrolase [EC:3.1.1.8]; CntAB–carnitine monooxygenase reductase subunit A and B [EC:1.14.13.239]; MSA-DH–malic semialdehyde dehydrogenase [EC:1.2.1.?]. Further colored pathways represent the clusters ESGCACB-0627 (2-aminoethylphosphonate metabolism, orange), ESGCACB 0453 (fructose transport/metabolism, red), ESGCACB-0064 (trehalose biosynthesis, dark grey), and ESGCACB-0078 tricarballylate metabolism, brown). Their corresponding genomic regions are available in S5 Fig.
Fig 10
Fig 10. Evolutionary and functional characterization of the A. baumannii kynurenine pathway.
(A) The locus of ESGCACB 0452 in A. baumannii ATCC 19606. KynR—Lrp/AsnC family transcriptional regulator; KynU—kynurenine hydrolase; amino acid (aa) permease (uncharacterized); alpha/beta hydrolase (uncharacterized; putative kynB); serine proteinase. Cluster layout follows that of Fig 7. (B) The Kynurenine pathway of tryptophan degradation. EC numbers of the enzymes catalyzing the individual reactions are given in the boxes. KynB is represented in two versions in bacteria (see subfigure C), which are represented by different colors. (C) The alpha/beta hydrolase shares a significant sequence similarity and the presence of the Abhydrolase_3 Pfam domain (PF04199) with the human kynurenine formamidase (KynB or KFA) but not with KynB of P. aeruginosa, which instead harbors a Cyclase Pfam domain (PF04199) suggesting an independent evolutionary origin. (D) The kynurenine cluster is necessary and sufficient for growth on kynurenine but not on anthranilic acid. Growth of Ab04, Ab04 Δkyn, and of two Ab04 Δkyn::kyn strains (C1 and C2) on minimal medium supplemented with kynurenine (top) and anthranilate (bottom). (E) Phylogenetic profile of the A. baumannii Kyn cluster. Numbers between the corresponding genes in Ab ATCC 19606 and PA01 represent percent sequence similarity on the amino acid level. KynB of Ab ATCC 19606 and PAO1 are not significantly similar. The Kyn cluster is shared among many proteobacterial (opportunistic) pathogens where the Pseudomonas-type KynB is prevalent. The human-type KynB has homologs e.g., in Serratia (including S. rubideae). KynA is almost always encoded at a distant locus and entirely absent in Acinetobacter.

References

    1. Garnacho-Montero J, Amaya-Villar R. Multiresistant Acinetobacter baumannii infections: epidemiology and management. Curr Opin Infect Dis. 2010;23(4):332–9. Epub 2010/06/29. doi: 10.1097/QCO.0b013e32833ae38b . - DOI - PubMed
    1. Peleg AY, Seifert H, Paterson DL. Acinetobacter baumannii: emergence of a successful pathogen. Clin Microbiol Rev. 2008;21(3):538–82. Epub 2008/07/16. doi: 10.1128/CMR.00058-07 ; PubMed Central PMCID: PMC2493088. - DOI - PMC - PubMed
    1. Gupta N, Gandham N, Jadhav S, Mishra RN. Isolation and identification of Acinetobacter species with special reference to antibiotic resistance. J Nat Sci Biol Med. 2015;6(1):159–62. Epub 2015/03/27. doi: 10.4103/0976-9668.149116 ; PubMed Central PMCID: PMC4367029. - DOI - PMC - PubMed
    1. Sahl JW, Gillece JD, Schupp JM, Waddell VG, Driebe EM, Engelthaler DM, et al.. Evolution of a pathogen: a comparative genomics analysis identifies a genetic pathway to pathogenesis in Acinetobacter. PLoS ONE. 2013;8(1):e54287. Epub 2013/02/01. doi: 10.1371/journal.pone.0054287 ; PubMed Central PMCID: PMC3554770. - DOI - PMC - PubMed
    1. Visca P, Seifert H, Towner KJ. Acinetobacter infection—an emerging threat to human health. Iubmb Life. 2011;63(12):1048–54. Epub 2011/10/19. doi: 10.1002/iub.534 . - DOI - PubMed

Publication types

LinkOut - more resources