. 2022 Jun 2;18(6):e1010172.
doi: 10.1371/journal.pcbi.1010172. eCollection 2022 Jun.

sumSTAAR: A flexible framework for gene-based association studies using GWAS summary statistics

Affiliations

sumSTAAR: A flexible framework for gene-based association studies using GWAS summary statistics

Nadezhda M Belonogova et al. PLoS Comput Biol. .

Abstract

Gene-based association analysis is an effective gene-mapping tool. Many gene-based methods have been proposed recently. However, their power depends on the underlying genetic architecture, which is rarely known in complex traits, and so it is likely that a combination of such methods could serve as a universal approach. Several frameworks combining different gene-based methods have been developed. However, they all imply a fixed set of methods, weights and functional annotations. Moreover, most of them use individual phenotypes and genotypes as input data. Here, we introduce sumSTAAR, a framework for gene-based association analysis using summary statistics obtained from genome-wide association studies (GWAS). It is an extended and modified version of STAAR framework proposed by Li and colleagues in 2020. The sumSTAAR framework offers a wider range of gene-based methods to combine. It allows the user to arbitrarily define a set of these methods, weighting functions and probabilities of genetic variants being causal. The methods used in the framework were adapted to analyse genes with large number of SNPs to decrease the running time. The framework includes the polygene pruning procedure to guard against the influence of the strong GWAS signals outside the gene. We also present new improved matrices of correlations between the genotypes of variants within genes. These matrices estimated on a sample of 265,000 individuals are a state-of-the-art replacement of widely used matrices based on the 1000 Genomes Project data.


Conflict of interest statement

The authors have declared that no competing interests exist.

Figures

Fig 1
Fig 1. Workflow schematic.
(A) Each set of SNPs (all, non-coding, exonic, nonsynonymous and others) is analyzed separately. (B) Input data for sumFREGAT include GWAS summary statistics (p-values and effect sizes), correlations between genotypes calculated using the same or reference sample, the matrix of weighting functions defined by the parameters of the beta distribution, the probabilities of SNPs being causal (e.g., estimated using different functional annotations http://favor.genohub.org/). The list of methods can comprise an arbitrary subset of BT, SKAT, SKAT-O, PCA, FLM, and ACAT-V. All methods use summary statistics as input. For each method, region-based association analysis is repeatedly performed using different combinations of the weighting functions (i ∈ [1, I]) and probabilities of SNPs being causal (j ∈ [0, J]). ACAT is used for combining the p-values obtained by each method under different weighting functions and probabilities, and then for combining the results obtained by various methods.
Fig 2
Fig 2. Determination coefficient and deviances of approximated SKAT statistic related to the threshold value.
(A) Determination coefficient (R2) between–log10(P value) of original and approximated tests shown in red. (B) Deviances indicating inflation and conservativeness of approximated test statistics compared with original shown in red and blue, respectively.
Fig 3
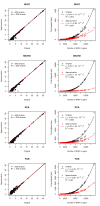
Fig 3. Accuracy and running time of four gene-based methods for association analysis under approximation.
Each point represents a gene: 7,990 genes for FLM (genes that passed collinearity filter for 25 basis functions, see S1 Text for details) and 17,975 genes for other methods. Left panels show–log10(P values), red lines are regression lines and black lines represent one-to-one correspondence. On the right panels, lines represent the best-fitted polynomial functions.

References

    1. Li B, Leal SM. Methods for detecting associations with rare variants for common diseases: application to analysis of sequence data. Am J Hum Genet. 2008;83(3):311–21. doi: 10.1016/j.ajhg.2008.06.024 ; PubMed Central PMCID: PMC2842185. - DOI - PMC - PubMed
    1. Eichler EE, Flint J, Gibson G, Kong A, Leal SM, Moore JH, et al.. Missing heritability and strategies for finding the underlying causes of complex disease. Nature reviews Genetics. 2010;11(6):446–50. doi: 10.1038/nrg2809 ; PubMed Central PMCID: PMC2942068. - DOI - PMC - PubMed
    1. Lee S, Emond MJ, Bamshad MJ, Barnes KC, Rieder MJ, Nickerson DA, et al.. Optimal unified approach for rare-variant association testing with application to small-sample case-control whole-exome sequencing studies. The American Journal of Human Genetics. 2012;91(2):224–37. doi: 10.1016/j.ajhg.2012.06.007 - DOI - PMC - PubMed
    1. Liu Y, Chen S, Li Z, Morrison AC, Boerwinkle E, Lin X. ACAT: A Fast and Powerful p Value Combination Method for Rare-Variant Analysis in Sequencing Studies. Am J Hum Genet. 2019;104(3):410–21. doi: 10.1016/j.ajhg.2019.01.002 ; PubMed Central PMCID: PMC6407498. - DOI - PMC - PubMed
    1. Quick C, Wen X, Abecasis G, Boehnke M, Kang HM. Integrating comprehensive functional annotations to boost power and accuracy in gene-based association analysis. PLoS Genet. 2020;16(12):e1009060. doi: 10.1371/journal.pgen.1009060 ; PubMed Central PMCID: PMC7737906 conflicts of interest. - DOI - PMC - PubMed

Publication types

MeSH terms