. 2022 Jun 7;119(23):e2118836119.
doi: 10.1073/pnas.2118836119. Epub 2022 Jun 2.

Accurate virus identification with interpretable Raman signatures by machine learning

Affiliations

Accurate virus identification with interpretable Raman signatures by machine learning

Jiarong Ye et al. Proc Natl Acad Sci U S A. .

Abstract

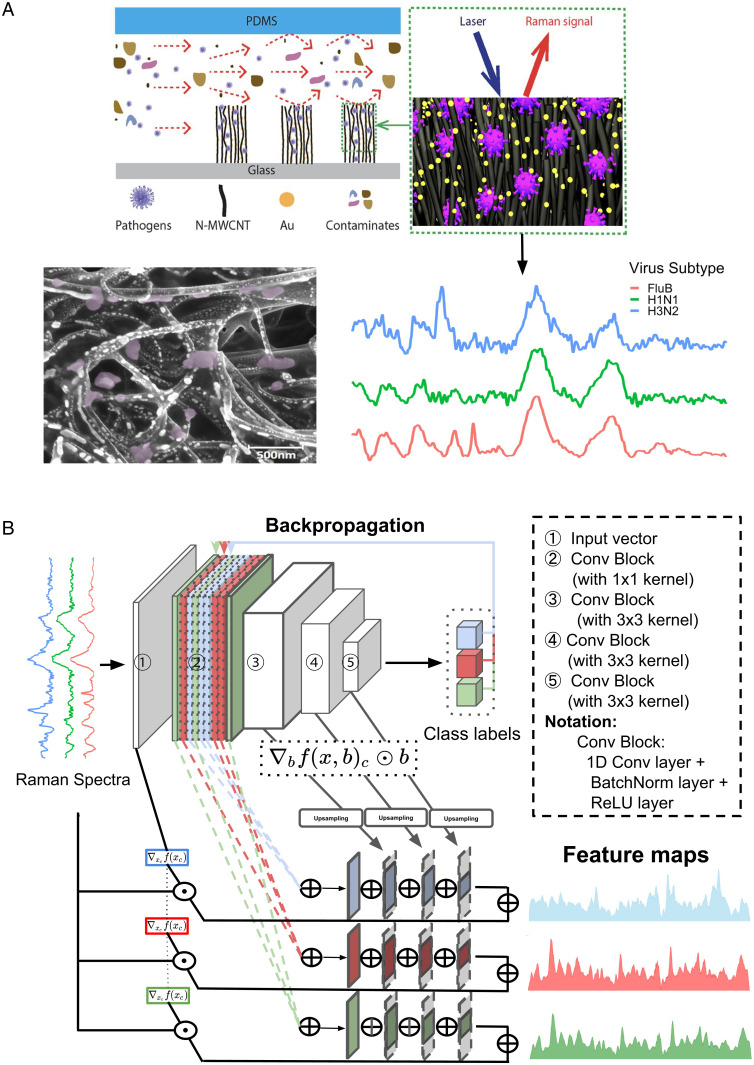
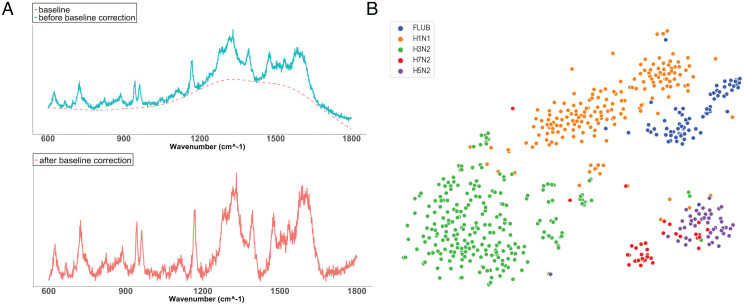
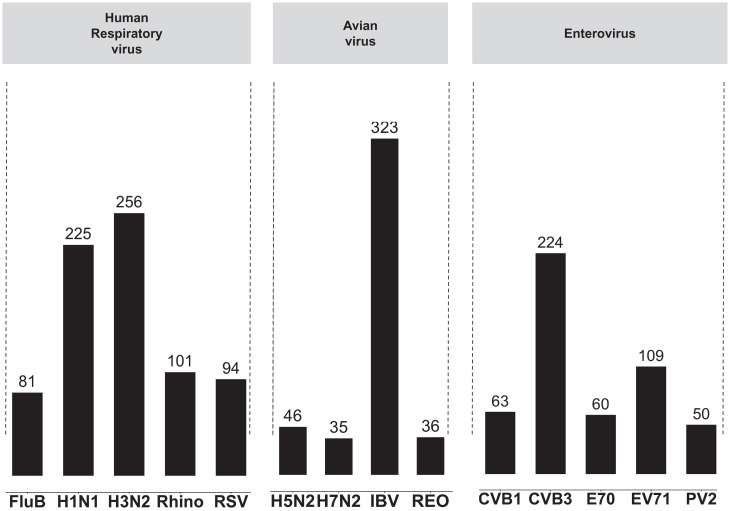
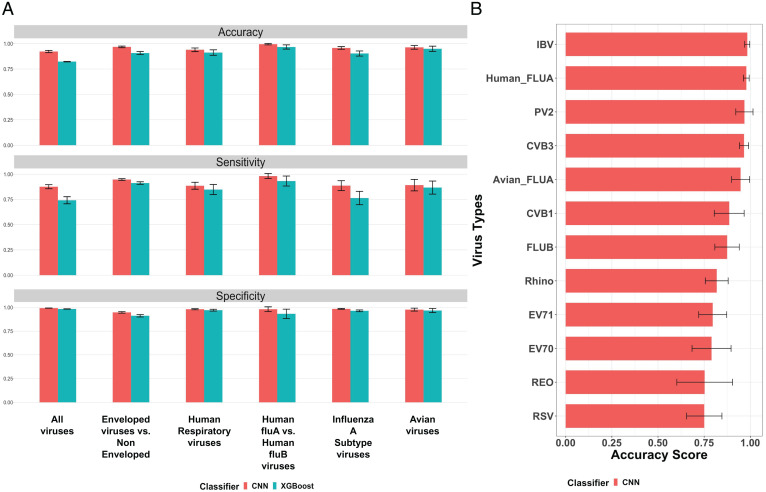
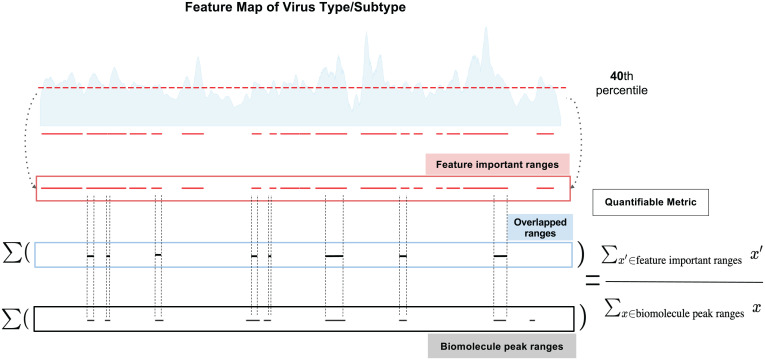
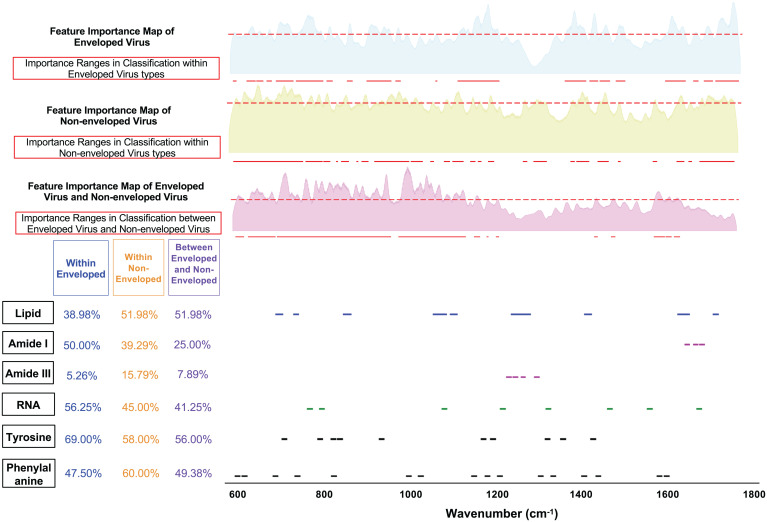
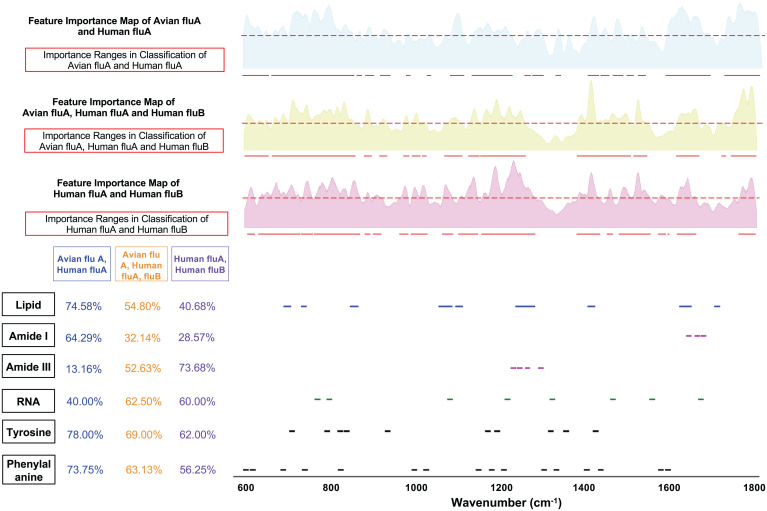
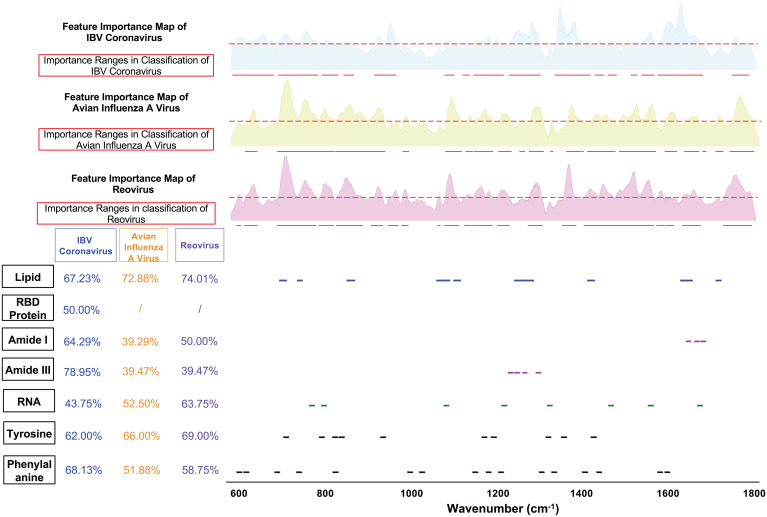
Rapid identification of newly emerging or circulating viruses is an important first step toward managing the public health response to potential outbreaks. A portable virus capture device, coupled with label-free Raman spectroscopy, holds the promise of fast detection by rapidly obtaining the Raman signature of a virus followed by a machine learning (ML) approach applied to recognize the virus based on its Raman spectrum, which is used as a fingerprint. We present such an ML approach for analyzing Raman spectra of human and avian viruses. A convolutional neural network (CNN) classifier specifically designed for spectral data achieves very high accuracy for a variety of virus type or subtype identification tasks. In particular, it achieves 99% accuracy for classifying influenza virus type A versus type B, 96% accuracy for classifying four subtypes of influenza A, 95% accuracy for differentiating enveloped and nonenveloped viruses, and 99% accuracy for differentiating avian coronavirus (infectious bronchitis virus [IBV]) from other avian viruses. Furthermore, interpretation of neural net responses in the trained CNN model using a full-gradient algorithm highlights Raman spectral ranges that are most important to virus identification. By correlating ML-selected salient Raman ranges with the signature ranges of known biomolecules and chemical functional groups—for example, amide, amino acid, and carboxylic acid—we verify that our ML model effectively recognizes the Raman signatures of proteins, lipids, and other vital functional groups present in different viruses and uses a weighted combination of these signatures to identify viruses.

Keywords: Raman spectroscopy; interpretable machine learning; virus identification.


Conflict of interest statement

The authors declare no competing interest.

Figures

Fig. 1.
Fig. 1.
(A) Schematics showing the nitrogen-doped multiwall CNTs device encapsulated in polydimethylsiloxane used to enrich viruses (Top Left). The viruses are enriched between CNTs where the Au nanoparticles are predeposited. Raman spectra are then collected from the virus-enriched samples (Top Right). A scanning electron microscope image (Bottom Left) of a sample shows CNTs, Au nanoparticles, and trapped viruses (purple colored). Raman spectra from different virus samples are shown (Bottom Right) (FLUB in red, FLUA H1N1 in green, and FLUA H3N2 in blue). (B) The CNN architecture for virus identification and the process of extracting Raman feature maps show important Raman signature ranges. The feature maps extracted are class specific, demonstrating the significant Raman ranges for identifying different virus types (or subtypes, depending on the classification task) in different colors.
Fig. 2.
Fig. 2.
(A) Sample Raman spectra before and after baseline correction. (B) T-SNE plot of FLUA subtypes (H1N1, H3N2, H5N2, H7N2) and FLUB after baseline correction.
Fig. 3.
Fig. 3.
Number of spectra in our dataset for human respiratory viruses, avian viruses, and human enteroviruses. H1N1, H3N2, H5N2, and H7N2 are subtypes of the FLUA virus; FLUB, influenza B virus; Rhino, rhinovirus; RSV, respiratory syncytial virus; IBV, infectious bronchitis virus; Reo, reovirus; CVB1 and CVB3, coxsackievirus B type 1 and 3; EV70 and EV71, enteroviruses. Numbers above each column indicate the number of spectra collected for each virus. These spectra all have ground truth labels, which are the virus type/subtype. Note that for classification tasks, we apply data augmentation to add more samples to virus classes that have fewer spectra samples so that for each classification task, every virus type has an equal number of spectra samples in the training set.
Fig. 4.
Fig. 4.
(A) The classification performance of our CNN model and the XGBoost model on six experiments: 1) all viruses (classification of all virus types): avian, enteroviruses, human respiratory viruses; 2) enveloped viruses versus nonenveloped: FLUA and FLUB, IBV coronavirus, and RSV are enveloped, and reovirus, enterovirus CVB1/CVB3/EV70/EV71/PV2, and rhino are nonenveloped; 3) human respiratory viruses; 4) human FLUA versus human FLUB viruses; 5) FLUA subtypes; and 6) avian viruses. Three metrics (accuracy, sensitivity, and specificity) are measured for both classification models. Results for all metrics are obtained by running a 5-fold cross-validation five times for fair comparison (each error bar represents the SD of the corresponding metric score for each experiment across 5-fold cross-validation in five tests). (B) Accuracy score for every virus type in the all-viruses classification task (each error bar represents the SD of the corresponding accuracy score for each virus type across 5-fold cross-validation in five tests).
Fig. 5.
Fig. 5.
Illustration of the quantifiable matching score calculation leveraging biomolecule peak ranges and important ranges extracted from ML-calculated feature maps of each virus type (or subtype, depending on the classification task). A threshold of 40th percentile is applied to the ML-calculated feature importance map so that Raman bands with importance scores below the threshold are discarded, and the remaining wavenumbers above the threshold are considered as important Raman ranges for identifying the virus based on ML and can then be correlated with biomolecule peak ranges.
Fig. 6.
Fig. 6.
Biomolecule peak ranges, ML-calculated feature importance map, and important Raman ranges (above 40th percentile threshold) for classification experiments: 1) within enveloped virus types (avian FLUA, IBV coronavirus, human FLUA, human FLUB, RSV); 2) within nonenveloped virus types (enterovirus [CVB1, CVB3, EV70, EV71, PV2], rhino, reovirus); and 3) between enveloped and nonenveloped viruses. Feature importance maps are extracted from intermediate layers of the CNN as described in Fig. 1B. The matching score for each classification experiment is calculated by correlating ML-selected important ranges with each biomolecule’s known Raman peak ranges. (SI Appendix, Fig. S6 includes matching scores with more functional groups).
Fig. 7.
Fig. 7.
ML-calculated feature importance map and important Raman ranges for classification experiments: 1) avian FLUA versus human FLUA; 2) avian FLUA, human FLUA, and human FLUB; and 3) human FLUA and human FLUB. (SI Appendix, Fig. S5 includes matching scores with more functional groups).
Fig. 8.
Fig. 8.
ML-calculated feature importance map and important Raman ranges for classifying three types of avian viruses: IBV coronavirus, avian FLUA virus, and reovirus. Feature important maps and matching scores are given for each avian virus type. The matching score for RBD protein only applies when correlating with IBV coronavirus because RBD protein is an exclusive biomolecule in IBV. (SI Appendix, Fig. S2 includes matching scores with more functional groups.)

References

    1. Paget J., et al. ; Global Seasonal Influenza-associated Mortality Collaborator Network and GLaMOR Collaborating Teams*, Global mortality associated with seasonal influenza epidemics: New burden estimates and predictors from the GLaMOR Project. J. Glob. Health 9, 020421 (2019). - PMC - PubMed
    1. World Health Organization, Coronavirus disease 2019 (COVID-19): Situation report, 82 (2020). https://apps.who.int/iris/handle/10665/331780. Accessed 10 January 2021.
    1. Keesing F., et al. , Impacts of biodiversity on the emergence and transmission of infectious diseases. Nature 468, 647–652 (2010). - PMC - PubMed
    1. Yeh Y.-T., et al. , A rapid and label-free platform for virus capture and identification from clinical samples. Proc. Natl. Acad. Sci. U.S.A. 117, 895–901 (2020). - PMC - PubMed
    1. Li S., et al. , Noninvasive prostate cancer screening based on serum surface-enhanced Raman spectroscopy and support vector machine. Appl. Phys. Lett. 105, 091104 (2014).

Publication types

LinkOut - more resources