. 2022 Sep 8;140(10):1132-1144.
doi: 10.1182/blood.2021014945.

Recurrent noncoding somatic and germline WT1 variants converge to disrupt MYB binding in acute promyelocytic leukemia

Affiliations

Recurrent noncoding somatic and germline WT1 variants converge to disrupt MYB binding in acute promyelocytic leukemia

Huan Song et al. Blood. .

Abstract

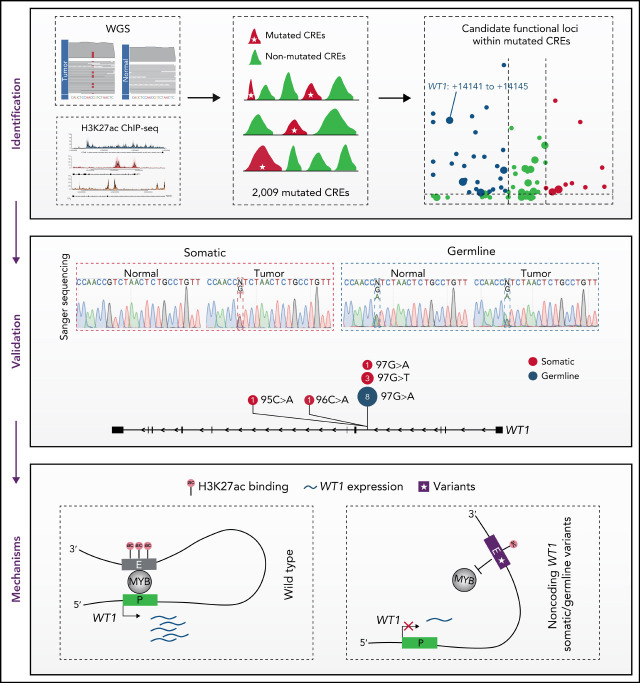
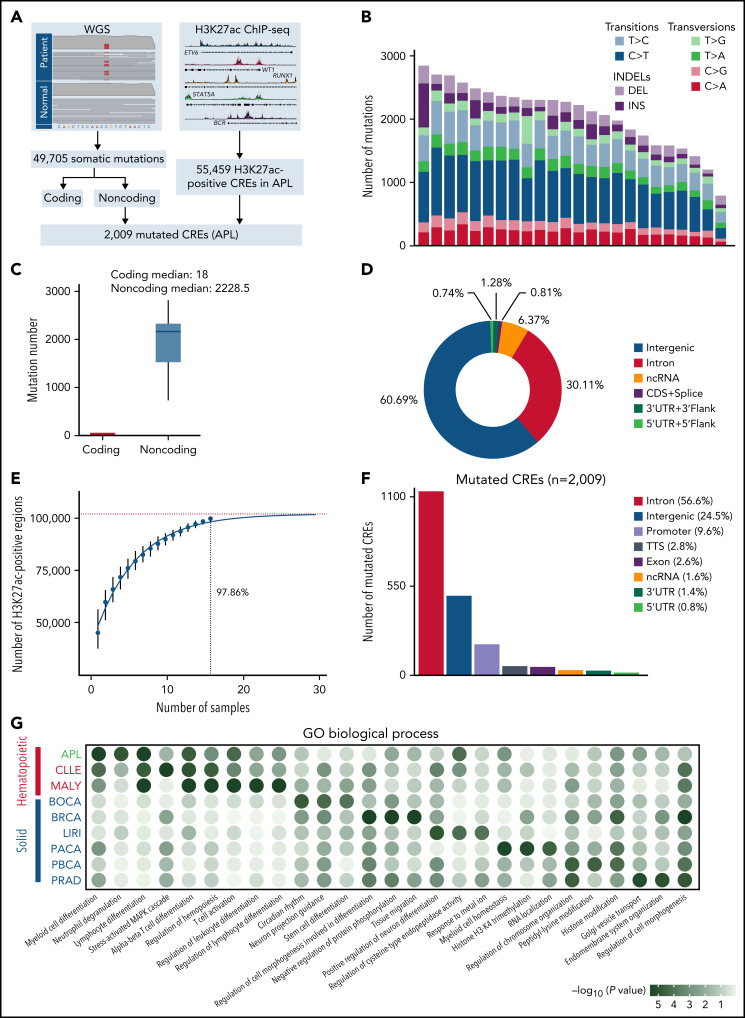
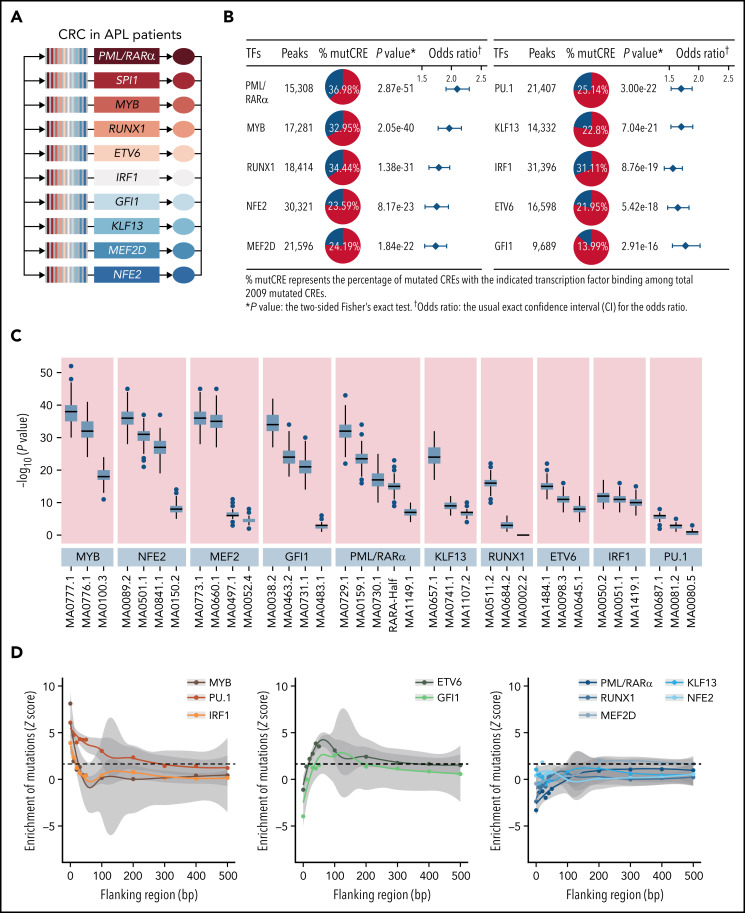
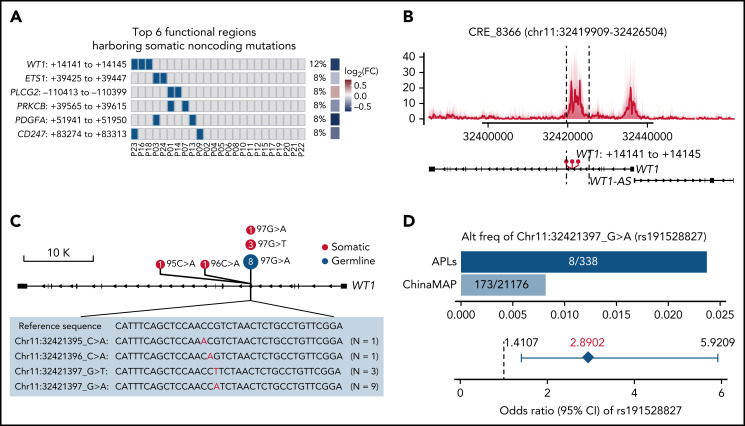
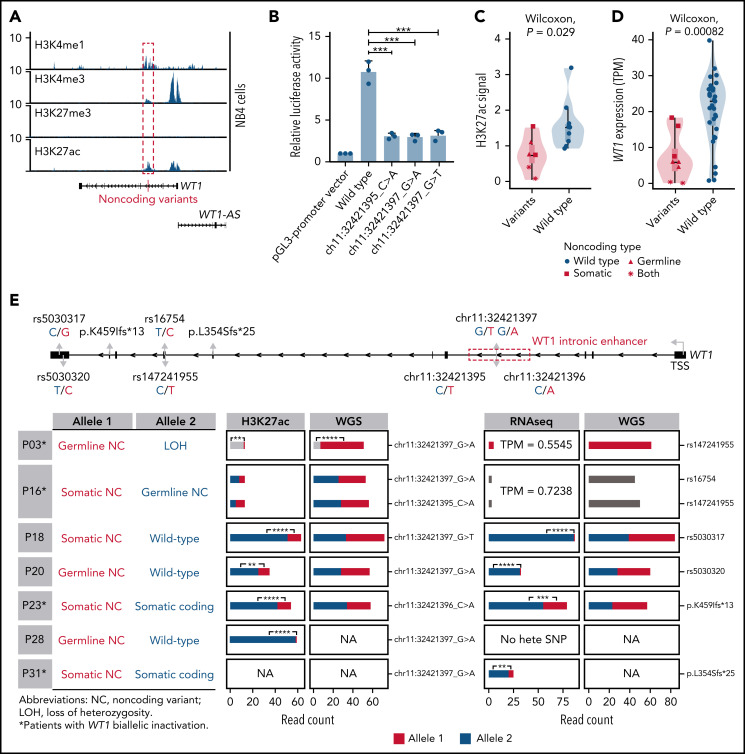
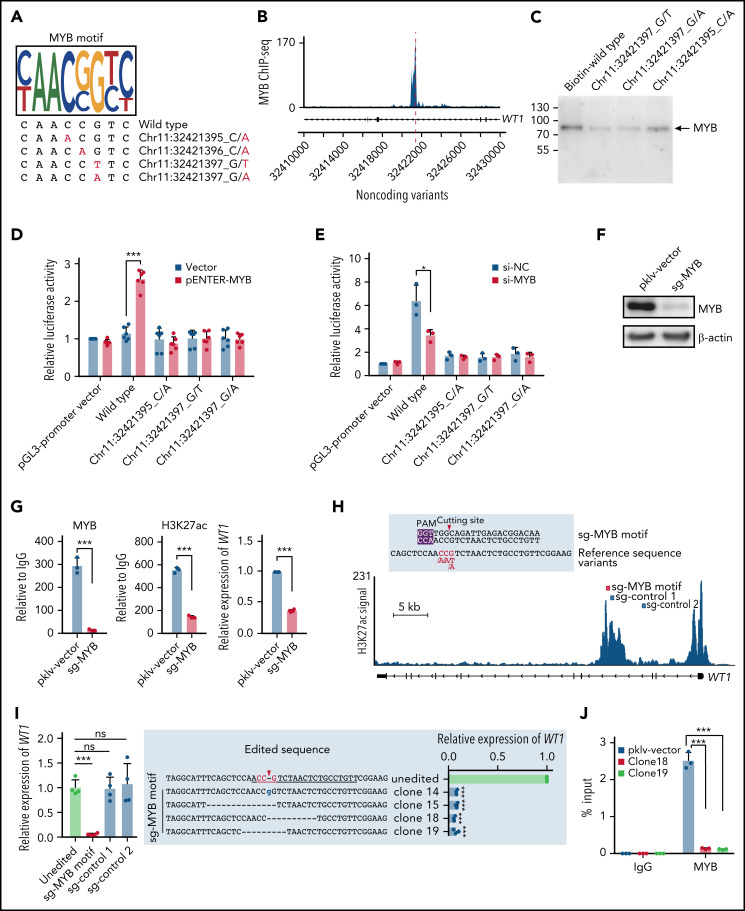
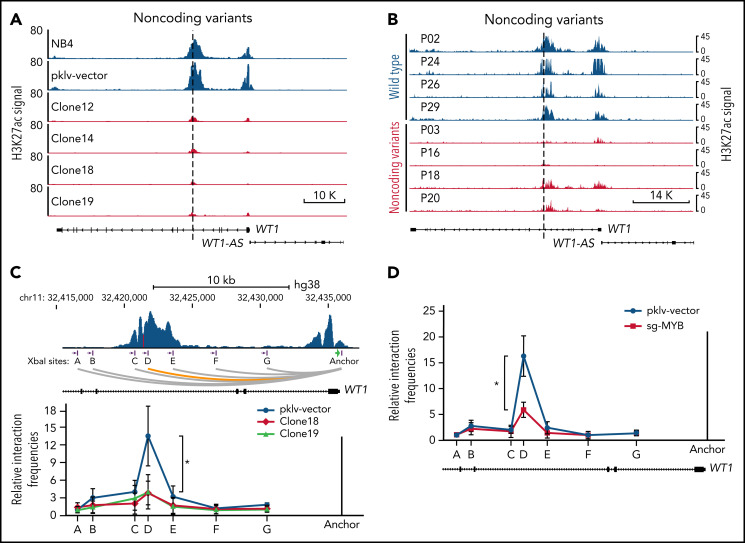
Genetic alternations can occur at noncoding regions, but how they contribute to cancer pathogenesis is poorly understood. Here, we established a mutational landscape of cis-regulatory regions (CREs) in acute promyelocytic leukemia (APL) based on whole-genome sequencing analysis of paired tumor and germline samples from 24 patients and epigenetic profiling of 16 patients. Mutations occurring in CREs occur preferentially in active enhancers bound by the complex of master transcription factors in APL. Among significantly enriched mutated CREs, we found a recurrently mutated region located within the third intron of WT1, an essential regulator of normal and malignant hematopoiesis. Focusing on noncoding mutations within this WT1 intron, an analysis on 169 APL patients revealed that somatic mutations were clustered into a focal hotspot region, including one site identified as a germline polymorphism contributing to APL risk. Significantly decreased WT1 expression was observed in APL patients bearing somatic and/or germline noncoding WT1 variants. Furthermore, biallelic WT1 inactivation was recurrently found in APL patients with noncoding WT1 variants, which resulted in the complete loss of WT1. The high incidence of biallelic inactivation suggested the tumor suppressor activity of WT1 in APL. Mechanistically, noncoding WT1 variants disrupted MYB binding on chromatin and suppressed the enhancer activity and WT1 expression through destroying the chromatin looping formation. Our study highlights the important role of noncoding variants in the leukemogenesis of APL.


Figures

None
Graphical abstract
Figure 1.
Figure 1.
Identification of mutated noncoding regulatory regions in APL by WGS and H3K27ac ChIP-seq data. (A) Schematic diagram for analyzing mutated CREs in APL. (B) The number of somatic single-nucleotide variants and short insertions/deletions in each patient. Different colors indicate different types of mutations. (C) Repartition of the 49 705 somatic mutations identified across the coding regions and noncoding regions. Each box plot represents the median, interquartile range, and minimum and maximum quartile of the mutation number. (D) Genomic localization of somatic mutations annotated using RefSeq hg38. (E) Saturation analysis for H3K27ac-positive regions identified from ChIP-seq across 16 APL samples. Individual points represent median peaks per sample added, and error bars represent standard deviations from the mean. (F) Genomic distribution of the mutated CREs over exons, promoter (-1 kb to +100 bp of the transcription start site), 3′UTR, 5′UTR, noncoding RNA (ncRNA), transcription termination site (TTS) (-100 bp to +1 kb of the TTS position), intron, and intergenic regions. (G) Enriched gene ontology (GO) terms within genes regulated by mutated CREs in APL compared with other types of hematopoietic malignancies and solid cancers. Other hematopoietic malignancies include chronic lymphocytic leukemia (CLLE) and malignant lymphoma (MALY). Solid cancers include bone cancer (BOCA), breast cancer (BRCA), liver cancer (LIRI), pancreatic cancer (PACA), pediatric brain cancer (PBCA), and prostate adenocarcinoma (PRAD). The variant call format files of WGS data for other cancer types were downloaded from the Pan-Cancer Analysis of Whole Genomes project, and the H3K27ac ChIP-seq data of these cancer types were downloaded from the Gene Expression Omnibus database. The bubble color indicates the P value. CDS, coding sequence.
Figure 2.
Figure 2.
Somatic mutations in CREs prefer to accumulate on chromatin regions bound by master transcription factors essential for APL. (A) Master transcription factors identified by the CRC modeling using H3K27ac ChIP-seq data of 16 APL samples. (B) Enrichment of binding regions for master transcription factors within mutated CREs. The enrichment level of binding regions for the indicated transcription factor in mutated CREs was analyzed by the Fisher’s exact test. (C) Enrichment analysis of DNA recognition motifs for the identified master transcription factors within mutated CREs compared with nonmutated CREs. The position weight matrices of master transcription factors and their paralogs for motif enrichment analysis were downloaded from JASPAR (http://jaspar.genereg.net). The top 3 enriched motifs (JASPAR ID) for the indicated transcription factor family were listed (eg, MA0100.3, MA0776.1, and MA0777.1 for MYB, MYBL1, and MYBL2, respectively). Box plot represents the median, interquartile range, and minimum and maximum quartile from motif enrichment analysis of 200 random subsampling from background regions. (D) Mutation enrichment analysis for master transcription factors over binding regions centered on DNA recognition motifs and the surrounding area. Z scores are computed based on a permutation test, and the dashed line indicates a P value < .05 significance threshold. mutCRE, mutated CRE.
Figure 3.
Figure 3.
Recurrent noncoding somatic and germline variants are located in the third intron of WT1. (A) Top 6 functional regions harboring somatic noncoding mutations identified by the integrative analysis. The abscissa represents each patient, the ordinate represents candidate loci containing noncoding mutations for the indicated gene, the blue represents the sample with the specified mutation, and the gray represents the sample that does not contain the specified mutation. Also included is the log2 fold-change of associated genes by comparing the expression levels of respective target genes in mutated and nonmutated samples. (B) Detailed annotation of the recurrent somatic noncoding mutation-containing locus in the third intron of WT1. The H3K27ac peaks of each sample are shown as a transparent area plot. The thick line represents the median profile from all samples. The height of peaks from each sample was determined by the H3K27ac read density of the corresponding sample within the region. (C) Lollipop plot showing the distribution and classes of noncoding variants in the third intron of WT1. The red point represents the somatic mutation, and the blue point represents the germline mutation. The size of the point represents the number of a given mutation type. (D) Association of rs191528827 with APL risk. Upper panel: the bar plot shows the alternative allele frequency of rs191528827 in 169 APL patients of this study and a nontumor cohort in the ChinaMAP. Lower panel: the diamond-shaped point represents the odds ratio, and the error bar represents the 95% confidence interval of the odds ratio. CI, confidence interval; FC, fold change.
Figure 4.
Figure 4.
Noncoding WT1 variants lead to allele-specific downregulation of WT1, and biallelic WT1 inactivation is recurrently found in APL patients. (A) ChIP-seq tracks of H3K4me1, H3K4me3, H3K27me3, and H3K27ac occupancy in the WT1 locus in NB4 cells without noncoding WT1 variants. The site for noncoding WT1 variants is marked with a red line. (B) Impairment of the enhancer activity by noncoding WT1 variants. Wild-type or mutated intronic sequences were cloned into the pGL3-promoter plasmid, and the luciferase reporter assay was performed in NB4 cells (without noncoding WT1 variants). Data are plotted as means plus or minus standard deviation (n = 3). ***P < .001. (C) Decreased H3K27ac signals on the intronic region of WT1 in noncoding WT1 variants containing APL patients compared with patients without such variants. The P value was calculated by the Wilcoxon test. (D) Significant downregulation of WT1 expression in APL patients with noncoding WT1 mutations/variants compared with patients without these alterations. Triangle represents the case with the somatic mutation. Quadrilateral represents the case with the germline variant. Star represents the case harboring both somatic mutation and germline variant. Circular represents the case without the noncoding mutation/variant. (E) Allelic imbalance of H3K27ac ChIP-seq signals and WT1 expression in noncoding WT1 variants for APL patients. Upper panel: diagram of the WT1 locus. Left panel: the mutation status in each allele of WT1 in APL samples with noncoding WT1 variants. Middle panel: allelic distribution of H3K27ac ChIP-seq reads with and without the indicated noncoding variant. Right panel: allele distribution of WT1 expression based on RNA-seq reads mapped to the indicated heterozygous exonic SNPs or exonic mutations. The red and blue colors represent different alleles, and gray represents the indistinguishable alleles. One-tailed binomial test (expected probability 0.5) was performed: *P < .05; **P < .01; ***P < .001; ****P < .0001. LOH, loss of heterozygosity; NA, not available; NC, noncoding variant; No hete SNP, no heterozygous exonic SNP.
Figure 5.
Figure 5.
Noncoding variants in the intronic enhancer of WT1 disrupt MYB binding and MYB-mediated transcriptional activation of WT1. (A) Noncoding WT1 variants disrupted the binding site of MYB. The binding motif of MYB was determined by the MYB-specific ChIP-seq data for NB4 cells (detailed in supplemental Methods). The lower panel shows patient-derived mutation sequences with mutated nucleotides labeled in red. (B) ChIP-seq tracks showing MYB binding to the WT1 intronic enhancer in NB4 cells (without noncoding WT1 variants). (C) DNA pulldown assays with anti-MYB antibodies and cell lysates from HEK293T cells stably expressing MYB. (D-E) The dual-luciferase assays on the enhancer activity of nonmutated and mutated constructs with or without MYB expression in 293T cells (D) and NB4 cells (E). The firefly luciferase activity was normalized to the renilla luciferase and presented as the ratio relative to the pGL3-SV40 promoter vector. (F) The knockout efficiency of sg-MYB was tested by western blot. (G) MYB knockout significantly reduced the H3K27ac signals of the WT1 enhancer and expression of WT1. MYB binding signals (left), H3K27ac signals (middle), and relative expression of WT1 (right) were determined. (H) The schematic diagram of the single guide RNA (sgRNA) target sites in the H3K27ac ChIP-seq track for NB4 cells. The red box indicates the sgRNA targeting the MYB motif, and the blue boxes indicate control sgRNAs targeting regions surrounding the MYB motif within intron 3. The protospacer adjacent motif (PAM) sequence is shown in the purple frame. The red arrowhead indicates the expected cleavage site. (I) Clustered regularly interspaced short palindromic repeats (CRISPR)/CRISPR-associated protein 9 (Cas9)-mediated targeted mutagenesis of the MYB motif within the third intronic region of WT1 inhibited WT1 expression. The left panel shows the relative WT1 expression in mutated clones targeted by the indicated sgRNAs and the unedited clones. CRISPR/Cas9-edited sequences were validated by Sanger sequencing. Data are normalized against the mean expression level of the unedited clones and are plotted as means plus or minus SD (n = 4). The middle panel shows the edited genomic sequences from CRISPR/Cas9-edited single-cell clones. The right panel shows the mRNA levels of WT1 expression in parental and CRISPR/Cas9-edited clones. Data are represented as the fold change relative to the expression of the parental cells and are plotted as means plus or minus SD (n = 3). (J) Disruption of the MYB motif resulted in the loss of MYB binding at the WT1 enhancer region. ChIP–quantitative polymerase chain reaction (qPCR) assays were performed to detect MYB binding using an antibody specific for MYB in the representative MYB motif-mutated clones and the parental cells. Data are calculated as the percentage of input and are plotted as means plus or minus SD (n = 3). The statistical significance was determined using a 2-tailed Student t test. *P < .05; **P < .01; ***P < .001. IgG, immunoglobulin G; ns, not significant; si-NC, negative control small interfering RNA (siRNA); si-MYB, siRNA targeting MYB; pklv-vector, sgRNA empty vector control; sg-MYB, sgRNA targeting MYB; SD, standard deviation.
Figure 6.
Figure 6.
Alterations in the recurrently mutated site of the WT1 enhancer disrupt the MYB-mediated enhancer-promoter interactions. (A-B) ChIP-seq tracks of H3K27ac signals at the WT1 locus in the MYB motif-mutated clones and the parental cells (A) and APL patients with or without noncoding WT1 variants (B). (C) The relative interaction frequencies between the anchor region (the WT1 promoter) and distal sites (purple bars) in the MYB motif-mutated clones and the parental cells. The relative interaction frequencies were determined by chromatin conformation capture (3C)-qPCR and normalized to the control region (region A). The upper panel is the schematic diagram showing the H3K27ac signals at the WT1 locus and the design of the 3C assay. XbaI restriction sites are indicated by purple blocks, 3C primers are indicated by purple arrows, and the anchor is shown by a green arrow. *P < .05 for comparison between the MYB motif-mutated clones and the parental cells. (D) The relative interaction frequencies analyzed by 3C-qPCR in NB4 cells with or without MYB knockout. *P < .05 for comparison between MYB knockout cells and control cells. pklv-vector, the sgRNA empty vector control; sg-MYB, sgRNA targeting MYB.

Comment in

References

    1. Corona RI, Seo JH, Lin X, et al. . Non-coding somatic mutations converge on the PAX8 pathway in ovarian cancer. Nat Commun. 2020;11(1):2020. - PMC - PubMed
    1. Mazrooei P, Kron KJ, Zhu Y, et al. . Cistrome partitioning reveals convergence of somatic mutations and risk variants on master transcription regulators in primary prostate tumors. Cancer Cell. 2019;36(6):674-689.e6. - PubMed
    1. Ramos-Rodríguez M, Raurell-Vila H, Colli ML, et al. . The impact of proinflammatory cytokines on the β-cell regulatory landscape provides insights into the genetics of type 1 diabetes. Nat Genet. 2019;51(11):1588-1595. - PMC - PubMed
    1. NandyMazumdar M, Yin S, Paranjapye A, et al. . Looping of upstream cis-regulatory elements is required for CFTR expression in human airway epithelial cells. Nucleic Acids Res. 2020;48(7):3513-3524. - PMC - PubMed
    1. Li J, Zhang T, Ramakrishnan A, et al. . Dynamic changes in cis-regulatory occupancy by Six1 and its cooperative interactions with distinct cofactors drive lineage-specific gene expression programs during progressive differentiation of the auditory sensory epithelium. Nucleic Acids Res. 2020;48(6):2880-2896. - PMC - PubMed

Publication types

MeSH terms