. 2022 Jun 21;24(6):e37004.
doi: 10.2196/37004.

Exploring Longitudinal Cough, Breath, and Voice Data for COVID-19 Progression Prediction via Sequential Deep Learning: Model Development and Validation

Affiliations

Exploring Longitudinal Cough, Breath, and Voice Data for COVID-19 Progression Prediction via Sequential Deep Learning: Model Development and Validation

Ting Dang et al. J Med Internet Res. .

Abstract

Background: Recent work has shown the potential of using audio data (eg, cough, breathing, and voice) in the screening for COVID-19. However, these approaches only focus on one-off detection and detect the infection, given the current audio sample, but do not monitor disease progression in COVID-19. Limited exploration has been put forward to continuously monitor COVID-19 progression, especially recovery, through longitudinal audio data. Tracking disease progression characteristics and patterns of recovery could bring insights and lead to more timely treatment or treatment adjustment, as well as better resource management in health care systems.

Objective: The primary objective of this study is to explore the potential of longitudinal audio samples over time for COVID-19 progression prediction and, especially, recovery trend prediction using sequential deep learning techniques.

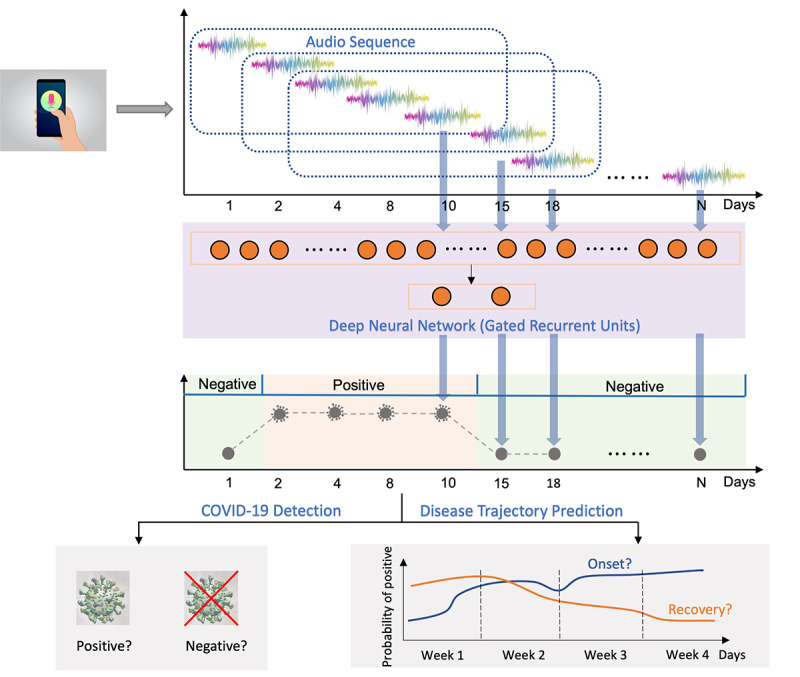
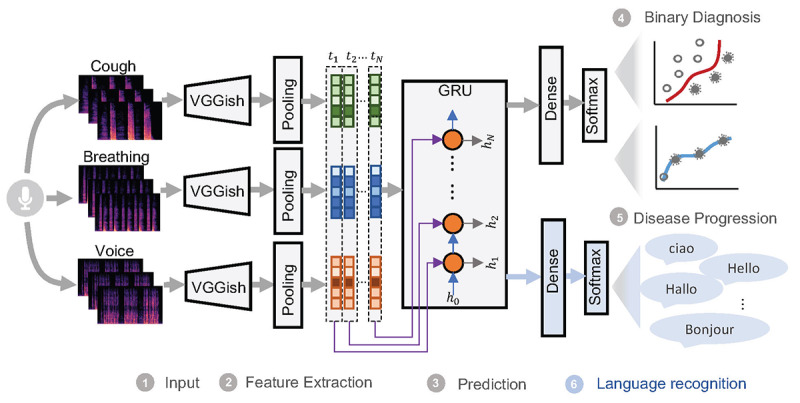
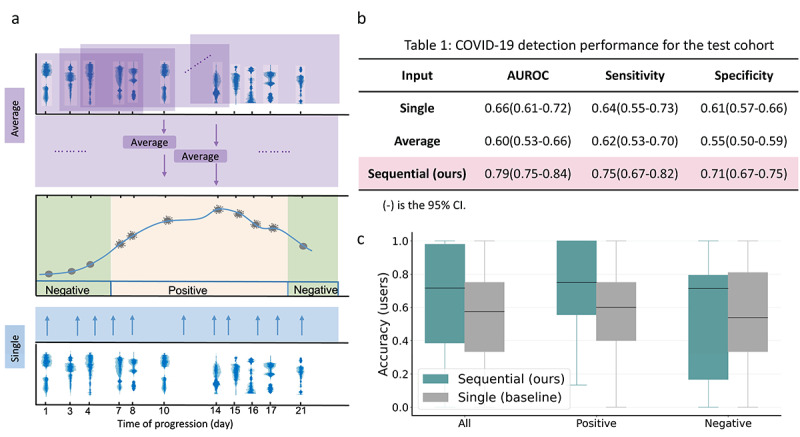
Methods: Crowdsourced respiratory audio data, including breathing, cough, and voice samples, from 212 individuals over 5-385 days were analyzed, alongside their self-reported COVID-19 test results. We developed and validated a deep learning-enabled tracking tool using gated recurrent units (GRUs) to detect COVID-19 progression by exploring the audio dynamics of the individuals' historical audio biomarkers. The investigation comprised 2 parts: (1) COVID-19 detection in terms of positive and negative (healthy) tests using sequential audio signals, which was primarily assessed in terms of the area under the receiver operating characteristic curve (AUROC), sensitivity, and specificity, with 95% CIs, and (2) longitudinal disease progression prediction over time in terms of probability of positive tests, which was evaluated using the correlation between the predicted probability trajectory and self-reported labels.

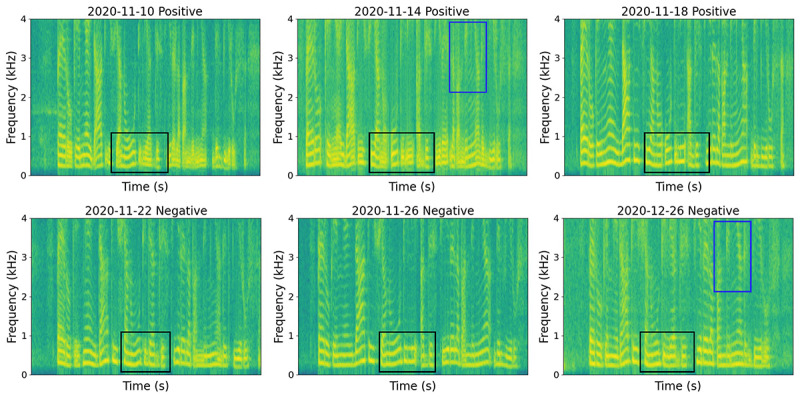
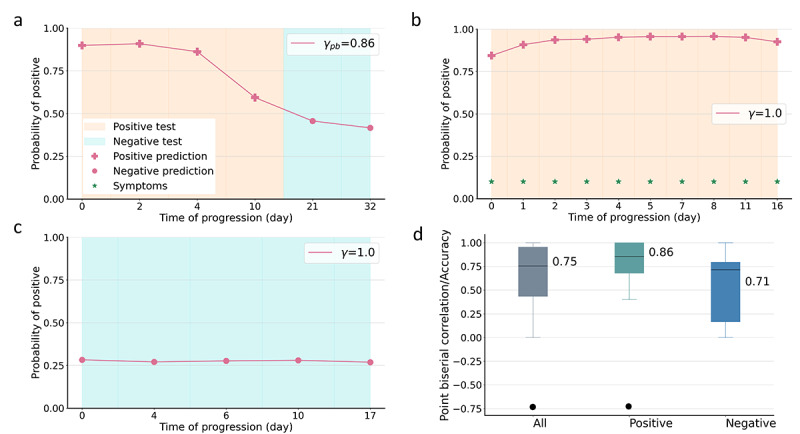
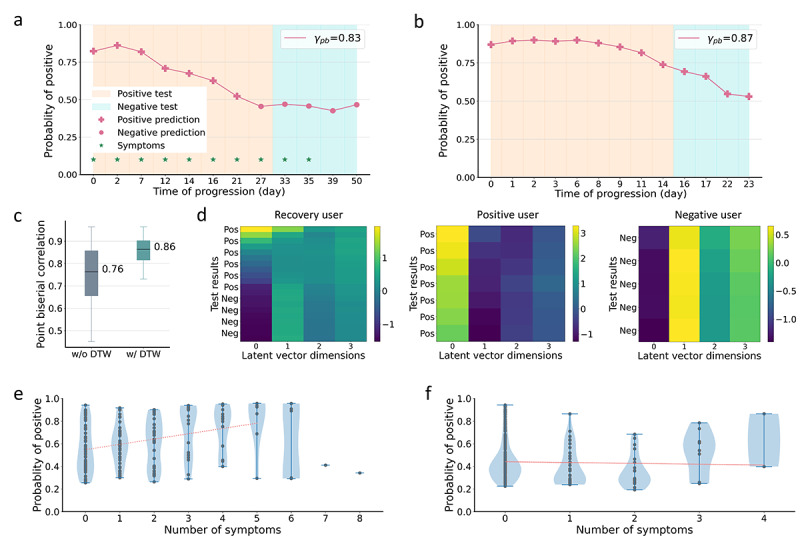
Results: We first explored the benefits of capturing longitudinal dynamics of audio biomarkers for COVID-19 detection. The strong performance, yielding an AUROC of 0.79, a sensitivity of 0.75, and a specificity of 0.71 supported the effectiveness of the approach compared to methods that do not leverage longitudinal dynamics. We further examined the predicted disease progression trajectory, which displayed high consistency with longitudinal test results with a correlation of 0.75 in the test cohort and 0.86 in a subset of the test cohort with 12 (57.1%) of 21 COVID-19-positive participants who reported disease recovery. Our findings suggest that monitoring COVID-19 evolution via longitudinal audio data has potential in the tracking of individuals' disease progression and recovery.

Conclusions: An audio-based COVID-19 progression monitoring system was developed using deep learning techniques, with strong performance showing high consistency between the predicted trajectory and the test results over time, especially for recovery trend predictions. This has good potential in the postpeak and postpandemic era that can help guide medical treatment and optimize hospital resource allocations. The changes in longitudinal audio samples, referred to as audio dynamics, are associated with COVID-19 progression; thus, modeling the audio dynamics can potentially capture the underlying disease progression process and further aid COVID-19 progression prediction. This framework provides a flexible, affordable, and timely tool for COVID-19 tracking, and more importantly, it also provides a proof of concept of how telemonitoring could be applicable to respiratory diseases monitoring, in general.

Keywords: COVID-19; COVID-19 progression; audio; deep learning; longitudinal study; mobile health.


Conflict of interest statement

Conflicts of Interest: None declared.

Figures

Figure 1
Figure 1
Sound recordings have distinct features during disease progression. This is evident here in the spectrograms of 1 participant who repeated the same sentence on 6 different days. The participant reported positive test results from November 10 to 18, 2020, and reported negative test results from November 22 to December 26, 2020, indicating a recovery trend. The fundamental frequency and its harmonics (black box) for positive recordings demonstrate a lack of control in vocal cords, indicated by their nonseparability. An increasing separability can be seen from positive to negative recordings over time, suggesting the recovery of voice characteristics. Similarly, the harmonics in the frequency range (2-4 kHz, blue box) manifest increasing separability, also reflecting the recovery trend.
Figure 2
Figure 2
Overview of study design: COVID-19 detection and progression were assessed from audio data. Voice, cough, and breathing sound recordings were collected from each participant over a period, together with self-reported COVID-19 test results. During model development, audio recordings were chunked into segments consisting of 5 samples covering a few days and processed using sequential modeling techniques (GRUs) for COVID-19 monitoring. Two subtasks were evaluated: (1) COVID-19 detection (positive vs negative) and (2) disease progression monitoring. GRU: gated recurrent unit.
Figure 3
Figure 3
Data flow diagram and demographic statistics. Large data sets were required to identify and avoid biases. (a) Data selection process. (b) Demographic statistics of eligible participants, including language, gender, age, and symptoms. English was the dominant language, comprising 54.2% (n=115) of the cohort. Age and gender were relatively balanced between positive and negative groups. In addition, 100 (94.3%) COVID-19–positive participants and 82 (77.4%) COVID-19–negative participants reported COVID-19 symptoms. (c) Duration and reporting intervals in terms of days and number of samples. The median number of samples was 9 (left), corresponding to a time span of 35 days (middle left). COVID-19–negative participants reported for a longer period compared to COVID-19–positive participants. The median reporting interval for the cohort was 3 days (middle right), validating the effective temporal dependencies of the audio data. The median duration after augmentation was 17 and 18 days for COVID-19–positive and COVID-19–negative participants, respectively (right), showing that the augmentation eliminated the confounding effects of the different duration for the 2 subgroups.
Figure 4
Figure 4
Model structure. A pretrained convolutional neural network (CNN)–based model VGGish was used as the feature extractor, and GRUs were used as a classifier, followed by dense layers, to account for longitudinal audio dynamics. This is a multitask learning framework, with COVID-19 detection as the main task and language detection as an auxiliary task to avoid language bias. hi, i ∑ [1,2,…N] represents the hidden vectors in the GRUs for time step ti. The reverse layer is used for the language task, as shown in Multimedia Appendix 1, Equation (5). GRU: gated recurrent unit.
Figure 5
Figure 5
The proposed sequential model shows superior performance in COVID-19 detection compared to benchmarks leveraging only 1 isolated audio data point per user. (a) “Average” means using the average of feature representations within the sequence for prediction, and “Single” means using only the feature representation on the same day for prediction. None of these systems capture longitudinal voice dynamics. (b) The proposed sequential modeling outperformed 2 benchmarks, suggesting the advantages of capturing disease progression via voice dynamics. (c) Individual-level accuracy for 42 participants in the test cohort.
Figure 6
Figure 6
Our approach enabled prediction of disease progression. Orange and cyan indicate positive and negative test results, and + and • represent positive and negative predictions, respectively. The green star indicates the presence of symptoms. (a) Disease progression of recovering participant P1. (b) Disease progression of COVID-19–positive participant P2. (c) Disease progression of COVID-19–negative participant P3. (d) Overall performance for the test cohort in terms of the point-biserial correlation coefficient γpb/accuracy γ.
Figure 7
Figure 7
Recovery trends can be predicted. The orange and cyan areas indicate positive and negative test results, respectively. The predictions above 0.5 were categorized as positive predictions (+) and below 0.5 as negative predictions (•). (a,b) Recovery predictions for 2 different participants P4 and P5, respectively. (c) Overall performance for recovery participants in the test cohort with and without DWT, which calculates the optimal match between the predicted recovery trajectory and test results. (d) Projection of latent vectors learnt by the model for 3 different participants. The y axis from top to bottom indicates the test results over time. A clear change in each latent vector dimension transitioning from positive to negative can be observed (recovering user), and consistent and different patterns can be observed for COVID-19–positive and COVID-19–negative participants. (e,f) Scatter plot of symptoms vs probability of positive predictions for COVID-19–positive (e) and COVID-19–negative (f) participants, with a high correlation observed for COVID-19–positive participants and no correlation for COVID-19–negative participants. DWT; dynamic time warping.

Similar articles

Cited by

References

    1. Vogels CBF, Brito AF, Wyllie AL, Fauver JR, Ott IM, Kalinich CC, Petrone ME, Casanovas-Massana A, Catherine Muenker M, Moore AJ, Klein J, Lu P, Lu-Culligan A, Jiang X, Kim DJ, Kudo E, Mao T, Moriyama M, Oh JE, Park A, Silva J, Song E, Takahashi T, Taura M, Tokuyama M, Venkataraman A, Weizman O-E, Wong P, Yang Y, Cheemarla NR, White EB, Lapidus S, Earnest R, Geng B, Vijayakumar P, Odio C, Fournier J, Bermejo S, Farhadian S, Dela Cruz CS, Iwasaki A, Ko AI, Landry ML, Foxman EF, Grubaugh ND. Analytical sensitivity and efficiency comparisons of SARS-CoV-2 RT-qPCR primer-probe sets. Nat Microbiol. 2020 Oct;5(10):1299–1305. doi: 10.1038/s41564-020-0761-6.10.1038/s41564-020-0761-6 - DOI - PMC - PubMed
    1. Cevik M, Kuppalli K, Kindrachuk J, Peiris M. Virology, transmission, and pathogenesis of SARS-CoV-2. BMJ. 2020 Oct 23;371:m3862. doi: 10.1136/bmj.m3862. - DOI - PubMed
    1. Fan L, Liu S. CT and COVID-19: Chinese experience and recommendations concerning detection, staging and follow-up. Eur Radiol. 2020 May 06;30(9):5214–5216. doi: 10.1007/s00330-020-06898-3. - DOI - PMC - PubMed
    1. Deshpande G, Batliner A, Schuller BW. AI-Based human audio processing for COVID-19: a comprehensive overview. Pattern Recognit. 2022 Feb;122:108289. doi: 10.1016/j.patcog.2021.108289.S0031-3203(21)00469-6 - DOI - PMC - PubMed
    1. Ates HC, Yetisen AK, Güder F, Dincer C. Wearable devices for the detection of COVID-19. Nat Electron. 2021 Jan 25;4(1):13–14. doi: 10.1038/s41928-020-00533-1. - DOI

Publication types