. 2022 Jul 21;82(14):2604-2617.e8.
doi: 10.1016/j.molcel.2022.05.008. Epub 2022 Jun 1.

A pro-metastatic tRNA fragment drives Nucleolin oligomerization and stabilization of its bound metabolic mRNAs

Affiliations

A pro-metastatic tRNA fragment drives Nucleolin oligomerization and stabilization of its bound metabolic mRNAs

Xuhang Liu et al. Mol Cell. .

Abstract

Stress-induced cleavage of transfer RNAs (tRNAs) into tRNA-derived fragments (tRFs) occurs across organisms from yeast to humans; yet, its mechanistic underpinnings and pathological consequences remain poorly defined. Small RNA profiling revealed increased abundance of a cysteine tRNA fragment (5'-tRFCys) during breast cancer metastatic progression. 5'-tRFCys was required for efficient breast cancer metastatic lung colonization and cancer cell survival. We identified Nucleolin as the direct binding partner of 5'-tRFCys. 5'-tRFCys promoted the oligomerization of Nucleolin and its bound metabolic transcripts Mthfd1l and Pafah1b1 into a higher-order transcript stabilizing ribonucleoprotein complex, which protected these transcripts from exonucleolytic degradation. Consistent with this, Mthfd1l and Pafah1b1 mediated pro-metastatic and metabolic effects downstream of 5'-tRFCys-impacting folate, one-carbon, and phosphatidylcholine metabolism. Our findings reveal that a tRF can promote oligomerization of an RNA-binding protein into a transcript stabilizing ribonucleoprotein complex, thereby driving specific metabolic pathways underlying cancer progression.

Keywords: Mthfd1l; Pafah1b1; breast cancer; metastasis; nucleolin; oligomerization; post-transcriptional; tRF; tRNA fragment; transcript stability.


Conflict of interest statement

Declaration of interests S.F.T. is a cofounder, shareholder, and member of the scientific advisory board of Inspirna.

Figures
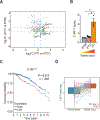
Figure 1.
Figure 1.. 5’-tRFCys is upregulated during breast cancer progression and metastasis.
A. A scatter plot depicting log2FoldChange (log2FC) for 5’-tRNA fragments (5’-tRFs) isolated from highly metastatic 4T1, poorly metastatic 4TO7, and non-metastatic 67NR cells. 5’-tRNA halves that were significantly upregulated only in 4T1 but not 4TO7 or 67NR cells are marked in red. The blue dashed lines denote -0.5 and 0.5, respectively. B. Quantification of 5’-tRFCys levels by RT-qPCR from mouse breast cancer cells with differing metastatic capacities (N=3). All data hereafter are represented as mean ± s.e.m. Data points represent biological replicates. Representative results from at least two independent experiments are shown, except mouse experiments, most of which were performed once with cohorts of mice. Statistical significance was determined by a one-tailed t-test with Welch’s correction. *, p<0.05. C. Kaplan-Meier curves depicting survival probability of breast cancer patients (n=1066) in the TCGA cohort stratified by 5’-tRFCys expression levels. Statistical significance was determined by the Mantel-Cox log-rank test. D. 5’-tRFCys expression in breast tumors and matched normal breast tissues in the TCGA cohort (n=101). Statistical significance was determined by paired t-test.
Figure 2.
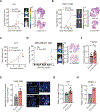
Figure 2.. 5’-tRFCys promotes breast cancer metastasis and enhances breast cancer cell survival.
A, B. Bioluminescence imaging plots of metastatic lung colonization by 4T1 (A) and in-vivo selected lung metastatic EO771-LM3 (B) cells transfected with scrambled control (Scr-LNA) or a 5’-tRFCys antisense LNA oligonucleotide (5’-Cys-LNA1). Representative bioluminescence images and H&E stained lung sections for each cohort are shown (N=5–7). C. Tumor growth rates for 4T1 cells transfected with scrambled control (Scr-LNA) or a 5’-tRFCys antisense LNA oligo (5’-Cys-LNA1) and implanted into mammary fat pads of Balb/c mice (N=9–10). D. Bioluminescence imaging plot of metastatic lung colonization in Nod scid gamma (NSG) mice by MDA-MB-231-LM2 cells. One day following tail-vein injection of MDA-MB-231-LM2 cells, mice were intravenously treated with an LNA targeting 5'-tRFCys (12.5 mg/kg dose) or a mock PBS control and twice weekly thereafter. Arrows denote days that mice received the intravenous treatments. Representative bioluminescence images and H&E-stained lung sections for each cohort are shown (N=7–8). E. Left, quantification of cleaved Caspase 3 positive cells in metastatic lung nodules normalized by areas of lung nodules. Mice were injected with 4T1 cells transduced with a 5’-tRFCys antisense (5’-Cys-TD) or a scrambled control tough decoy (Scr-TD) (N=3). Each data point represents the average of at least 10 different image measurements from one mouse lung section. Right, representative confocal images of anti-cleaved Caspase 3 staining from mouse lung sections. The dashed line delineates metastatic nodules. Scale bar: 10 um. F. Quantification of the fraction of apoptotic cells in 4T1 tumors transfected with scrambled control (Scr-LNA) or a 5’-tRFCys antisense LNA oligo (5’-Cys-LNA1) one day after implantation into mammary fat pads of Balb/c mice (N=9–10). G, H. Quantification of Caspase3/7 activities in 4T1 (G) cells or a human breast cancer patient-derived xenograft organoid line PDXO-1 (H) upon 5’-tRFCys inhibition (N=3–8). Statistical significance in mouse (A-D, F) and cell biology (E, G, H) experiments was determined by a one-tailed Mann-Whitney test and t-test with Welch’s correction, respectively. *, p<0.05; **, p<0.01; ***, p<0.001.
Figure 3.
Figure 3.. Nucleolin is a direct binding partner of 5’-tRFCys.
A. Volcano plot depicting log2Fold Change (log2FC) values versus –log10Pvalue in protein abundance quantified from pulldowns conducted with a biotinylated 5’-tRFCys antisense oligo (5’-Cys-AS) in comparison to a biotinylated scrambled control oligo (Scr-AS) in 4T1 cells. B. Venn diagram showing the number of proteins that were enriched by more than twofold in the 5’-tRFCys antisense pulldown compared to the control in distinct human (MCF7, MDA-MB-231-LM2) and mouse (4T1) breast cancer cell lines. C. Quantification by Taqman RT-qPCR assays of the amount of 5’-tRFCys pulled down by an anti-Nucleolin antibody or normal rabbit serum (NRS) from human (MDA-MB-231-LM2) or mouse (4T1) breast cancer cells. Statistical significance was determined by one-tail t-tests with Welch’s correction. ***, p<0.001. D. Dot plot depicting 5’-tRNA halves with the highest fraction of crosslinking induced modification sites (CIMS) in the non-RNase-treated Nucleolin CLIP libraries. Reads derived from the tRNACys loci are marked in red. E.The two most enriched motifs identified using Nucleolin-bound CLIP tags with the highest fractions of CIMS sites in non-RNase-treated Nucleolin CLIP libraries. F.Genome browser view of Nucleolin-CLIP tags and CIMS sites in a representative tRNACys locus from two non-RNase treated libraries. The blue and green boxes denote the two G-rich motifs and the anticodon (AC), respectively. The red rectangle marks the CIMS site. The Y-axis in the CLIP tag track represents reads per million (RPM), while that in the CIMS track represents the number of CIMS sites in CLIP tags. G.Electrophoresis mobility shift assay (EMSA) in the presence of an EDTA-containing buffer using purified Nucleolin protein and 5’ radiolabeled wild-type (WT) or mutant (MUT) 5’-tRFCys that contain mutations in the 5’ (5’MUT), middle (mid-MUT) or both (double-MUT) G-rich motifs.
Figure 4.
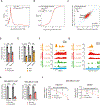
Figure 4.. 5’-tRFCys promotes Nucleolin binding to its target transcripts to enhance their stability.
A. Density plot of the log10 CLIP tag counts in Nucleolin-bound peaks identified from cells transfected with the control LNA (Scr-LNA) or 5’-tRFCys antisense LNA (5’-Cys-LNA1) oligos. Statistical significance was determined by Kolmogorov–Smirnov test. B. Cumulative distribution function (CDF) of the log2FC in protein abundance between 5’-tRFCys suppressed and control cells for all transcripts stratified by whether their Nucleolin binding was enhanced by 5’-tRFCys (red) or not (grey). Statistical significance was determined by the Kolmogorov–Smirnov test. C.Scatter plot comparing log2FC in the number of ribosome-protected fragments (RPFs) and log2FC in the number of RNA-Seq reads between 5’-tRFCys suppressed (5’-Cys-LNA1) and control cells (Scr-LNA) for all transcripts stratified by whether Nucleolin binding was enhanced by 5’-tRFCys (red) or not (grey). ρ, Spearman’s correlation coefficient. D, E. Quantification of 5’-tRFCys targets’ protein abundances upon inhibition of 5’-tRFCys (D) or depletion of Nucleolin (E). See also Figures S4H and S4I. F, G. Genome browser view of aligned Nucleolin (Ncl) CLIP tags (orange), RNA-Seq reads (red), and Ribo-Seq reads (green) within the 5’ UTR of Mthfd1l (F) and Pafah1b1 (G). The Y-axis represents RPM. TSS, transcription start site. H. Quantification by RT-qPCR of 5’-tRFCys target transcripts bound by Nucleolin immunoprecipitated from MDA-MB-231-LM2 cells transfected with either scrambled control (Scr-LNA) or a 5’-tRFCys antisense LNA oligonucleotide (5’-Cys-LNA1). I. Quantification by RT-qPCR of 5’-tRFCys target transcript abundance in MDA-MB-231-LM2 cells transfected with either scrambled control (Scr-LNA) or a 5’-tRFCys antisense LNA oligonucleotide (5’-Cys-LNA1). J. Quantification by RT-qPCR of the log2FC in Pafah1b1 and Mthfd1l transcript abundance in control (Scr-LNA) or 5’-tRFCys suppressed cells (5’-Cys-LNA1) treated with the RNA Polymerase II inhibitor, 5,6-dichloro-1-beta-D-ribofuranosylbenzimidazole (DRB). Statistical significance was determined by one-tail t-tests with Welch’s correction. *, p<0.05; **, p<0.01; ***, p<0.001.
Figure 5.
Figure 5.. 5’-tRFCys promotes complex D assembly and Nucleolin oligomerization.
A. Representative images of western blots of anti-FLAG immunoprecipitates (IP) from cells transfected with either HA-tagged Nucleolin alone or together with FLAG-tagged Nucleolin in the presence or absence of RNase A. B, C. Native gel analysis of complexes assembled from Pafah1b1 (B) or 5’-tRFCys (C) using Nucleolin IP in the presence or absence of Mg2+. Asterisk denotes an RNA-protein complex that was detected only with Nucleolin IP but not Nucleolin protein. D. Native gel analysis of complexes assembled from Pafah1b1 using Nucleolin IP at different temperatures. E. Western blot of Nucleolin using Nucleolin IP that was incubated at 30 °C with or without Mg2+ before crosslinking with ethylene glycol bis (succinimidyl succinate). F. Quantification of the kinetics of complex D assembly using Nucleolin IP with either Pafah1b1 or 5’-tRFCys. See also Figures S5E and S5F. G. Quantification of complex D assembly using increasing amounts of Nucleolin IP with either Pafah1b1 or 5’-tRFCys. Bmax, specific maximum binding. h, Hill coefficient. Kd, equilibrium dissociation constant. See also Figures S5G and S5H. H. Native gel analysis of Nucleolin complexes assembled using Nucleolin IP with either Pafah1b1 alone, or together with wild-type (WT) or a Nucleolin binding deficient 5’-tRFCys (MUT). I. Quantification of different forms of Nucleolin assembled using Nucleolin IP with Pafah1b1 alone or together with 5’-tRFCys.
Figure 6.
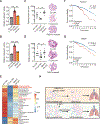
Figure 6.. Pafah1b1 and Mthfd1l function downstream of 5’-tRFCys to promote breast cancer metastasis.
A, B. Quantification of Caspase3/7 activity in 4T1 cells transfected with a control LNA (Scr-LNA), a 5’-tRFCys antisense LNA (5’-Cys-LNA1) either alone or together with overexpression of Pafah1b1 (Pafah1b1-rescued) (A) or Mthfdl1 (Mthfd1l-rescued) (B). C, D. Bioluminescence quantification of metastatic lung colonization in mice injected with 4T1 cells transfected with a control LNA (Scr-LNA), a 5’-tRFCys antisense LNA (5’-Cys-LNA1) either alone or together with overexpression of Pafah1b1 (Pafah1b1-rescued) (C) or Mthfdl1 (Mthfd1l-rescued) (D). Representative H&E stained lung sections for each cohort are shown (N=6–13). E. Heatmap showing z-scores for the abundance of metabolites that were significantly changed upon 5’-tRFCys inhibition in 4T1 cells. F, G. Kaplan-Meier curves depicting survival probability of breast cancer patients in the TCGA cohort (n=1097) stratified by their expression of Pafah1b1 (F) or Mthfd1l (G). Statistical significance was determined by Mantel-Cox log-rank test. H. A schematic model depicting the mechanism underlying 5’-tRFCys promotion of breast cancer metastasis.

Comment in

References

    1. Abdelmohsen K, and Gorospe M (2012). RNA-binding protein nucleolin in disease. RNA Biol 9, 799–808. 10.4161/rna.19718. - DOI - PMC - PubMed
    1. Abdelmohsen K, Tominaga K, Lee EK, Srikantan S, Kang MJ, Kim MM, Selimyan R, Martindale JL, Yang X, Carrier F, et al. (2011). Enhanced translation by Nucleolin via G-rich elements in coding and non-coding regions of target mRNAs. Nucleic Acids Res 39, 8513–8530. 10.1093/nar/gkr488. - DOI - PMC - PubMed
    1. Agarwal S, Behring M, Hale K, Al Diffalha S, Wang K, Manne U, and Varambally S (2019). MTHFD1L, A Folate Cycle Enzyme, Is Involved in Progression of Colorectal Cancer. Transl Oncol 12, 1461–1467. 10.1016/j.tranon.2019.07.011. - DOI - PMC - PubMed
    1. Arai H, Koizumi H, Aoki J, and Inoue K (2002). Platelet-activating factor acetylhydrolase (PAF-AH). J Biochem 131, 635–640. 10.1093/oxfordjournals.jbchem.a003145. - DOI - PubMed
    1. Arribere JA, and Gilbert WV (2013). Roles for transcript leaders in translation and mRNA decay revealed by transcript leader sequencing. Genome Res 23, 977–987. 10.1101/gr.150342.112. - DOI - PMC - PubMed

Publication types