. 2022 Jul 13;30(7):944-960.e8.
doi: 10.1016/j.chom.2022.05.005. Epub 2022 Jun 1.

Gut bacterial isoamylamine promotes age-related cognitive dysfunction by promoting microglial cell death

Affiliations

Gut bacterial isoamylamine promotes age-related cognitive dysfunction by promoting microglial cell death

Yun Teng et al. Cell Host Microbe. .

Abstract

The intestinal microbiome releases a plethora of small molecules. Here, we show that the Ruminococcaceae metabolite isoamylamine (IAA) is enriched in aged mice and elderly people, whereas Ruminococcaceae phages, belonging to the Myoviridae family, are reduced. Young mice orally administered IAA show cognitive decline, whereas Myoviridae phage administration reduces IAA levels. Mechanistically, IAA promotes apoptosis of microglial cells by recruiting the transcriptional regulator p53 to the S100A8 promoter region. Specifically, IAA recognizes and binds the S100A8 promoter region to facilitate the unwinding of its self-complementary hairpin structure, thereby subsequently enabling p53 to access the S100A8 promoter and enhance S100A8 expression. Thus, our findings provide evidence that small molecules released from the gut microbiome can directly bind genomic DNA and act as transcriptional coregulators by recruiting transcription factors. These findings further unveil a molecular mechanism that connects gut metabolism to gene expression in the brain with implications for disease development.

Keywords: DNA unwinding; aged brain; binding promoter; cognitive dysfunction; gut bacterial metabolite; gut bacteriophages; isoamylamine; microglial; sensome gene S100A8; transcription factor p53.


Conflict of interest statement

Declaration of interests The authors declare no competing interests.

Figures

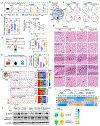
Figure 1.
Figure 1.. Comparative Analysis of Sensome Genes Expression and Apoptosis in Microglia of Young and Aged Mice
(A) Microglial cells isolated from mouse brains by Percoll gradient centrifugation and sorted by FACS with gating on the CD11b+CD45med population (red circle). (B) A heat map showing aging genes in microglia significantly (p<0.05) changed between 2-month-old (young, Y) mice and 12-month-old (aged, A) mice (n=3, each group mixed from three mice) using a quantitative real-time (qPCR) array. Red and blue colors represent elevated and decreased expression of mRNAs, respectively. (C) An individual qPCR analysis of microglia recovered from FACS sorted CD11b+CD45med cells from different regions of mouse brain specimens. The ratio of each gene to that of GAPDH was calculated and the relative expression levels normalized by cerebrum in the young mouse PBS group are shown. Red and blue colors represent elevated and decreased expression of mRNAs, respectively. (D) Western blot analysis of microglial cells from cerebral cortex. GAPDH was used as a loading control. The numbers under the blots indicate the density of bands normalized to the density of GAPDH. (E) Analysis of apoptosis in the brain of mice using the TUNEL assay. Scale bar, 100 μm. (F) Microglial cells isolated from mice and transfected with S100A8, S100A9 overexpression (pS100A8, pS100A9) and knockout (KO) plasmids, respectively. Western blot analysis of the expression of S100A8, S100A9, cleaved caspase-3 in microglia. Data are representative of three independent experiments. Related to Figure S1 and S2 and Table S1 and S3.
Figure 2.
Figure 2.. Gut Bacterial Metabolites IAA and CA Promote Apoptosis of Microglia cells in Aged Mice
(A) Analysis workflow of the relationship between gut microbe metabolites and brain microglial cell sensome. (B) Metabolite profiles of gut feces from 2m and 12m-old specific pathogen-free (SPF) and germ free (GF) mice (n=2, each group mixed from three mice) using liquid chromatography–mass spectrometry (LC–MS). The color scale represents log10 of signal intensity of MS data. (C) Integrated data of metabolite profiles and expression of sensome genes from young and aged mice (n=6), linear regression analysis indicating the relationship between the gut metabolites isoamylamine (IAA), crotonic acid (CA) and the S100A8 of microglia. (D) Quantification of IAA and CA in gut feces using high-performance liquid chromatography (HPLC). (E) Western blot analysis of cleaved caspase-3 and PARP in microglia of mice. GAPDH was used as a loading control. The numbers under the blots indicate the density of bands normalized to the density of GAPDH. (F) Analysis of apoptosis bodies (ABs) in the medium of primary microglia cells from mouse with FACS (left panel). Quantification of ABs (right panel). Data are representative of three independent experiments (error bars, SD). * P < 0.05, ** P < 0.01 (two-tailed t-test). Related to Figure S3 and Table S2.
Figure 3.
Figure 3.. Aging Dependent Reduction of Gut Bacteriophages Leads to the Production of Bacterial IAA and CA
(A) A heat map showing the composition of bacteria (family level) in the feces from healthy young (n=12) and aged people (n=12) using 16s rRNA next generation sequencing (NGS) analysis. (B) Principal coordinates analysis (PCoA) of 16s rRNA sequencing. (C) Real-time qPCR analysis of selected bacteria in mice fecal samples (n=10). Fold changes are shown relative to young mice. (D) Predictive analysis of the potential of bacteriophages (family level) to target higher abundance bacteria Ruminococcaceae and Clostridiaceae in the aged mouse intestine. (E) Analysis of phage level in feces of mice using qPCR. (F) Schematic diagram of Ruminococcaceae (ATCC, TSD-27) binding phages isolated from human feces following the administration to TSD-27 and mice (top panel). TSD-27 exposed to TSD-27 binding phages (phageTSD-27). The phage titer and relative bacterial survival rate estimated by spectrophotometer (bottom panel). (G) HPLC analysis of the metabolites IAA and CA in the growth medium of TSD-27 treated with phageTSD-27 (left panel) and in the fecal supernatants of mice gavage-given phageTSD-27 (right panel). (H) A heat map showing the relative abundance of TSD-27 binding phage and Lactobacillus rhamnosus GG (LGG) binding phage in human feces, as well as phage from young and old subjects using NGS analysis. Data are representative of four independent experiments (error bars, SD). * P < 0.05, ** P < 0.01 (two-tailed t-test); NS, not significant. Related to Figure S3 and Table S4.
Figure 4.
Figure 4.. Identification of Gut Metabolite IAA Targeted S100A8 Promoter Region
(A) Schematic diagram of the strategy to demonstrate the interaction of IAA and the promoter of S100A8 (left panel). Oligo binding to IAA with the expected mobility shift on PAGE (right panel). The transcription start site (TSS) is marked by the bent arrow. ATG; translation start code. (B) 10 pmol of synthetic DNA oligo S100p1 and S100p2 (60 mer/each) corresponding to the sequence on the promoter of S100A8 incubated with IAA (1 μM) or fecal supernatant (1 g feces/ml) for 30 min at 37°C. The oligos separated on 15% PAGE and visualized with ethidium bromide. P: PBS; I: IAA; S: gut feces supernatant. (C) The shorter synthetic DNA oligos S100p1-A to S100p1-I (20 mer/each) correspond to the sequence of S100p1 (top panel). Representative PAGE for the oligos S100p1-F to S100p1-I with or without IAA (bottom panel). (D) SPR analysis of the interaction of biotin labeled oligos S100p1, S100p1-G and mutant S100p1-GM with IAA (1 μM.) (E) The promoter sequences of S100A8 inserted into a luciferase reporter pLuc and transfection of microglia. Luciferase activities assessment 12 h after treatment of IAA. (F) Representation of a 15% PAGE for the oligo S1001-G, as well as mutants indicated in the figure. Each oligo contained a single base mutation. The base in pink replaced by different base caused the abolishment of IAA binding shift. Data are representative of three independent experiments (error bars, SD). * P < 0.05, ** P < 0.01 (two-tailed t-test); NS, not significant. Related to Figure S4 and Table S5.
Figure 5.
Figure 5.. IAA, a Promoter-unfolding Enabler, Facilitates p53 Access to the S100A8 Promoter Region via Unwinding of the Hairpin Structure
(A) The sequence of S100A8 promoter indicating the distance from TSS containing the IAA potential binding motif (pink) and p53 binding site (box) (top panel). The analysis of luciferase activity for the p53 KO microglia transfected with the luciferase plasmid inserted S100A8 promoter sequence. Treatment of IAA and/or recombinant mouse p53 protein is indicated in the figure (bottom panel). (B) Schematic diagram of the IAA binding motif forming a hairpin structure with complementary sequences. IAA promotes the unwinding of the hairpin exposing the transcription factor p53 binding site (box). (C) IAA binding oligo and mutant synthesized with modification of fluorescence Cy3 at the 5’ and the Quencher BHQ1 3’-end. DNA (20 μM) unwound with helicase (100 ng/ml) and/or IAA. The fluorescence value was recorded at an excitation wavelength at 550 and emission wavelength at 570. (D) Biotinylated IAA incubated with shearing BV2 genomic DNA. The interaction of IAA and the promoter of S100A8 indicated using the ChIP assay. (E) SPR analysis of interaction between p53 protein and biotinylated oligo covalently immobilized onto the sensor chip with or without IAA. (F) Biotinylated oligo S100p1-G (WT) and mutant transfected into microglia cells for 12 h and incubate with mouse gut supernatant for additional 6 h. Metabolite analysis with LC-MS after pull-down with streptavidin beads. (G) KO p53 with CRISPR/Cas9 transfection for 48 h and the expression of S100A8 in microglia after treatment with IAA for 12 h analyzed by western blot. (H) 3D predicted structures of interaction between IAA and oligo S100p1-G (G-Red; T-Yellow; C-Green; A-Cyan) at position G-4 and G-11 by two hydrogen bonds. (I) Multi-sequences alignment of S100A8 orthologues on promoter using CLUSTAL 2.1. The depth of color shading indicates the degree of residue conservation. (J) Phylogenetic tree of S100A8 orthologues on promoter sequences containing the IAA binding motif using r package “ape” in a R 4.0 environment. The horizonal lines are branches and represent evolutionary lineages changing over time. The length of a branch represents genetic variation among these sequences. Data are representative of three independent experiments (error bars, SD). * P < 0.05, ** P < 0.01 (two-tailed t-test). Related to Figure S4 and Table S5.
Figure 6.
Figure 6.. IAA Promotes Cognitive Decline Whereas PhageTSD-27 Reverses Cognitive Decline
(A) Schematic diagram of the treatment schedule and timeline for Learning and Memory Tests. Administration of IAA (0.5 g/kg) and phageTSD-27 (1x10⁹ pfu/each) to young and aged mice (n=10 each group), respectively, for two months prior to the behavioral tests. (B) Schematic diagram of the Morris water maze (MWM) test indicating a variety of insertion points (S, south; SW, southwest; W, west; NW, northwest; N, north). (C) Representative search paths taken by mice on the day of test at the insertion point of west (W, top panel) and south (S, bottom panel). (D) MWM performance of all groups of mice in the test (day 5). The aged mice revealed a greater path length per pool diameter as well as a longer escape latency as compared with young mice. Administration of IAA and phageTSD-27 to young and aged mice, respectively, for two months significantly altered the search path and escape latency (left panel); MWM performance of mice in the exploration (day 1) and acquisition trials (day 2 to day 4) (right panel). * Y-IAA vs Y-PBS; # Aged-phageTSD-27 vs Aged-PBS. (E) Schematic diagram of the T Maze Spontaneous Alternation (T-maze, TMSA) Test (left panel); Quantification of T-maze spontaneous alternation in test day (right panel). (F) Schematic diagram of the 2-Object Novel Object Recognition (NOR) test (left panel); Percentage of the times for the novel objects out of the total exploration times (right panel). (G) H&E-stained sections of the cerebrum, thalamus, cerebellum, hippocampus and brain stem (400x magnification, scale bar, 200 μm). Arrows in the left panel indicate neuronal loss and dying neurons in aged mice (n=5 per group). (H) A representative 10-second clip of epidural electroencephalographic (EEG) captured from four electrodes (left panel) in the freely behaving mice (n=5 per group) in a wakened state. Different EEG channels are colored. Each EEG channel is identified with a two-letter label indicating its position: F, frontal; O, occipital; L, left and R, right (middle panel). Density spectral array (DSA) showing the distribution of EEG strength in relation to frequency over time (right panel). The color scale represents power from 0 to 10 pW. (I) A heat map showing composition of EEG signal frequency in cerebral cortex of mice (n=5). Orange and blue colors represent high and low percentage of waveforms, respectively. (J) Represent analysis of western blot for the expression in microglia from different regions of the brain (left panel). The ratio of each band density to that of GAPDH was calculated and the relative expression levels normalized by cerebrum in the young mouse untreated group are shown. Red and blue colors represent elevated and decreased expression, respectively (right panel). Data are representative of five independent experiments (error bars, SD). *,# p < 0.05, **,#,# p < 0.01 (two-tailed t-test). Related to Figure S5.
Figure 7.
Figure 7.. S100p1-G Mediated Depletion of Gut Metabolite IAA Leads to Prevention of Cognitive Dysfunction
(A) Schematic diagram of IAA depletion (dep) from aged mice fecal supernatant (Sup) with biotinylated oligo S100p1-G, followed by pull-down with streptavidin beads. (B) IAA removed from the fecal supernatant of aged mice (12-month-old, male) with wild-type S100p1-G (IAAdep) or mutant S100p1-G (Ctrldep) at 1.0 nM/ml. HPLC analysis of IAA in the supernatant (left panel); fecal supernatant with/without IAA depletion administered to 2-month-old male mice (n=6) via oral gavage and HPLC analysis of IAA in the serum collected 24 h after oral administration (right panel). (C) Young mice (2-month-old, male) were gavage-given TSD-27 bacterium (1x10⁹ /mouse) along with phageTSD-27(1x10⁹ pfu/mouse) and phageLGG (1x10⁹ pfu/mouse). A different group of young mice (2-month-old, male) were gavage-given aged mouse derived gut supernatant with IAAdep, Ctrldep depletion (n=10 each group) or without depletion (−) as a control group. All mice were treated as described above every other day for two months prior to the behavioral tests and other tests (D-G). Representative search paths in the MWM taken by mice on the day of test at the insertion point of west (W) (left panel). Quantification of relative search path taken by mice (right panel). (D) Quantification of T-maze spontaneous alternation. (E) Analysis of IAA in serum using HPLC. (F) Analysis of S100A8 in microglia of the brain using qPCR. (G) Analysis of S100A8 and cleaved caspase-3 in microglia of the brain by western blot. The color of the arrows represents the treatment group indicated in panel C. (H) Oligo S100p1-G and S100p1-G mutant were intravenously administered to aged mice (12-month-old, male) via the tail vein at 1 μg/kg body weight (n=10) twice a week for two months prior to the MWM testing. Representative search paths taken by mice in the MWM test (left panel). Quantification of relative search path taken by mice (right panel). (I) HPLC analysis of IAA in CSF collected at 1 h after the last oligo S100p1-G and S100p1-G mutant treatments. Data are representative of five independent experiments (error bars, SD). * p < 0.05, ** p < 0.01 (two-tailed t-test). Related to Figure S5.

References

    1. Anders L, Guenther MG, Qi J, Fan ZP, Marineau JJ, Rahl PB, Lovén J, Sigova AA, Smith WB, Lee TI, et al. (2014). Genome-wide localization of small molecules. Nat Biotechnol 32, 92–96. 10.1038/nbt.2776. - DOI - PMC - PubMed
    1. Angelova DM, and Brown DR (2019). Microglia and the aging brain: are senescent microglia the key to neurodegeneration? J Neurochem 151, 676–688. 10.1111/jnc.14860. - DOI - PubMed
    1. Bae BI, Xu H, Igarashi S, Fujimuro M, Agrawal N, Taya Y, Hayward SD, Moran TH, Montell C, Ross CA, et al. (2005). p53 mediates cellular dysfunction and behavioral abnormalities in Huntington’s disease. Neuron 47, 29–41. 10.1016/j.neuron.2005.06.005. - DOI - PubMed
    1. Baker M, Akrofi K, Schiffer R, and Boyle MW (2008). EEG Patterns in Mild Cognitive Impairment (MCI) Patients. Open Neuroimag J 2, 52–55. 10.2174/1874440000802010052. - DOI - PMC - PubMed
    1. Bernard-Patrzynski F, Lécuyer MA, Puscas I, Boukhatem I, Charabati M, Bourbonnière L, Ramassamy C, Leclair G, Prat A, and Roullin VG (2019). Isolation of endothelial cells, pericytes and astrocytes from mouse brain. PLoS One 14, e0226302. 10.1371/journal.pone.0226302. - DOI - PMC - PubMed