. 2022 Jun 21;3(6):100651.
doi: 10.1016/j.xcrm.2022.100651. Epub 2022 May 17.

SARS-CoV-2 Omicron variant escapes neutralizing antibodies and T cell responses more efficiently than other variants in mild COVID-19 convalescents

Affiliations

SARS-CoV-2 Omicron variant escapes neutralizing antibodies and T cell responses more efficiently than other variants in mild COVID-19 convalescents

Pablo Garcia-Valtanen et al. Cell Rep Med. .

Abstract

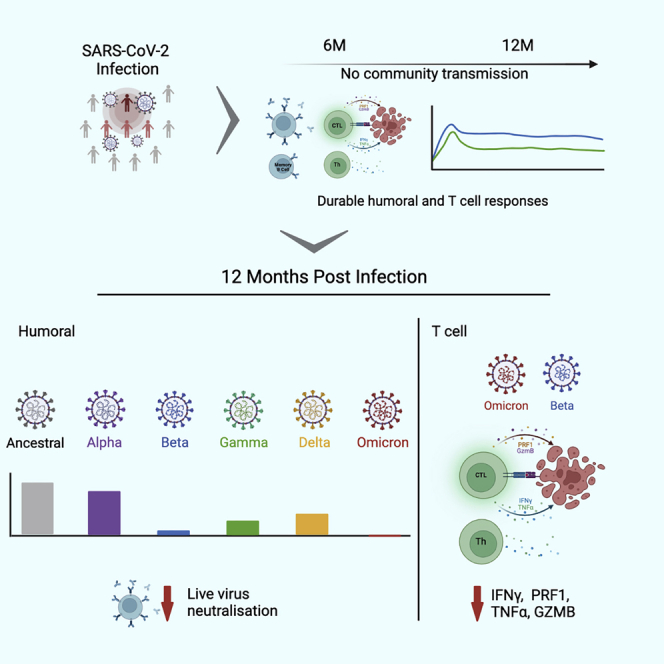
Coronavirus disease 2019 (COVID-19) convalescents living in regions with low vaccination rates rely on post-infection immunity for protection against re-infection with severe acute respiratory syndrome coronavirus 2 (SARS-CoV-2). We evaluate humoral and T cell immunity against five variants of concern (VOCs) in mild-COVID-19 convalescents at 12 months after infection with ancestral virus. In this cohort, ancestral, receptor-binding domain (RBD)-specific antibody and circulating memory B cell levels are conserved in most individuals, and yet serum neutralization against live B.1.1.529 (Omicron) is completely abrogated and significantly reduced for other VOCs. Likewise, ancestral SARS-CoV-2-specific memory T cell frequencies are maintained in >50% of convalescents, but the cytokine response in these cells to mutated spike epitopes corresponding to B.1.1.529 and B.1.351 (Beta) VOCs were impaired. These results indicate that increased antigen variability in VOCs impairs humoral and spike-specific T cell immunity post-infection, strongly suggesting that COVID-19 convalescents are vulnerable and at risk of re-infection with VOCs, thus stressing the importance of vaccination programs.

Keywords: SARS-CoV-2; T cell immunity; Variant of Concern; antibody response; antigen drift; memory B cells; virus neutralization.


Conflict of interest statement

Declaration of interests A.S. is currently a consultant for Gritstone, Flow Pharma, Arcturus, Epitogenesis, Oxfordimmunotech, Caprion, and Avalia. La Jolla Institute for Immunology (A.S. and D.W.) has filed for patent protection for various aspects of T cell epitope and vaccine design work. P.G.-V., C.M.H., M.G.M., A.E.L.Y., H.B., Z.A.M., Z.A.-D., A. Abayasingam, D.A., A.O.S., A. Aggarwal, G.B., J.G., C.F., S.O., E.M.M., D.J.L., G.M., E.J.G., B.A.J.R., D.S., C.K.-L., S.G.T., M.R.B., D.W., R.A.B., S.C.B., and B.G.-B. declare no conflicts of interest.

Figures

None
Graphical abstract
Figure 1
Figure 1
Circulating RBD-specific antibodies, memory B cell frequency, and serum SARS-CoV-2 neutralization activity at 12 months after PCR positive test (A) Forty-three SARS-CoV-2-infected individuals who presented mild-COVID-19 symptoms were recruited after a PCR positive test, and serum and peripheral blood mononuclear cells (PBMCs) were sampled at 6 and 12 months. (B) Serum RBD-specific antibody titers, per Ig isotype, reported as area under the curve (AUC) units. Circles represent AUC individual patient values (n = 43 at 6 months, orange, and 12 months, yellow, n = 15 for healthy controls, blue), with mean value denoted by a horizontal black line. Seronegative samples were assigned a value of 0.001 for data visualization purposes. (C) SARS-CoV-2 RBD-specific (n = 28) memory B cells (CD27+) were quantified 12 months post-infection with corresponding specific tetramers and further characterized as IgG+. Cell-population-specific background (45.8) was calculated with healthy control PBMCs and shown as a red dashed line. Boxplot shows the 5th–95th percentile range indicating the median value (horizontal line). (D) Serum neutralization ID50 of SARS-CoV-2 and murine leukemia virus (MLV) pseudovirus particles expressing infectious homologous Spike sequence (Wuhan) in mild-COVID-19 convalescent sera (n = 42) at 12 months after positive COVID-19 test. Positive neutralization percentage (indicated above figure) activity cutoff (ID50 = 22.61) was calculated from 19 healthy control samples and is shown as a red dashed line. (E) Patient serum neutralization end-point cut-off titers (highest dilution factor that yields ≥50% inhibition of cell death after live-virus infection) at 12 months against Wuhan, B.1.1.7, B.1.351, P.1, B.1.617.2, and B.1.1.529 live-virus particles. Twenty or 40 was the initial dilution for all serum samples. Neutralization activity was considered negative, value of zero, when neutralization of initial serum dilution was <50%. ∗p < 0.05, ∗∗p < 0.01, ∗∗∗p < 0.001, and ∗∗∗∗p < 0.0001. ns, not significant. The percentage of convalescents with neutralization activity is indicated for each VOC in the corresponding x axis labels.
Figure 2
Figure 2
SARS-CoV-2-specific CD4+ and CD8+ T cell frequencies in mild-COVID-19 convalescents at 6 and 12 months after PCR positive test (A) Percentage of activated CD4+ T cells (OX40+CD137+) after stimulation with spike, non-spike, and cumulative (spike + non-spike) antigen peptide pools within the total CD3+CD4+ T cell population of PBMCs in individual mild-COVID-19 patients (n = 43) at 6 and 12 months after COVID-19 positive test (orange and yellow) and healthy controls (n = 15, in blue). (B) Percentage of activated CD8+ T cells (CD69+CD137+) after stimulation with spike, whole proteome, and A and B antigen peptide pools within the total CD3+CD8+ T cell population of PBMCs in same samples as in (A). Dots in (A) represent patient or healthy control individual values. Averages are denoted by a horizontal line, and statistically significant differences between patient and healthy controls are indicated by asterisks. ∗p < 0.05, ∗∗p < 0.01, ∗∗∗p < 0.001, and ∗∗∗∗p < 0.0001. ns, not significant.
Figure 3
Figure 3
Memory immunophenotyping and quantification of SARS-CoV-2-specific CD4+ T cells in mild-COVID-19 convalescents at 6 and 12 months after PCR positive test (A) Memory immunophenotype based on expression of surface CCR7 and CD45RA of SARS-CoV-2 spike-, non-spike-, and cumulative (spike + non-spike)-specific CD4+ T cells detected in Figure 2A. Cells were classified as follows: naive T cells (TNs; CCR7+CD45RA+), central memory T cells (TCMs; CCR7+CD45RA-), effector memory T cells (TEMs; CCR7-CD45RA-), and terminally differentiated effector memory cells re-expressing CD45RA (TEMRAs; CCR7-CD45RA+). Frequencies are indicated as the percentage of total SARS-CoV-2 antigen-specific CD4+ T cells within the total pool of immune cells with same phenotype in the patient’s PBMCs. (B) Doughnut charts indicating the proportion (%) of each immune phenotype in (A) of the total of SARS-CoV-2-specific CD4+ T cells for each antigen. In (A), circles represent patient individual values. Averages are denoted by a horizontal line, and statistically significant differences between time points are indicated by asterisks. ∗p < 0.05 and ∗∗p < 0.01. ns, not significant.
Figure 4
Figure 4
Memory immunophenotyping and quantification of SARS-CoV-2-specific CD8+ T cells in mild-COVID-19 convalescents at 6 and 12 months after PCR positive test (A) Memory immunophenotype based on expression of surface CCR7 and CD45RA of SARS-CoV-2 spike- and whole proteome pools A- and B-specific CD8+ T cells detected in Figure 2B. Immune phenotypes were defined as in Figure 3. Frequencies are indicated as the percentage of total SARS-CoV-2 antigen-specific CD8+ T cells within the total pool of immune cells with same phenotype in the patient’s PBMCs. (B) Doughnut charts indicating the proportion (%) of each immune phenotype in (A) of the total of SARS-CoV-2-specific CD8+ T cells for each antigen. In (A), circles represent patient individual values. Averages are denoted by a horizontal line, and statistically significant differences between time points are indicated by asterisks. ∗∗∗p < 0.05 and ∗∗∗∗p < 0.01. ns, not significant.
Figure 5
Figure 5
Cytokine expression and circulating T follicular helper cell frequencies in convalescents with strong T cell immune responses to SARS-CoV-2 spike protein (A) Fifteen Spike high-responder convalescents exhibiting high spike-specific CD4+ and CD8+ T cell frequencies in the AIM assay (Figure 2) were further analyzed for spike-specific cTFH and intracellular cytokine staining (ICS) analysis using the whole spike peptide pool. (B) Frequency of circulating spike-specific T follicular helper cells (CD4+CXCR5+iCD154+) in healthy controls (n = 15) and selected high-responder convalescents (n = 15) and percentage of IFNγ+ cells. (C) Percentage of cytokine-positive expression in CD3+CD4+iCD154+ T cells in the same individuals as (B). (D) Percentage of cytokine-positive expression in CD3+CD8+ T cells in the same individuals as (B). In (B)–(D), circles represent healthy or patient individual values. Averages are denoted by a horizontal line, and statistically significant differences between time points are indicated by asterisks. ∗∗p < 0.01 and ∗∗∗p < 0.001. ns, not significant.
Figure 6
Figure 6
Specific T cell responses in responder convalescents to mutated spike amino-acid sequences in VOCs (A) PBMCs from spike high responders (n = 15, same as in Figure 5) were stimulated with peptides covering mutated spike regions in VOCs, and cytokine expression was measured by ICS. (B) Fold-change cytokine expression in CD3+CD4+iCD154+ T cells. Negative folds denote decrease in cytokine expression when stimulated with mutated peptide pools. Dotted lines indicate folds (-1 and 1, no change). Boxplots represent interquartile-range values, and whiskers represent minimum and maximum values. Horizontal lines and crosses inside boxplots denote median and mean values, respectively. (C) Fold-change cytokine expression in CD3+CD8+ T cells. Negative folds denote decrease in cytokine expression when stimulated with mutated peptide pools. Dotted lines indicate folds (−1 and 1, no change). Boxplots represent interquartile-range values, and whiskers represent minimum and maximum values. Horizontal lines and crosses inside boxplots denote median and mean values, respectively. (Statistically significant differences between variants for each cytokine and cell type are indicated by asterisks. ∗p < 0.05, ∗∗p < 0.01, and ∗∗∗p < 0.001.
Figure 7
Figure 7
Multiple immune-correlate analysis (A) Correlations among metrics available for the full cohort (n- = 43) were analyzed and plotted as described in the STAR methods. Metrics excluded in the matrix chart were sex, age (for lack of correlation), and Omicron neutralization (all values = 0). (B) Correlation matrix of T cell frequency data from AIM data from Figure 2. (C) Correlation matrix of high-responder, T cell, and ICS data from Figure 5.

References

    1. Zhou P., Yang X.L., Wang X.G., Hu B., Zhang L., Zhang W., Si H.R., Zhu Y., Li B., Huang C.L., et al. A pneumonia outbreak associated with a new coronavirus of probable bat origin. Nature. 2020;579:270–273. doi: 10.1038/s41586-020-2012-7. - DOI - PMC - PubMed
    1. Huang X., Shao X., Xing L., Hu Y., Sin D.D., Zhang X. The impact of lockdown timing on COVID-19 transmission across US counties. EClinicalMedicine. 2021;38:101035. doi: 10.1016/j.eclinm.2021.101035. - DOI - PMC - PubMed
    1. Rossman H., Shilo S., Meir T., Gorfine M., Shalit U., Segal E. COVID-19 dynamics after a national immunization program in Israel. Nat. Med. 2021;27:1055–1061. doi: 10.1038/s41591-021-01337-2. - DOI - PubMed
    1. Barandalla I., Alvarez C., Barreiro P., de Mendoza C., González-Crespo R., Soriano V. Impact of scaling up SARS-CoV-2 vaccination on COVID-19 hospitalizations in Spain. Int. J. Infect. Dis. 2021;112:81–88. doi: 10.1016/j.ijid.2021.09.022. - DOI - PMC - PubMed
    1. Pritchard E., Matthews P.C., Stoesser N., Eyre D.W., Gethings O., Vihta K.-D., Jones J., House T., VanSteenHouse H., Bell I., et al. Impact of vaccination on new SARS-CoV-2 infections in the United Kingdom. Nat. Med. 2021;27:1370–1378. doi: 10.1038/s41591-021-01410-w. - DOI - PMC - PubMed

Publication types

Substances

Supplementary concepts