. 2022 Sep:258:119342.
doi: 10.1016/j.neuroimage.2022.119342. Epub 2022 May 30.

Developmental organization of neural dynamics supporting auditory perception

Affiliations

Developmental organization of neural dynamics supporting auditory perception

Kazuki Sakakura et al. Neuroimage. 2022 Sep.

Abstract

Purpose: A prominent view of language acquisition involves learning to ignore irrelevant auditory signals through functional reorganization, enabling more efficient processing of relevant information. Yet, few studies have characterized the neural spatiotemporal dynamics supporting rapid detection and subsequent disregard of irrelevant auditory information, in the developing brain. To address this unknown, the present study modeled the developmental acquisition of cost-efficient neural dynamics for auditory processing, using intracranial electrocorticographic responses measured in individuals receiving standard-of-care treatment for drug-resistant, focal epilepsy. We also provided evidence demonstrating the maturation of an anterior-to-posterior functional division within the superior-temporal gyrus (STG), which is known to exist in the adult STG.

Methods: We studied 32 patients undergoing extraoperative electrocorticography (age range: eight months to 28 years) and analyzed 2,039 intracranial electrode sites outside the seizure onset zone, interictal spike-generating areas, and MRI lesions. Patients were given forward (normal) speech sounds, backward-played speech sounds, and signal-correlated noises during a task-free condition. We then quantified sound processing-related neural costs at given time windows using high-gamma amplitude at 70-110 Hz and animated the group-level high-gamma dynamics on a spatially normalized three-dimensional brain surface. Finally, we determined if age independently contributed to high-gamma dynamics across brain regions and time windows.

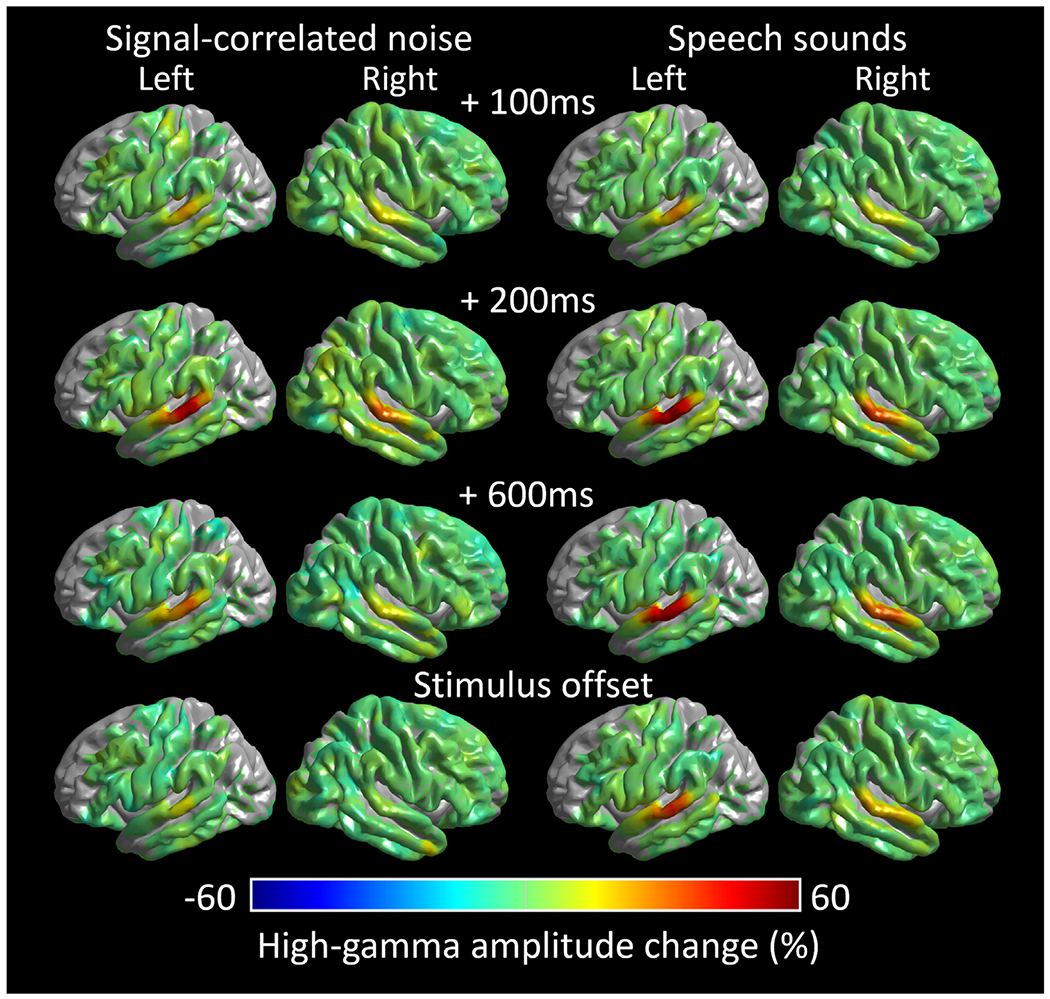
Results: Group-level analysis of noise-related neural costs in the STG revealed developmental enhancement of early high-gamma augmentation and diminution of delayed augmentation. Analysis of speech-related high-gamma activity demonstrated an anterior-to-posterior functional parcellation in the STG. The left anterior STG showed sustained augmentation throughout stimulus presentation, whereas the left posterior STG showed transient augmentation after stimulus onset. We found a double dissociation between the locations and developmental changes in speech sound-related high-gamma dynamics. Early left anterior STG high-gamma augmentation (i.e., within 200 ms post-stimulus onset) showed developmental enhancement, whereas delayed left posterior STG high-gamma augmentation declined with development.

Conclusions: Our observations support the model that, with age, the human STG refines neural dynamics to rapidly detect and subsequently disregard uninformative acoustic noises. Our study also supports the notion that the anterior-to-posterior functional division within the left STG is gradually strengthened for efficient speech-sound perception after birth.

Keywords: Electrocorticography (ECoG); Event-related high-gamma synchronization; Intracranial electroencephalography (EEG) recording; Language acquisition; Neural pruning; Neurolinguistics; Ontogeny; Pediatric epilepsy surgery; Physiological high-frequency oscillations (HFOs); Subdural grid electrodes.


Conflict of interest statement

Declaration of Competing Interest The authors have no conflicts of interest to report. We confirm that we have read the Journal's position on issues involved in ethical publication and affirm that this report is consistent with those guidelines.

Figures

Fig. 1.
Fig. 1.. Sound stimuli and analysis time windows.
(A) forward speech, (B) backward-played speech, and (C) signal-correlated noise sound waves. The analysis periods of interest included (D) a 600-ms period immediately after the stimulus onset (colored in orange) and (E) another 600-ms immediately before the stimulus offset (colored in light blue).
Fig. 2.
Fig. 2.. Delineation of the pial surface in young children.
(A) The FreeSurfer software package automatically delineated the pial surface in a 3-year-old child, as denoted by yellow lines. (B) The FreeSurfer software package failed to outline the pial surface automatically; the performance was worst in the temporal lobe (arrow) in a 2-year-old child. (C) Using the FreeSurfer Control Point function, therefore, a board-certified neurosurgeon (K.S.) needed to delineate the pial surface manually. This function allowed us to accurately delineate the pial surface, as denoted by an arrowhead.
Fig. 3.
Fig. 3.. Spatial distribution of intracranial electrode sampling.
A total of 2039 non-epileptic subdural electrode sites were available for analysis.
Fig. 4.
Fig. 4.. Each region of interest (ROI) in the superior temporal gyrus (STG).
(A) The left STG was divided into nine ROIs, as coded in different colors. The most posterior STG electrode site was located at 88.6 mm normalized distance from the temporal lobe tip. (B) The right STG was divided into eight ROIs. The most posterior STG electrode site was located at 79.9 mm normalized distance from the tip. The number of non-epileptic analysis meshes at each ROI is provided (with the number of contributing patients). Each “analysis mesh” consisted of an aggregate of 20 neighboring FreeSurfer vertex finite elements (Desikan et al., 2006). For example, a total of 19 patients contributed iEEG measures to the right STG50–60 mm (defined as the right STG 50–60 mm normalized distance from the tip), which had 27.9 analysis meshes per patient on average.
Fig. 5.
Fig. 5.. Dynamics of sound-related high-gamma responses.
Left: Group-level high-gamma modulations elicited by signal-correlated noises. Right: High-gamma modulations elicited by speech sound stimuli (i.e., average during forward and backward speech sound presentations). (A) 100 ms post-stimulus onset. (B) 200 ms post-stimulus onset. (C) 600 ms post-stimulus onset. (D) stimulus offset. Video S1 shows the high-gamma dynamics at the whole-brain level.
Fig. 6.
Fig. 6.. Sound-related high-gamma responses in the superior temporal gyrus (STG).
Left: Noise-related high-gamma amplitude (% change) as a function of time (ms) in the left (see A and C) and right STG (E and G). Right: Speech sound-related high-gamma amplitude in the left (B and D) and right STG (F and H). Upper horizontal bars: Significant amplitude augmentation based on the permutation test. Left STG40–80 mm showed sustained speech sound-related high-gamma augmentation initiating within 90 ms post-stimulus onset and lasted until the stimulus offset. In contrast, the left STG80–90 mm showed high-gamma augmentation lasting only between 70 and 360 ms post-stimulus onset (see the black horizontal bar in B). Fig. S1 presents the high-gamma dynamics using two-dimensional plots.
Fig. 7.
Fig. 7.. Developmental changes of sound-related high-gamma dynamics in the superior temporal gyrus (STG).
Each matrix and brain surface image present the mixed model effect of √age (% / year) on high-gamma amplitude at a given 50-ms time window at each STG region of interest (ROI). (A and B) The significant √age effect on noise-related high-gamma responses in the left and right STG (see the data source in Fig. 8A and 8B). (C and D) The significant √age effect on speech sound-related high-gamma responses in the left and right STG (see the data source in Fig. 8C and 8D).
Fig. 8.
Fig. 8.. Developmental changes of noise-related high-gamma amplitude responses in the superior temporal gyrus (STG).
Each scatter plot shows the relationship between the square-root (√) of age and high-gamma amplitude response at a given region of interest (ROI) in the STG. X-axis: √age of a given patient (√year). Y-axis: High-gamma amplitude response (% change). Pink line: Univariate linear regression line in the model with √age treated as the independent variable and high-gamma amplitude response treated as the dependent variable. Scatter plots highlighted by red- and blue-colored backgrounds denote the timing and ROI showing significant positive and negative effects of √age on the degree of high-gamma augmentation, respectively, with the independent effects of sleep state, clinical profiles, and epilepsy-related variables controlled by the mixed model analysis (Fig. 7). Zoomed is one of the plots showing a significant correlation between √age and high-gamma amplitude responses on both univariate linear regression and mixed model analyses. (Upper) Noise-related high-gamma responses in the left and right STG. (Lower) Speech sound-related high-gamma responses in the left and right STG. Note that the cluster-based test was employed to correct for 84-time comparisons for the left STG analysis and 72 times for the right STG.

Similar articles

Cited by

References

    1. Akanuma N, Alaróon G, Lum F, Kissani N, Koutroumanidis M, Adachi N, Binnie CD, Polkey CE, Morris RG, 2003. Lateralising value of neuropsychological protocols for presurgical assessment of temporal lobe epilepsy. Epilepsia 44, 408–418. doi:10.1046/j.1528-1157.2003.24502.x. - DOI - PubMed
    1. Albrecht R, Suchodoletz W, Uwer R, 2000. The development of auditory evoked dipole source activity from childhood to adulthood. Clin. Neurophysiol 111, 2268–2276. doi:10.1016/s1388-2457(00)00464-8. - DOI - PubMed
    1. Asano E, Juhász C, Shah A, Sood S, Chugani HT, 2009. Role of subdural electrocorticography in prediction of long-term seizure outcome in epilepsy surgery. Brain 132, 1038–1047. doi:10.1093/brain/awp025. - DOI - PMC - PubMed
    1. Baumgarten TJ, Maniscalco B, Lee JL, Flounders MW, Abry P, He BJ, 2021. Neural integration underlying naturalistic prediction flexibly adapts to varying sensory input rate. Nat. Commun 12, 2643. doi:10.1038/s41467-021-22632-z. - DOI - PMC - PubMed
    1. Bilecen D, Seifritz E, Scheffler K, Henning J, Schulte AC, 2002. Amplitopicity of the human auditory cortex: an fMRI study. Neuroimage 17, 710–718 . - PubMed

Publication types