. 2022 Aug 3;82(15):2792-2806.
doi: 10.1158/0008-5472.CAN-21-2318.

Intratumoral Resolution of Driver Gene Mutation Heterogeneity in Renal Cancer Using Deep Learning

Affiliations

Intratumoral Resolution of Driver Gene Mutation Heterogeneity in Renal Cancer Using Deep Learning

Paul H Acosta et al. Cancer Res. .

Abstract

Intratumoral heterogeneity arising from tumor evolution poses significant challenges biologically and clinically. Dissecting this complexity may benefit from deep learning (DL) algorithms, which can infer molecular features from ubiquitous hematoxylin and eosin (H&E)-stained tissue sections. Although DL algorithms have been developed to predict some driver mutations from H&E images, the ability of these DL algorithms to resolve intratumoral mutation heterogeneity at subclonal spatial resolution is unexplored. Here, we apply DL to a paradigm of intratumoral heterogeneity, clear cell renal cell carcinoma (ccRCC), the most common type of kidney cancer. Matched IHC and H&E images were leveraged to develop DL models for predicting intratumoral genetic heterogeneity of the three most frequently mutated ccRCC genes, BAP1, PBRM1, and SETD2. DL models were generated on a large cohort (N = 1,282) and tested on several independent cohorts, including a TCGA cohort (N = 363 patients) and two tissue microarray (TMA) cohorts (N = 118 and 365 patients). These models were also expanded to a patient-derived xenograft (PDX) TMA, affording analysis of homotopic and heterotopic interactions of tumor and stroma. The status of all three genes could be inferred by DL, with BAP1 showing the highest sensitivity and performance within and across tissue samples (AUC = 0.87-0.89 on holdout). BAP1 results were validated on independent human (AUC = 0.77-0.84) and PDX (AUC = 0.80) cohorts. Finally, BAP1 predictions correlated with clinical outputs such as disease-specific survival. Overall, these data show that DL models can resolve intratumoral heterogeneity in cancer with potential diagnostic, prognostic, and biological implications.

Significance: This work demonstrates the potential for deep learning analysis of histopathologic images to serve as a fast, low-cost method to assess genetic intratumoral heterogeneity. See related commentary by Song et al., p. 2672.


Conflict of interest statement

Conflict of Interest Disclosure Statement: The authors declare no potential conflicts of interest.

Figures

Figure 1.
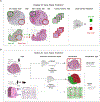
Figure 1.. Overview
a, Strategy for training deep learning networks to predict gene mutation status (Loss or WT) from H&E images. Nuclear signal of Immunohistochemistry (IHC) antibodies previously developed to identify the presence/absence of target, serves as a ground truth for gene loss status across different areas of a slide. 224x224-pixel at 20x (111x111 microns) H&E-stained patches assigned ground truth labels based on matching IHC slides are used to train the deep learning networks. b, Predictions are performed at two scales: 1) whole slide: where we detect whether any part of the slide (even a minority of tissue), exhibits loss or not, and 2) region: where we predict the areas within a slide that exhibit gene loss (applicable to whole slide images and tumor microarrays).
Figure 2.
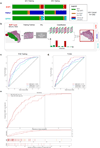
Figure 2.. Slide Level Workflow and Performance
a, The WSI cohort was divided into a 60-40 (Training/Testing) split, with similar proportions of Wild Type (WT), Universal Loss (UL), and Localized Loss (LL) samples for all three driver genes in both splits. b, A Multiple Instance Learning (MIL) approach was used to train the slide classification model to detect the presence of gene loss even if the loss is only present in a minority of tissue. Patches from the same sample are analyzed individually for their mutation status and their importance to a prediction (based on attention mechanism, a sub-network which learns how much weight to give to each patch, see Methods, Supplementary Fig 4). Predictions from the patches in a slide are aggregated, while accounting for the importance of each patch, to provide a mutational status prediction for the whole slide. Independent models are constructed for each gene. c, Receiver operating characteristic (ROC) curves for three driver mutations- BAP1, PBRM1, SETD2- for whole slide prediction in WSI Testing (i.e., the held-out portion of our WSI cohort). d, Same as c but using the TCGA cohort. e, Proportion of BAP1 Loss samples captured (i.e., sensitivity; Y-axis, top plot) by preferential selection of samples based on the model’s assessment of loss likelihood. Shared x-axis represents samples ranked by BAP1 activation, with samples on left mostly likely to exhibit loss for each cohort (WSI-solid, TCGA-dashed). Dashed horizontal and vertical lines indicate 96% sensitivity and the fraction of samples needed to achieve this sensitivity in the two cohorts respectively. The middle plot shows the corresponding activations (Y-axis; middle) with higher values indicating higher model certainty of being WT. Bottom two bars indicate the BAP1 status (white-WT, red-UL, orange-LL only for WSI cohort) of the samples for the WSI and TCGA cohorts respectively.
Figure 3.
Figure 3.. Predicting at high spatial resolution allows us to probe tissue heterogeneity (region level performance)
a-e, Process of BAP1 region classification model demonstrated on a sample slide with both BAP1 WT (green) and Loss (red) regions. a, H&E sample input for region classification model. b, Activation map from the consensus (i.e., average of multiple models) region classification prediction for the entire slide. c, Regional activation map derived from raw activation map. Ignoring any non-tumor tissue, the region scores are calculated by creating a tumor grid of the activation map and averaging the prediction scores within each grid square. d, Model predictions: discrete calls (Loss or WT) based on binarizing regional activations. e, Ground truth map for BAP1 mutation status on H&E image based on IHC sectioned into a regional grid. f, ROC curves from region score analysis for BAP1, PBRM1, and SETD2.
Figure 4.
Figure 4.. Region classification validation on external cohorts
BAP1 region classification model was applied to two additional cohorts: a human cohort (TMA1) and a PDX cohort (PDX1). a, c, Example areas from BAP1 activation maps for region level predictions in TMA1 and PDX1 TMA slides showing consensus prediction scores for each TMA core. The colors of the bounding boxes for each core indicate the gene-loss ground truth acquired from the IHC (cores lacking a box are those that failed quality control). b, BAP1 ROC curves for the human TMA1 and the PDX1 samples. Each core contributes a single point to the AUC curve based on the average activation across its all tissue (excludes any background activation). Cores that did not pass our quality control criteria (Methods) (lacking outer box) were not used in the ROC analysis.
Figure 5.
Figure 5.. Interpretation of Results
a, Measuring classification independence for BAP1 loss and PBRM1 loss calls in WSI cohort. (BOTTOM) Relationship between BAP1 Loss ranking (X-axis, points on right are highest confidence BAP1 loss) and PBRM1 Loss ranking (Y-axis, points on top are highest confidence PBRM1 loss) based on slide model activations. Each dot represents a single sample color-coded based on its true loss status for BAP1 and PBRM1 as indicated in the legend. (TOP) Distribution of BAP1 confidence rankings for different genotypes. Each line in the rug plot indicates the genotype of a single sample, and the curves represent kernel density estimates of the ranking distribution for a single genotype. b, Effect of BAP1 and PBRM1 mutations on selected nuclear features. For each H&E slide in the WSI cohort, nuclei were segmented, nuclear image features were extracted from each nucleus and averaged across all nuclei in tumor region. Density plots show the distribution of average nuclear bounding box area (x-axis, Supp. Fig. 15a) and hematoxylin intensity (y-axis; see Supp Fig. 15d, Supp. Table 4 for details of feature calculation) across Loss and WT forms of BAP1 (top) and PBRM1 (bottom). c, BAP1 classification goes beyond tumor grade. Box-whisker plot where each point represents a single patient from the TMA2 cohort, with background bar color reflecting true BAP1 status, and y-axis indicating model assessment (activation) of BAP1 status (higher indicates more likely WT). Points are grouped by grade (low grades 1-2 and high grades 3-4) and BAP1 status (loss/WT). p-values calculated using Mann-Whitney test with Bonferroni correction. d, Disease Specific Survival curves stratified by predicted (solid lines) and true (dashed lines) BAP1 mutation status for patients from the TMA2 cohort. True BAP1 Loss (red) or True BAP1 WT (green) was assigned based on patient level IHC assessment. The output of the BAP1 model is an activation score between 0 and 1, rather than a loss status. Patients were classified as Predicted BAP1 Loss if any punch from that patient exhibited an activation below 0.5 and as Predicted BAP1 WT otherwise.

Comment in

References

    1. Dagogo-Jack I, Shaw AT. Tumour heterogeneity and resistance to cancer therapies. Nat Rev Clin Oncol 2018;15:81–94 - PubMed
    1. Lawson DA, Kessenbrock K, Davis RT, Pervolarakis N, Werb Z. Tumour heterogeneity and metastasis at single-cell resolution. Nat Cell Biol 2018;20:1349–60 - PMC - PubMed
    1. Massague J, Obenauf AC. Metastatic colonization by circulating tumour cells. Nature 2016;529:298–306 - PMC - PubMed
    1. Turajlic S, Xu H, Litchfield K, Rowan A, Horswell S, Chambers T, et al. Deterministic Evolutionary Trajectories Influence Primary Tumor Growth: TRACERx Renal. Cell 2018;173:595–610 e11 - PMC - PubMed
    1. Hao JJ, Lin DC, Dinh HQ, Mayakonda A, Jiang YY, Chang C, et al. Spatial intratumoral heterogeneity and temporal clonal evolution in esophageal squamous cell carcinoma. Nat Genet 2016;48:1500–7 - PMC - PubMed

Publication types