A global comparison of building decarbonization scenarios by 2050 towards 1.5-2 °C targets
- PMID: 35654775
- PMCID: PMC9163154
- DOI: 10.1038/s41467-022-29890-5
A global comparison of building decarbonization scenarios by 2050 towards 1.5-2 °C targets
Abstract
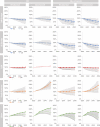
Buildings play a key role in the transition to a low-carbon-energy system and in achieving Paris Agreement climate targets. Analyzing potential scenarios for building decarbonization in different socioeconomic contexts is a crucial step to develop national and transnational roadmaps to achieve global emission reduction targets. This study integrates building stock energy models for 32 countries across four continents to create carbon emission mitigation reference scenarios and decarbonization scenarios by 2050, covering 60% of today's global building emissions. These decarbonization pathways are compared to those from global models. Results demonstrate that reference scenarios are in all countries insufficient to achieve substantial decarbonization and lead, in some regions, to significant increases, i.e., China and South America. Decarbonization scenarios lead to substantial carbon reductions within the range projected in the 2 °C scenario but are still insufficient to achieve the decarbonization goals under the 1.5 °C scenario.
© 2022. The Author(s).
Conflict of interest statement
The authors declare no competing interests.
Figures


References
-
- International Energy Agency (IEA). World Energy Outlook 2021. https://www.iea.org/reports/world-energy-outlook-2021.
-
- Ürge-Vorsatz D, Cabeza LF, Serrano S, Barreneche C, Petrichenko K. Heating and cooling energy trends and drivers in buildings. Renew. Sustain. Energy Rev. 2015;41:85–98. doi: 10.1016/j.rser.2014.08.039. - DOI
-
- Riahi K, et al. The shared socioeconomic pathways and their energy, land use, and greenhouse gas emissions implications: An overview. Glob. Environ. Chang. 2017;42:153–168. doi: 10.1016/j.gloenvcha.2016.05.009. - DOI
-
- Levesque A, et al. How much energy will buildings consume in 2100? A global perspective within a scenario framework. Energy. 2018;148:514–527. doi: 10.1016/j.energy.2018.01.139. - DOI
-
- Wang H, Chen W, Shi J. Low carbon transition of global building sector under 2- and 1.5-degree targets. Appl. Energy. 2018;222:148–157. doi: 10.1016/j.apenergy.2018.03.090. - DOI

