. 2022 Jun 2;8(1):17.
doi: 10.1038/s41526-022-00205-8.

Adaptation to simulated microgravity in Streptococcus mutans

Affiliations

Adaptation to simulated microgravity in Streptococcus mutans

Mizpha C Fernander et al. NPJ Microgravity. .

Abstract

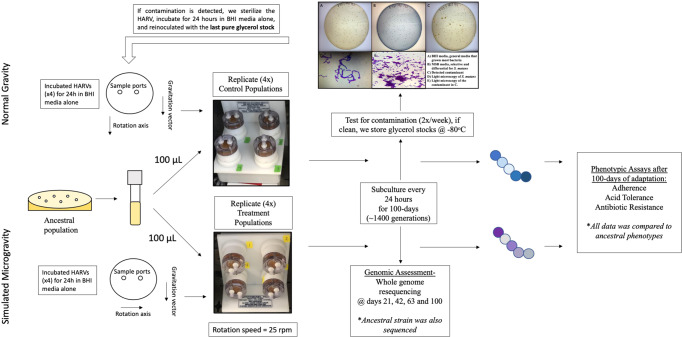
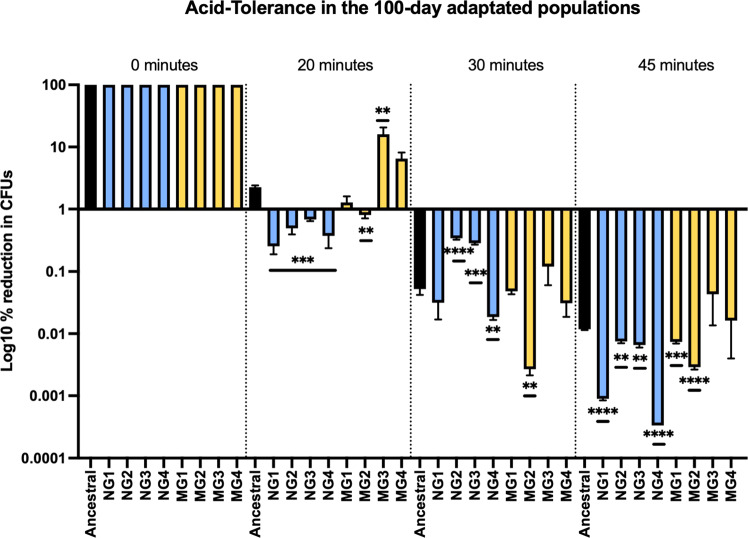
Long-term space missions have shown an increased incidence of oral disease in astronauts' and as a result, are one of the top conditions predicted to impact future missions. Here we set out to evaluate the adaptive response of Streptococcus mutans (etiological agent of dental caries) to simulated microgravity. This organism has been well studied on earth and treatment strategies are more predictable. Despite this, we are unsure how the bacterium will respond to the environmental stressors in space. We used experimental evolution for 100-days in high aspect ratio vessels followed by whole genome resequencing to evaluate this adaptive response. Our data shows that planktonic S. mutans did evolve variants in three genes (pknB, SMU_399 and SMU_1307c) that can be uniquely attributed to simulated microgravity populations. In addition, collection of data at multiple time points showed mutations in three additional genes (SMU_399, ptsH and rex) that were detected earlier in simulated microgravity populations than in the normal gravity controls, many of which are consistent with other studies. Comparison of virulence-related phenotypes between biological replicates from simulated microgravity and control orientation cultures generally showed few changes in antibiotic susceptibility, while acid tolerance and adhesion varied significantly between biological replicates and decreased as compared to the ancestral populations. Most importantly, our data shows the importance of a parallel normal gravity control, sequencing at multiple time points and the use of biological replicates for appropriate analysis of adaptation in simulated microgravity.


Conflict of interest statement

The authors declare no competing interests

Figures

Fig. 1
Fig. 1. Experimental methods.
Schematic representation of the experimental evolution workflow used to adapt Streptococcus mutans to simulated microgravity.
Fig. 2
Fig. 2. Adhesion phenotypes vary between biological replicates.
Sucrose-dependent (SDA) was assessed after (a) 24- and (b) 48 h of static growth in BHI supplemented with 0.1% sucrose using the 100-day populations. Sucrose-independent adhesion (SIA) was assessed after (c) 24- and (d) 48 h of static growth in BHI supplemented with 0.1% glucose using the 100-day populations. Data was plotted in GraphPad Prism ® 9.2.0 and unpaired t-tests with 95% confidence were used to calculate significant differences for pairwise comparisons between the ancestral and each treatment populations. Error bars are s.e.m. and significance is reported as a two-tailed p-value where *p ≤ 0.05, **p ≤ 0.01, ***p ≤ 0.001 and ****p ≤ 0.0001.
Fig. 3
Fig. 3. Acid-tolerance changes as a result of simulated microgravity.
We assessed changes in acid-tolerance after adaptation to both normal (blue) and simulated microgravity (yellow) and compared it to that of the ancestral (black). The 100-day populations were exposed to an acidic environment (glycine pH 2.8) for 0, 10, 20, and 45 min, rescued, serial diluted and CFUs were counted after 48 h of growth on BHI agar plates. The CFU counts at the 0-time point were then normalized to 100% and the % reduction was then calculated by dividing the CFU count at the indicated time points by the CFU count at 0. The values were then plotted on a log10 scale to visualize the data. Data was plotted in GraphPad Prism ® 9.2.0 and unpaired t-tests with 95% confidence were used to calculate significant differences for pairwise comparisons between the ancestral and each treatment populations. Error bars are s.e.m. and significance is reported as a two-tailed p-value where *p ≤ 0.05, **p ≤ 0.01, ***p ≤ 0.001 and ****p ≤ 0.0001.
Fig. 4
Fig. 4. Populations in simulated microgravity accumulate less mutations.
The number of accumulated mutations were plotted for each normal gravity population (blue dotted lines) and each simulated microgravity population (yellow dotted lines) for each sequencing time point. The mean (solid lines) and standard deviation (error bars) were then plotted for each environment. Linear regression determined slopes were significantly different (p < 0.0001). Data was plotted and statistical analysis were performed in GraphPad Prism ® 9.2.0. significance is reported as a two-tailed p-value where *p ≤ 0.05, **p ≤ 0.01, ***p ≤ 0.001 and ****p ≤ 0.0001.
Fig. 5
Fig. 5. Unique genomic variants map to distinct regions of adapted genes.
a pknB acquired mutations that were unique to either simulated microgravity (green) or normal gravity (blue). Here we mapped all mutations detected (excluding nonsense mutations, as they lead to a premature stop codon which results in a shortened, and most often, nonfunctional protein product) at all four sequencing time points onto a homolog from Staphylococcus aureus (PDB 4EQM [https://www.rcsb.org/structure/4EQM]) as there were no solved Streptococcus homologues in the database. b ptsH acquired the same SNP in both normal gravity and simulated microgravity (G54A/V-orange). This specific residue has been shown to be important for protein-protein interactions (PDB 1PTF [https://www.rcsb.org/structure/1PTF]). c rex acquired a total of 12 unique variants in simulated microgravity (green), 5 unique variants in normal gravity (blue) with 3 variants in common (orange). Variants mapped onto the homologous Streptococcus agalactiae structure (PDB 3KET [https://www.rcsb.org/structure/3KET]) show that they both interact directly with the DNA substrate. All structural figures were generated using The PyMOL™ Molecular Graphics System, Version 2.4.1, Schrödinger, LLC.

References

    1. McPhee, J. C. & Charles, J. B. Human health and performance risks of space exploration missions: evidence reviewed by the NASA human research program (US NASA, Houston, TX, 2009).
    1. Thirsk R, Kuipers A, Mukai C, Williams D. The space-flight environment: the International Space Station and beyond. CMAJ. 2009;180:1216–1220. doi: 10.1503/cmaj.081125. - DOI - PMC - PubMed
    1. Pierson, D. L. Microbial contamination of spacecraft. Gravit. Space Res. 14 (2007). - PubMed
    1. Nickerson CA, Ott CM, Wilson JW, Ramamurthy R, Pierson DL. Microbial responses to microgravity and other low-shear environments. Microbiol. Mol. Biol. Rev. 2004;68:345–361. doi: 10.1128/MMBR.68.2.345-361.2004. - DOI - PMC - PubMed
    1. Castro VA, Thrasher AN, Healy M, Ott CM, Pierson DL. Microbial Characterization during the Early Habitation of the International Space Station. Microb. Ecol. 2004;47:119–126. doi: 10.1007/s00248-003-1030-y. - DOI - PubMed

LinkOut - more resources