. 2022 Jun 2;5(1):536.
doi: 10.1038/s42003-022-03495-6.

Hypoxia-induced inhibin promotes tumor growth and vascular permeability in ovarian cancers

Affiliations

Hypoxia-induced inhibin promotes tumor growth and vascular permeability in ovarian cancers

Ben Horst et al. Commun Biol. .

Abstract

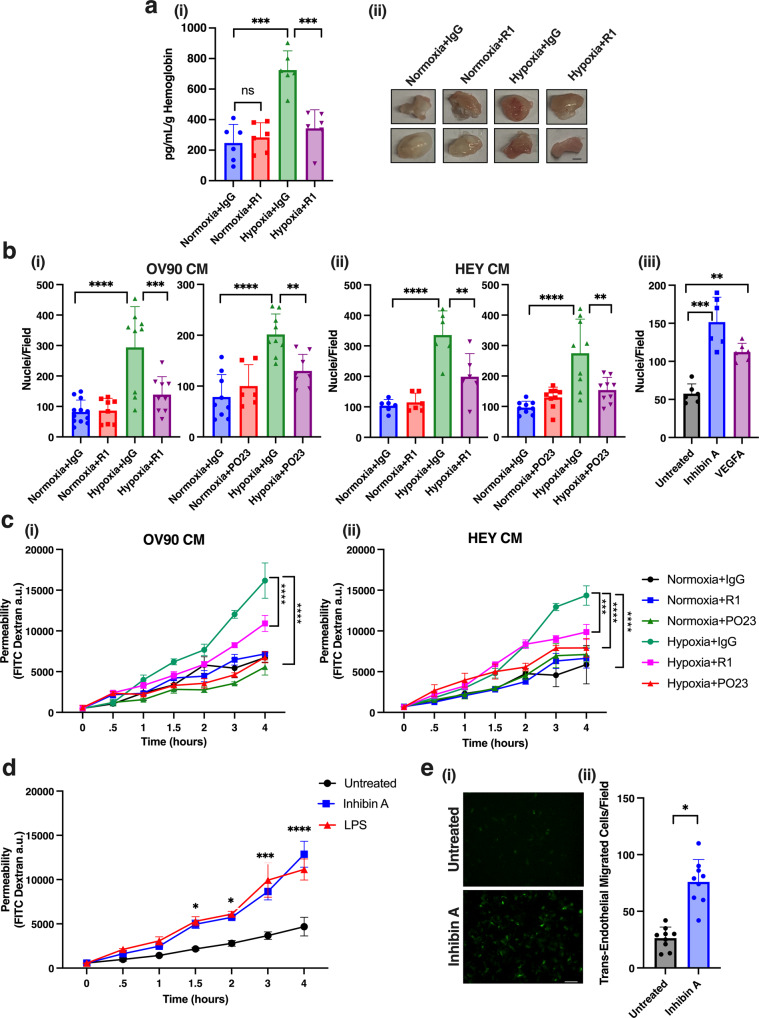
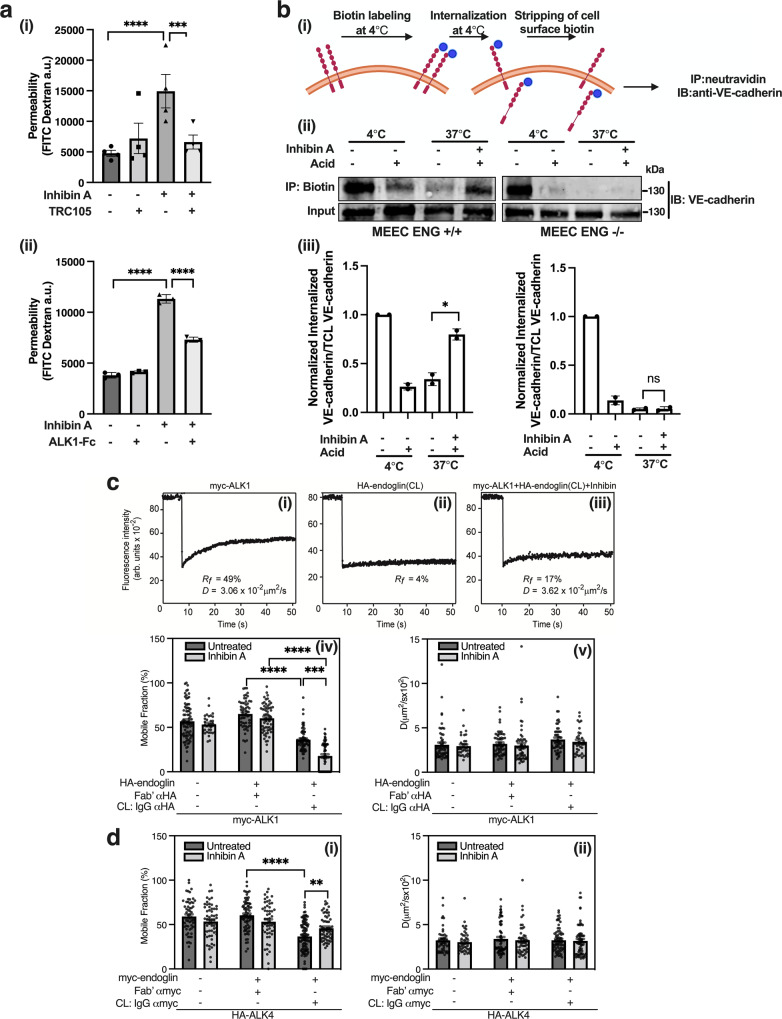
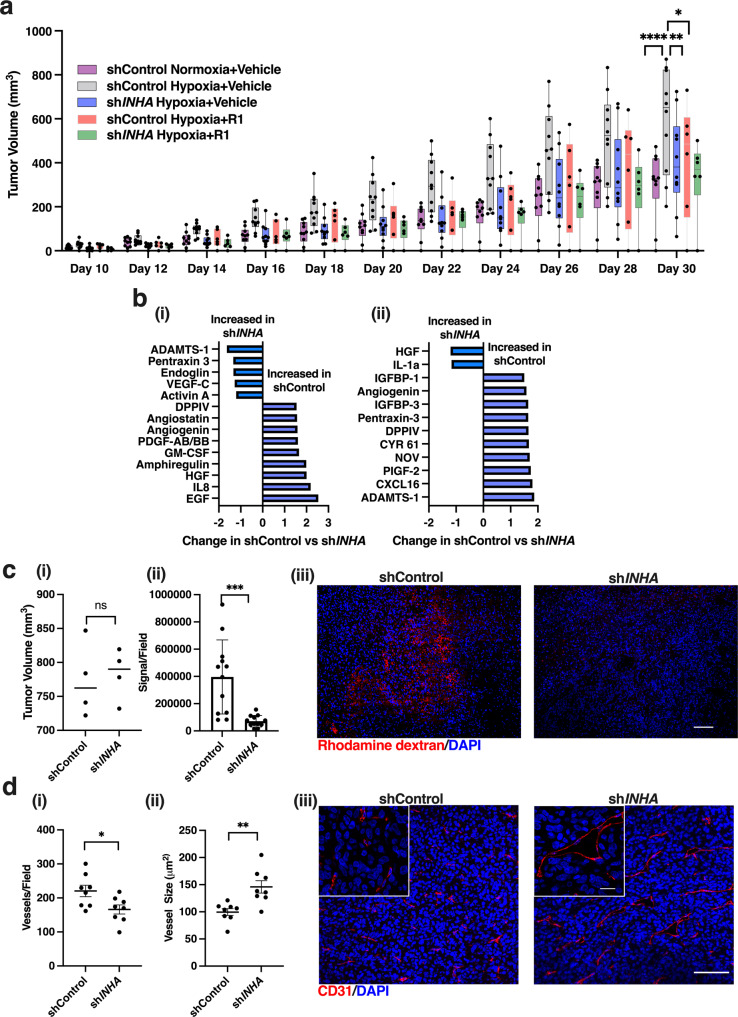
Hypoxia, a driver of tumor growth and metastasis, regulates angiogenic pathways that are targets for vessel normalization and ovarian cancer management. However, toxicities and resistance to anti-angiogenics can limit their use making identification of new targets vital. Inhibin, a heteromeric TGFβ ligand, is a contextual regulator of tumor progression acting as an early tumor suppressor, yet also an established biomarker for ovarian cancers. Here, we find that hypoxia increases inhibin levels in ovarian cancer cell lines, xenograft tumors, and patients. Inhibin is regulated primarily through HIF-1, shifting the balance under hypoxia from activins to inhibins. Hypoxia regulated inhibin promotes tumor growth, endothelial cell invasion and permeability. Targeting inhibin in vivo through knockdown and anti-inhibin strategies robustly reduces permeability in vivo and alters the balance of pro and anti-angiogenic mechanisms resulting in vascular normalization. Mechanistically, inhibin regulates permeability by increasing VE-cadherin internalization via ACVRL1 and CD105, a receptor complex that we find to be stabilized directly by inhibin. Our findings demonstrate direct roles for inhibins in vascular normalization via TGF-β receptors providing new insights into the therapeutic significance of inhibins as a strategy to normalize the tumor vasculature in ovarian cancer.


Conflict of interest statement

The authors declare no competing interest.

Figures

Fig. 1
Fig. 1. INHA and total inhibin protein are increased in response to hypoxia in ovarian cancer cells.
a Relative qRT-PCR analysis of (i) INHA and (ii) VEGFA mRNA expression normalized to levels in 20% O2 in HEY and OV90 cells exposed to indicated oxygen concentration for 24 hrs. Mean ± SEM, (n = 3). *p < 0.05; **p < 0.01; ***p < 0.001; ****p < 0.0001, One-way ANOVA followed by Tukey’s multiple comparison. (iii) Western blot of HIF-1α stabilization at indicated oxygen concentrations in HEY (left) and OV90 (right). b Relative qRT-PCR analysis of (i) INHA and (ii) VEGFA mRNA expression normalized to corresponding levels in normoxia in indicated cells grown under hypoxia (0.2%) or normoxia (17–21%) for 24 h except for OVCAR5 (12 h). Mean ± SEM, n of independent trials for PA1 = 3, OVCAR5 n = 7, HEY n = 3, OV90 n = 3, *p < 0.05; **p < 0.01, unpaired t-test. (iii) Western blot of HIF-1α stabilization in indicated cell lines. c Total inhibin ELISA (inhibin A/B, inhibinα) of conditioned media collected from OV90 and HEY cells grown in normoxia or after 24 h exposure to hypoxia (0.2% O2). Mean ± SEM, (n = 3). **p < 0.01, unpaired t-test. d (i) Western blot of HIF-1α levels in HEY and OV90 following exposure to hypoxia (0.2% O2) for 24 h and after indicated reoxygenation times. (ii) Relative qRT-PCR analysis of INHA expression in HEY and OV90 cells following exposure to hypoxia (0.2% O2) and indicated reoxygenation time normalized to corresponding levels in normoxia. Mean ± SEM, (n = 3). *p < 0.05; **p < 0.01, One-way ANOVA followed by Tukey’s multiple comparison.
Fig. 2
Fig. 2. Inhibinα is increased in ovarian cancer spheroids, patient samples, and tumor xenografts.
a (i) Western blotting of HIF-1α protein from indicated cells grown in either 2D or under anchorage independence (3D) conditions, vinculin is loading control and (ii) relative qRT-PCR of INHA mRNA expression in OVCA420 and PA1 after 48 h (OVCA420) or 72 h (PA1) of growth under anchorage independence (3D). Mean ± SEM, n = 3. **p < 0.01; ***p < 0.001, unpaired t-test. b Total inhibin ELISA of ascites fluid from 25 ovarian cancer patients sorted by stage. c (i) Percent hypoxic area in tumors of indicated size range determined by quantitation of pimonidazole staining in tumors (Supplementary Fig. 2a). Graph represents average hypoxic area of all HEY xenograft tumors sorted by size as <500 mm3 or >500 mm3. Mean ± SEM, n = 4 for <500 mm3 and n = 7 for >500 mm3. *p < 0.05, unpaired t-test. (ii) Relative qRT-PCR of INHA expression in tumors from indicated sizes of HEY cells implanted subcutaneously. Mean ± SEM, n = 8. ***p < 0.001, unpaired t-test. d Correlation analysis between INHA expression and either (i) Buffa or (ii) Winter hypoxia scores from TCGA OVCA (i–ii) or breast (iii) cancer patient data sets from cBioportal measured by RNA-Seq. Correlation analysis was performed by Pearson correlation.
Fig. 3
Fig. 3. INHA expression is regulated by HIF-1.
a (i) Western blot of HIF-1α at indicated time points after treatment with 100 μM CoCl2. (ii) Relative qRT-PCR analysis of INHA and VEGF mRNA in OVCAR5 and PA1 cells after indicated time of treatment with 100 μM of CoCl2 normalized to untreated. Mean ± SEM, (n = 2). *p < 0.05; **p < 0.01, One-way ANOVA followed by Tukey’s multiple comparison. b Relative qRT-PCR analysis of INHA and ARNT mRNA in HEY shControl or shARNT cell lines after exposure to hypoxia (0.2% O2) for 24 h normalized to corresponding shControl normoxia levels. Mean ± SEM, (n = 4). n.s.,not significant; *p < 0.05; **p < 0.01, unpaired t-test. c Representative western blot (above) and relative qRT-PCR analysis of INHA expression (below) from (i) HEY or (ii) OV90 cells transfected with either siScr, siHIF-1α, siHIF-2α, or a combination of siHIF-1/2α and exposed to hypoxia (0.2% O2) for 24 h. Mean ± SEM, (n = 3) *p < 0.05; ***p < 0.001; ****p < 0.0001, One-way ANOVA followed by Tukey’s multiple comparison test. d Relative qRT-PCR analysis using primers that amplify the proximal HRE region in the INHA promoter (Supplementary Fig. 3a) after chromatin immunoprecipitation (ChIP) of HIF-1α in OVCAR5 and OV90 cells. ChIP qRT-PCR results were quantified as normalized enrichment over IgG and normalized to normoxia. Mean ± SEM, OVCAR5 (n = 3), OV90 (n = 2). n.s.,not significant; *p < 0.05; **p < 0.01, Two-way ANOVA followed by Fishers LSD test. e Luciferase activity of HEK293 cells transfected with the INHA promoter driven luciferase reporter construct (pGL4.10) and a SV-40 renilla control vector. Cells were either (i) exposed to hypoxia (0.2% O2) or (ii) co-transfected with HIF-1α overexpression plasmid (HIF-1 ODD) and luciferase activity measured and normalized to either normoxia in (i) or PCDNA3.1 in (ii). Mean ± SEM, n = 3 (Hypoxia), n = 2 (HIF-1 ODD) *p < 0.05; **p < 0.01, unpaired t-test.
Fig. 4
Fig. 4. Inhibin increases hypoxia induced angiogenesis and endothelial cell migration and permeability in vivo and in vitro respectively.
a (i) Hemoglobin content in Matrigel plugs collected 12 days after subcutaneous injection of HEY conditioned media collected from cells exposed to normoxia or hypoxia for 24 h and mixed with either 2 μg of IgG or anti-inhibin R1 antibody. Mean ± SEM, n = 6 plugs per condition. n.s., not significant; ***p < 0.001, One-way ANOVA followed by Tukey’s multiple comparison test. (ii) Representative images of Matrigel plugs from (i) Scale bar: 2 mm. b Quantitation of HMEC-1 migration through fibronectin coated 8 μm trans-well filter (i–ii) towards conditioned media from OV90 or HEY cells exposed to hypoxia (0.2% O2) with either 2 μg of R1 or PO23 anti-inhibin antibody or IgG as a control, or towards (iii) serum free media containing 1 nM inhibin A or 1 nM VEGFA. Nuclei from three representative fields per filter were counted. Mean ± SD. **p < 0.01; ***p < 0.001; ****p < 0.0001, One-way ANOVA followed by Tukey’s multiple comparison. c, d Quantitation of endothelial cell permeability by measuring FITC-dextran changes across a HMEC-1 monolayer treated with (i–ii) conditioned media from (i) OV90 or (ii) HEY cells exposed to hypoxia (0.2% O2) with either 2 μg of R1 or PO23 anti-inhibin antibody or IgG as a control, or (d) treated with 1 nM inhibin A or 10 μg/mL LPS. Mean ± SEM *p < 0.05; ***p < 0.001; ****p < 0.0001, One-way ANOVA followed by Tukey’s multiple comparison. e HEY trans-endothelial migration (TEM) across HMEC-1 monolayer either treated with inhibin A for 4 h or untreated. (i) Representative transmigrated GFP positive HEY cells and (ii) quantitation of transmigration (n = 3). *p < 0.05, unpaired t-test. Scale bar: 100 μm.
Fig. 5
Fig. 5. Inhibin increases endothelial cell contractility and VE-cadherin internalization.
a (i) Representative immunofluorescence images of F-actin (red) or VE-Cadherin (green) from HMEC-1 cells grown to confluence on fibronectin coated coverslips and treated with either 1 nM inhibin A or 1 nM VEGFA for 30 min. (ii) Quantitation of actin stress fibers from (i) using ImageJ FibrilTool plugin. ***p < 0.001; ****p < 0.0001, unpaired t-test. Scale bar: 25 μm. b (i) Western blot analysis of pMLC-2 from HMEC-1 cells upon 1 nM inhibin A treatment for indicated times. (ii) Quantitation of pMLC-2 changes in (i). c (i) Schematic of VE-cadherin internalization (ii) Representative immunofluorescent images of (upper panel) cell surface labeled VE-cadherin at 4 °C detected by labeling with an extracellular domain anti-VE-cadherin antibody. Efficiency of stripping of extracellular labeled VE-cadherin with a mild acid in lower panel. (iii) Internalized VE-Cadherin at 37 °C detected with a FITC-secondary antibody in either untreated or cells treated with 1 nM inhibin A or 1 nM VEGFA after acid wash. Green arrows represent internalized VE-cadherin. Red, actin. Blue, DAPI. Quantitation of internalized VE-Cadherin at (iv) T0 or (v) T30 by Blobfinder ImageJ Plugin (Methods). *p < 0.05, unpaired t-test. Scale bar: 25 μm.
Fig. 6
Fig. 6. Inhibin promotes endothelial cell permeability via ALK1 and endoglin and specifically increases ALK1-endoglin cell surface complexes while reducing ALK4-endoglin complexes.
a Quantitation of endothelial cell permeability by measuring FITC-dextran changes across a HMEC-1 monolayer treated with 1 nM inhibin A in the presence or absence of (i) 100 μg/mL TRC105 or (ii) 10 ng/mL ALK1-Fc. FITC-dextran diffusion across the HMEC-1 monolayer at 4 h is presented. Mean ± SD, n = 4 for i and n = 3 for ii. n.s. not significant; ***p < 0.001; ****p < 0.0001. b Internalization of VE-cadherin measured by cell surface biotinylation. (i) Biotin labeling of cell surface proteins was performed on MEEC WT or MEEC ENG−/−. Internalization was induced by treatment with 1 nm Inhibin A for 30 min at 37 °C followed by stripping of cell surface biotin. Internalized VE-cadherin was detected by IP with neutravidin resin and (ii) immunoblotting with anti-VE-cadherin and (iii) quantitated as internalized VE-cadherin over input VE-cadherin normalized to 37 °C control. Mean ± SD, n = 2. n.s. not significant; *p < 0.05, unpaired t-test. c, d Patch/FRAP studies on the effect of inhibin A on endoglin-ALK1 (c) and endoglin-ALK4 (d) complex formation. COS7 cells were transfected with myc-ALK1 and HA-endoglin (c) or with (each vector HA-ALK4 and myc-endoglin) (D) (each vector alone, or together). c After 24 h, singly transfected cells were labeled for FRAP by anti-tag Fab’ followed by fluorescent secondary Fab’ (Methods) and subjected to FRAP studies. For patch/FRAP, cells were subjected to protocol 1 of IgG-mediated patching/cross-linking (CL) (Methods), resulting in HA-endoglin patched and labeled by Alexa 488-GαR IgG (designated “CL: IgG αHA”), whereas myc-ALK1 is labeled by monovalent Fab’ (with secondary Alexa 546-GαM Fab’). In control experiments without HA-endoglin CL, the IgG labeling of the HA tag was replaced by exclusive Fab’ labeling. Where indicated, inhibin A (4 nM) was added during the fluorescent labeling step and maintained throughout the measurement. Representative FRAP curves are depicted in panels (i–iii), showing the lateral diffusion of singly expressed myc-ALK1 (i), singly expressed HA-endoglin immobilized by IgG CL (ii) and of myc-ALK1 in the presence of co-expressed and IgG-crosslinked HA-endoglin in the presence of inhibin A (iii). Panels (iv–v) depict average Rf (iv) and D values (v) of multiple experiments. Bars represent mean ± SEM values, with the number of measurements (each conducted on a different cell) shown in each bar. Some of these numbers are lower in the D values panels, since only Rf can be extracted from FRAP curves yielding less than 20% recovery. Asterisks indicate significant differences between the Rf values of the pairs indicated by brackets (****p < 1 × 10−15; ***p = 1 × 10−9; one-way ANOVA followed by Bonferroni post-hoc test). d Cells were labeled for patch/FRAP using protocol 2 (Methods), leading to immobilization (CL) of the myc-endoglin and Fab’ labeling of HA-ALK4, whose lateral diffusion was then measured by FRAP. (i) Average Rf values. (ii) Average D values. Bars are mean ± SEM with number of measurements (n) depicted in each bar. Asterisks indicate significant differences between the Rf values of the pairs indicated by brackets (****p < 1 × 10−15; **p = 5.6 × 10−3; one-way ANOVA followed by Bonferroni post-hoc test). No significant differences were found between D values following myc-endoglin immobilization.
Fig. 7
Fig. 7. Hypoxia regulated inhibin promotes tumor growth and regulates vascular normalization in vivo.
a Growth curves of subcutaneously implanted HEY shControl or shINHA tumors exposed to either normoxia or hypoxia (0.2% O2) 24 h prior to injection. 10 mg/kg R1 antibody or vehicle control was intraperitoneally injected three times a week. Data shown as box plots where center line is median, box limits are upper and lower quartile, n = 10 for vehicle and n = 6 for R1 receiving groups. **p < 0.01; ****p < 0.0001, Two-way ANOVA followed by Tukey’s multiple comparison test. b Fold change of proteins most altered in shControl and shINHA tumors (a) using the (i) human or (ii) mouse angiogenesis proteome array. (n = 2 tumors per group). c (i) Average tumor volume of HEY shControl or shINHA subcutaneous tumors used for analysis of vasculature and permeability in ii and iii. Mean ± SEM, n = 4. (ii) Quantitation of extravasated rhodamine-dextran (red) shown as signal per 10x field from tumors in Fig. 7ci (Methods). Mean ± SD. n = 12 fields from 4 tumors. ***p < 0.001, unpaired t-test. (iii) Representative images of rhodamine-dextran (red) extravasation into either shControl or shINHA subcutaneous tumors from c.i Scale bar:100 μm. d (i–ii) Quantitation of average (i) vessel number and (ii) size in a 10x field using ImageJ (Methods). Mean ± SD. n = 8 which represents averages of 8 fields in four tumors from c.i. (iii) Representative images of CD-31 (red) staining in HEY shControl and shINHA subcutaneous tumors from Fig. 7ci. Scale bar:100 μm, insets scale bar: 20 μm. *p < 0.05; **p < 0.01, unpaired t-test.

Similar articles

Cited by

References

    1. Viallard C, Larrivee B. Tumor angiogenesis and vascular normalization: alternative therapeutic targets. Angiogenesis. 2017;20:409–426. doi: 10.1007/s10456-017-9562-9. - DOI - PubMed
    1. Adam RA, Adam YG. Malignant ascites: past, present, and future. J. Am. Coll. Surg. 2004;198:999–1011. doi: 10.1016/j.jamcollsurg.2004.01.035. - DOI - PubMed
    1. Monk BJ, Minion LE, Coleman RL. Anti-angiogenic agents in ovarian cancer: past, present, and future. Ann. Oncol. 2016;27:i33–i39. doi: 10.1093/annonc/mdw093. - DOI - PMC - PubMed
    1. Impact of selective anti-BMP9 treatment on tumor cells and tumor angiogenesis. Mol. Oncol.10.1016/j.molonc.2016.10.002 (2016). - PMC - PubMed
    1. Goumans MJ, Liu Z, Ten Dijke P. TGF-beta signaling in vascular biology and dysfunction. Cell Res. 2009;19:116–127. doi: 10.1038/cr.2008.326. - DOI - PubMed

Publication types