. 2022 Jun;24(6):940-953.
doi: 10.1038/s41556-022-00918-8. Epub 2022 Jun 2.

A stromal Integrated Stress Response activates perivascular cancer-associated fibroblasts to drive angiogenesis and tumour progression

Affiliations

A stromal Integrated Stress Response activates perivascular cancer-associated fibroblasts to drive angiogenesis and tumour progression

Ioannis I Verginadis et al. Nat Cell Biol. 2022 Jun.

Abstract

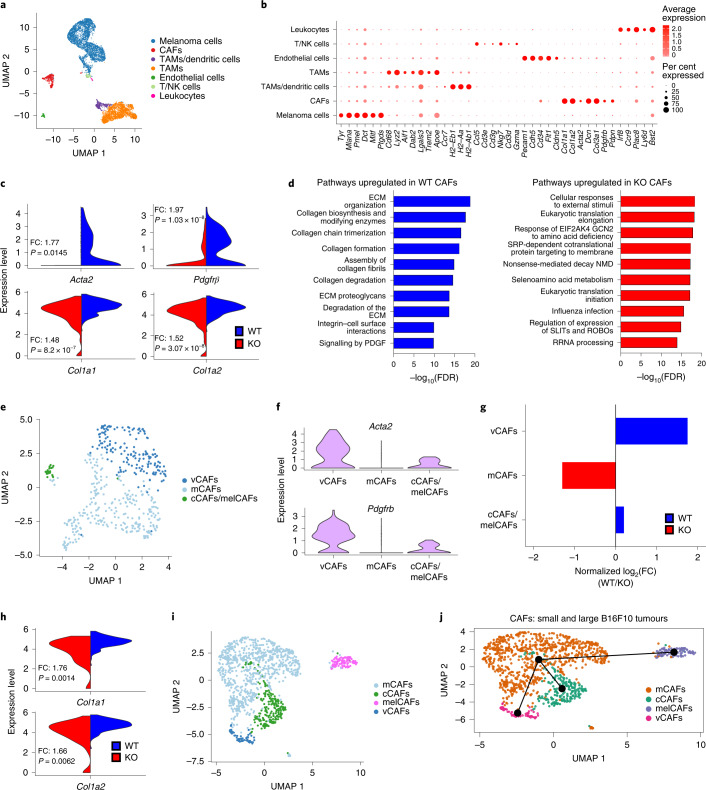
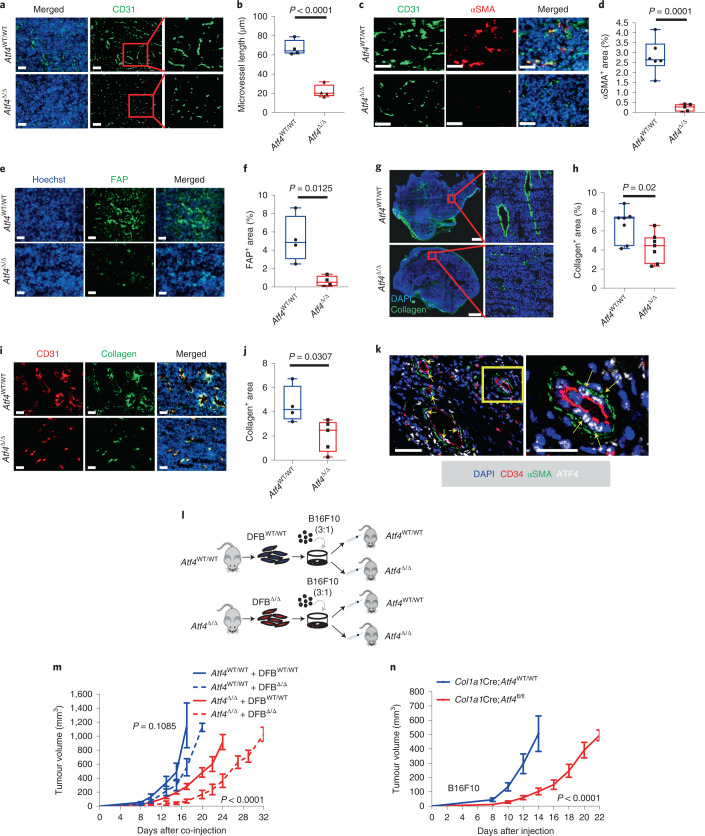
Bidirectional signalling between the tumour and stroma shapes tumour aggressiveness and metastasis. ATF4 is a major effector of the Integrated Stress Response, a homeostatic mechanism that couples cell growth and survival to bioenergetic demands. Using conditional knockout ATF4 mice, we show that global, or fibroblast-specific loss of host ATF4, results in deficient vascularization and a pronounced growth delay of syngeneic melanoma and pancreatic tumours. Single-cell transcriptomics of tumours grown in Atf4Δ/Δ mice uncovered a reduction in activation markers in perivascular cancer-associated fibroblasts (CAFs). Atf4Δ/Δ fibroblasts displayed significant defects in collagen biosynthesis and deposition and a reduced ability to support angiogenesis. Mechanistically, ATF4 regulates the expression of the Col1a1 gene and levels of glycine and proline, the major amino acids of collagen. Analyses of human melanoma and pancreatic tumours revealed a strong correlation between ATF4 and collagen levels. Our findings establish stromal ATF4 as a key driver of CAF functionality, malignant progression and metastasis.


Conflict of interest statement

C.K. is the scientific founder and holds equity position in Veltion Therapeutics. The remaining authors declare no competing interests.

Figures

Fig. 1
Fig. 1. Host ATF4 deletion inhibits tumour growth and extends survival.
a, Top: loxP sites flank exons 2 and 3 of the Atf4 gene. Bottom: schematic of the tamoxifen treatment schedule. Tamoxifen (200 mg per kg body weight (BW) was given for 5 consecutive days by oral gavage. b, Box and whisker plot of the RT–qPCR results of Atf4 mRNA levels in whole lung (n = 3–5 biologically independent samples per group). Unpaired two-sample t-test. c, Reversible BW loss after ATF4 excision. Two-way analysis of variance (ANOVA) analysis (until day 34). Values represent the mean ± s.e.m., unpaired t-test. NS, not significant. d, Tumour growth curves of Atf4WT/WT and Atf4Δ/Δ mice following the injection of 5 × 105 B16F10 cells. Values represent the mean ± s.e.m., two-way ANOVA analysis (until day 18). e, Kaplan–Meier survival analysis of the mice from d (log-rank (Mantel–Cox) test). f, Growth curves after injection of B16F10 cells into Atf4WT/WT and Atf4Δ/Δ mice with the tamoxifen administered after the tumours reached around 100 mm3 and continued for 5 days (dark green line on x axis). Values represent the mean ± s.e.m., two-way ANOVA analysis (until day 18). g, Tumour growth curves of Atf4WT/WT and Atf4Δ/Δ mice following injection of 5 × 105 MH6419 cells. Values represent the mean ± s.e.m., two-way ANOVA analysis (until day 24). h, Images from pancreas collected 3 weeks after injection of 5 × 104 MH6419 cells orthotopically in the tail of the pancreas of Atf4WT/WT (n = 11 biologically independent samples) and Atf4Δ/Δ (n = 7 biologically independent samples). The yellow and blue dotted lines indicate the tumour and normal areas of pancreas, respectively. i, Box and whisker plot display the percentage tumour normalized to BW. Unpaired two-sample t-test. n in figures represent biologically independent samples. Source data
Fig. 2
Fig. 2. Single-cell transcriptomic analysis reveals ATF4-dependent changes in CAFs in B16F10 tumours.
a, UMAP plot of cells from two biologically independent samples pooled from small B16F10 tumours (150 mm3) from each genotype. Different cell type clusters are colour coded. TAMs, tumour-associated macrophages. b, Dot plot displaying selected gene markers across all clusters. The colour intensity represents the average expression and the size of dots indicates the percentage of cells expressing each gene. c, Violin plots showing the expression of Acta2, Pdgfrb, Col1a1 and Col1a2 at the CAF cluster identified in B16F10 tumours. The y axis shows the mean expression level. Red (KO) and blue (WT) represent Atf4Δ/Δ and Atf4WT/WT, respectively. FC, fold change. d, Bar plot displaying the negative log10(false discovery rate (FDR)) of the ten most significantly upregulated gene ontology terms enriched in WT (left) or KO (right) CAFs. e, UMAP plot after reclustering of the CAF cell type in the dataset from a. f, Violin plots of the expression levels of the indicated CAF markers in the CAF subclusters. g, Bar plot of the normalized log2(FC) (WT/KO) of CAF subclusters in tumours grown in each genotype. h, Violin plots of Col1a1 and Col1a2 expression in the vCAF subcluster. i, UMAP plot of reclustered CAFs from merged small and large B16F10 tumours. j, Slingshot-based pseudo-time ordering suggests that mCAFs move along a differentiation trajectory to become vCAFs, cCAFs and melCAFs.
Fig. 3
Fig. 3. ATF4 loss is associated with abnormal tumour vascularization and reduced ECM component deposition that culminates in a tumour-inhibiting phenotype.
a, Representative immunofluorescence (IF) images from B16F10 tumours (~300 mm3) stained for CD31 (green). Original magnification, ×10 or ×28 (insets). b, Box and whisker plot of the microvessel length from a (n = 4 biologically independent samples per group). c, Representative IF images from B16F10 tumours stained for αSMA (red) and CD31 (green). Magnification, ×20. d, Box and whisker plot of the percentage αSMA-positive area from c (n = 5–6 biologically independent samples per group). e, Representative IF images from MH6419 tumours stained for FAP (green). Magnification, ×10. f, Box and whisker plot of the percentage FAP-positive area from e (n = 4 biologically independent samples per group). g, Representative IF images from B16F10 tumour sections stained for collagen (green). h, Box and whisker plot of the percentage positive collagen area from g (n = 7 biologically independent samples per group). i, Representative IF image from MH6419 tumours stained for CD31 (red) and collagen (green). Magnification, ×10. j, Box and whisker plot of the percentage collagen positive area from i (n = 4–5 biologically independent samples per group). k, Representative IF image from human melanoma tissues stained for CD34 (red), αSMA (green) and ATF4 (white). Arrows denote the αSMA-positive cells with high ATF4 expression located in the perivascular area. Asterisks denote high ATF4 expression in tumour cells. Right: cropped image from ×20 original magnification. l, Schematic of the co-engraftment strategy to examine the ATF4-dependent tumour-promoting role of fibroblasts in the TME. m, Tumour growth curves of mice of the indicated genotype (Atf4WT/WT or Atf4Δ/Δ) co-engrafted with DFB from the indicated ATF4 genotypes in ratios as described in l (n = 5–6 biologically independent samples per group). Values represent the mean ± s.e.m., two-way ANOVA (until day 17 for Atf4WT/WT groups and day 24 for Atf4Δ/Δ groups). n, Tumour growth curves of mice with fibroblast/osteoblast-specific ATF4 excision (Col1a1Cre;Atf4wt/wt (n = 11 biologically independent samples) and Col1a1Cre;Atf4Δ/Δ (n = 7 biologically independent samples)) following subcutaneous injection of 5 × 105 B16F10 cells. Values represent the mean ± s.e.m., two-way ANOVA (until day 14). Unpaired two-sample t-test in all box and whisker plots. Scale bars, 50 μm (k), 100 μm (a, c, e and i) and 1 mm (g). Source data
Fig. 4
Fig. 4. ATF4-dependent Col1a1 expression and multistep regulation of the collagen biosynthesis pathway contribute to fibroblast functionality.
a, Volcano plot from the genome-wide gene expression microarray on LFBs. b, Predicted binding site of ATF4 on intron 5 of Col1a1. c, ATF4 ChIP followed by RT–qPCR at the Col1a1 locus and Eif4ebp1 (positive control) (representative from two biologically independent replicates; n = 3–4 technical replicates). NEG, PCR amplification of a site with no predicted ATF4 binding sites, located at intron 6 of Col1a1 . d, Box and whisker plot of RT–qPCR of Atf4, Psat1, Shmt1 and Shmt2 (left) and Atf4, Aldh18a1 and Pycr1 (right) in LFBs (n = 5–6 biologically independent samples per group). e, Box and whisker plot of the NMR spectrometry analysis of intracellular glycine and proline levels (μM per cell) in LFBWT/WT and LFBΔ/Δ cells (n = 4 biologically independent samples per group). f, LC–ESI-MS/MS analysis to measure the metabolic flux from serine to glycine and glutamine to proline in LFBWT/WT and LFBΔ/Δ cells (n = 3 biologically independent samples per group). Values represent the mean ± s.e.m. The letters indicate a significant change from the LFBWT/WT at each isotopologue: aP < 0.01, bP < 0.001. g, Proteins were detected by immunoblotting in untreated LFBs. β-actin was used as a loading control. h, Representative images of collagen deposition from LFBWT/WT and LFBΔ/Δ using second harmonic generation (SHG) microscopy. Magnification, ×10. Scale bar, 100 μm. i, Box and whisker plot of the fluorescent signal from h. Each dot represents quantitative value from a ×10 field. j, Re-expression of a mouse ATF4 homologue from an adenoviral vector (AdmATF4) in LFBΔ/Δ cells restores collagen I levels. Proteins were detected by immunoblotting. β-actin was used as a loading control. k, LFBWT/WT were treated with TGF-β1 for 6 h and proteins were detected by immunoblotting. β-actin was used as a loading control. siNT, small interfering non-targeting RNA. Numbers below blots represent relative band intensities, normalized to T-eIF2a and β-actin. Unpaired two-sample t-test in all box and whisker plots. Source data
Fig. 5
Fig. 5. ATF4-deficient fibroblasts fail to support endothelial tube formation and secrete reduced levels of specific angiogenic cytokines.
a, Representative images of vasculature from B16F10 tumours grown in Atf4WT/WT and Atf4Δ/Δ mice. b, Box and whisker plot of the number of sprouts per field from a (n = 3 biologically independent samples per group). c, ECWT/WT were treated with CM collected from LFBWT/WT or LFBΔ/Δ for 24 h and plated for tube formation assay and analysed 4 h after plating. Magnification, ×19. d, Box and whisker plots of the number of tubes and number of junctions per field from c. e, CM collected from LFBWT/WT, LFBΔ/Δ and LFBΔ/Δ + AdmATF4 cells was used for analysis of pro-angiogenic cytokines using antibody arrays. Green boxes indicate the reference spots. Red boxes refer to the analysed proteins (VEGF, CXCL12, IGFBP-2 and IGFBP-9). f, Membranes were subjected to immunoblotting and protein levels were quantified from e. Values represent the mean ± s.e.m., unpaired two-sample t-test. g, Tumour lysates from equal volume B16F10 tumours collected from two Atf4WT/WT and two Atf4Δ/Δ mice were analysed for pro-angiogenic cytokines using the same antibody array as in e. h, Representative IF images from B16F10 tumours stained for VEGF (red) and CD31 (green). Magnification, ×20. Right: cropped images from ×20 original magnification. i, Box and whisker plot of the percentage VEGF+CD31+ colocalization area from h (n = 5 biologically independent samples per group). j, Representative IF images from B16F10 tumours stained for CXCL12 (red) and CD31 (green). Magnification, ×20. Right: cropped images from ×20 original magnification. k, Box and whisker plot of the percentage CXCL12+CD31+ colocalization area from j (n = 5 biologically independent samples per group). l, Proteins were detected by immunoblotting in untreated or TGF-β1-treated LFBWT/WT or LFBΔ/Δ (6 h). β-tubulin was used as a loading control. Numbers below blots represent relative band intensities, normalized to β-tubulin. Unpaired two-sample t-test in all box and whisker plots. Scale bars, 100 μm (a), 50 μm (h and j) and 5 μm (c). Source data
Fig. 6
Fig. 6. Host ATF4 ablation severely impairs lung colonization and metastasis of melanoma cells.
a, Volcano plot from genome-wide gene expression microarray on lungs from Atf4WT/WT and Atf4Δ/Δ mice at 4 weeks after tamoxifen treatment (Atf4Δ/Δ versus Atf4WT/WT). b, Bar plot displaying the 15 most significantly enriched gene ontology terms in lungs from Atf4WT/WT compared with Atf4Δ/Δ mice from a. c, Box and whisker plot of the quantitative MS analysis in Atf4WT/WT and Atf4Δ/Δ lungs (nmol mg–1 of lung) for glycine and proline (n = 4 biologically independent samples per group). d, Schematic of the lung colonization experiment. Mice were injected with 1.5 × 105 B16F10 cells in the tail vein, and lungs were collected 3 weeks later. e, Representative images from Atf4WT/WT and Atf4Δ/Δ lungs. f, Box and whisker plot of the number of macroscopic lung metastases (mets) (n = 7–8 biologically independent samples per group). g, Schematic of the process to analyse metastatic activity. Mice were subcutaneously injected with 5 × 105 B16F10 cells, and the primary tumours were surgically excised when they reached about 300 mm3. The mice were sutured and followed-up for a period of 4 weeks. h, Representative images from lungs, collected 4 weeks after tumour excision. i, Box and whisker plot of the macroscopic lung metastases (n = 7–9 biologically independent samples per group). Unpaired two-sample t-test in all box and whisker plots. Source data
Fig. 7
Fig. 7. High ATF4 levels or ATF4-dependent gene expression correlate with increased COL1 expression or deposition in human tumours.
The ISR gene signature comprising 32 genes was used as a surrogate for ATF4 activation. a, Pearson’s correlation between the ISR target signature and COL1A1, ACTA2, PDGFRB and FAP in SKCM and PAAD. The linear regression lines along with 95% confidence intervals (shaded regions) are shown. b, Human melanoma tissue arrays containing sections from 176 tumours and 16 healthy controls were stained for COL1 (top) and ATF4 (bottom) proteins. Damaged or tissues expressing high melanin levels were excluded from the quantification. Red and green boxes indicate representative high and low expression levels of COL1 and ATF4, respectively. c, Representative images from human melanoma tissue arrays stained for COL1 and ATF4 proteins Scale bars, 100 μm. d, Pearson’s correlation for all the samples (top) and metastatic samples (bottom) between the percentage ATF4 area and percentage COL1 area. e, Kaplan–Meier plot of survival time of patients with SKCM with high (n = 151 biologically independent samples) or low (n = 151 biologically independent samples) COL1A1 expression. log-rank (Mantel–Cox) test. Source data
Extended Data Fig. 1
Extended Data Fig. 1. Host ATF4 deletion causes a transient weight loss and gender-independent increase in survival of B16F10 cells-injected mice.
a, Genotyping of mice for Rosa26::CreERT2 and ATF4 status. b, Box and whisker plot display the RT-qPCR of Atf4 in spleen and liver (n = 3–5 biologically independent samples per group). Unpaired two-sample t-test. c, Schema for injection of tumour cells post tamoxifen treatment. d, Tumour growth curves of single mouse plotted from B16F10 cells-injected mice. e, Kaplan-Meier survival analysis by gender from d. Log-rank (Mantel-Cox) test. f, Tumour growth curves of single mouse plotted from MH6419 cells-injected mice. g. Kaplan-Meier survival analysis of the mice following 5×10⁵ MH6419 cell injection. Log-rank (Mantel-Cox) test. h, Box and whisker plot display % normal pancreas weight normalized to BW. i, Representative images of pancreas from orthotopic pancreatic tumour model, stained for H&E. The yellow and blue dotted lines indicate the tumour and normal areas of pancreas, respectively. j, Box and whisker plot of the % tumour area normalized to total area. Unpaired two-sample t-test. Source data
Extended Data Fig. 2
Extended Data Fig. 2. scRNA-seq in small and large size B16F10 tumours.
a, Schematic for harvesting B16F10 tumours at small (150 mm3) and large (300 mm3) volumes and processing for scRNA-seq. b, UMAP plot of cells from 4 pooled large B16F10 tumours (300 mm3) from each genotype. c, Dot plot displaying selected gene markers across all clusters. The colour intensity represents the average expression while the size of dots indicates the percentage of cells expressing each gene. d, Violin plots showing the expression of ATF4 across all clusters in small sized tumours and e, in large sized tumours. f, Bar plot displaying the normalized Log2 fold change of cell types in each cluster in small sized tumours and g, in large sized tumours. h, Tumour growth curves of Atf4wt/wt and Atf4Δ/Δ mice treated with Isotype or anti-CD8 antibody following 5×10⁵ B16F10 cell injection (n = 3–5 biologically independent samples per group). Values represent mean ± SEM. Two-way ANOVA analysis (until day 18). i, Violin plots showing the expression of the indicative markers at the CAFs cluster. j, Bar plot displaying the eight most significant Reactome pathways enriched in Atf4wt/wt CAFs using the genes upregulated in Atf4wt/wt. k, Violin plots showing the expression of the indicative CAF and melanoma markers at the CAFs subclusters and melanoma cells (small B16F10 tumours). Source data
Extended Data Fig. 3
Extended Data Fig. 3. Gene signature of CAFs and mural cells.
a, UMAP plot after re-clustering of the CAF cell type in the data set from Extended Data Fig. 2b. b, Violin plots showing the expression of the indicative CAF and melanoma markers at the CAFs subclusters and melanoma cells (large B16F10 tumours). c, Dot plot displaying selected gene markers across CAFs subclusters. d, Violin plots showing the expression of Acta2 and Pdgfrβ in CAFs subclusters. e, Bar plot displaying the normalized Log2 fold change (WT/KO) of CAFs subclusters in each genotype. f, UMAP plots of B16F10 small (top row) and large (bottom row) tumours coupled with the expression signal of the vCAFs- and mural cells-specific gene signatures.
Extended Data Fig. 4
Extended Data Fig. 4. ATF4 loss is associated with abnormal vascularization and extensive intratumoural necrosis.
a, Box and whisker plot display of the microvascular density in sections from B16F10 tumours (n = 4 biologically independent samples per group). b, Representative IF images from MH6419 tumours (appr. 300 mm3) stained for CD31 (green). Original magnification, 10x, 28x (insets). c, Box and whisker plots display the microvessel length (in μm) (left) and microvascular density (n = biologically independent samples 4 per group) (right) from b. d, Representative IF images from B16F10 tumours (appr. 1000 mm3) stained for CD31 (green). Original magnification, 10x, 28x (insets). e, Box and whisker plot of the microvessel length (in μm) from d (n = 4 biologically independent samples per group). f, Representative IF images from B16F10 tumours stained for CD31 (green) and Ki67 (red). The yellow dotted circles indicate the proliferative endothelial cells. Magnification, 20x. g, Box and whisker plot of %Ki67+CD31+ cells from f. h, Representative IF images from B16F10 tumours stained for CD31 (green) and TUNEL (orange). Magnification, 10x. i, Box and whisker plot the %TUNEL+CD31+ cells from h (n = 4 biologically independent samples per group). j, Representative IF images from mice i.v.-injected with Texas Red-Dextran post-ATF4 deletion. Magnification, 20x. k, Box and whisker plot of % Dextran positive area from j (n = 5 biologically independent samples per group). l, Representative IF images from B16F10 tumours stained for Hoechst only. The yellow highlighted area indicates tumour necrosis. m, Box and whisker plot display the ratio of tumour necrotic area over the total tumour area from l (n = 5 biologically independent samples per group). n, Flow cytometric analysis and box and whisker plot of the % dead cells in B16F10 tumours (n = 3–5 biologically independent samples). o, Representative IF images from B16F10 tumours stained for TUNEL, as a marker of apoptosis. Magnification, 10x. p, Box and whisker plot displays the %TUNEL positive area from o (n = 5 biologically independent samples per group). q, Representative IF images from B16F10 tumours stained for Ki67, as a marker of proliferation. Magnification, 10x. r, Box and whisker plot the %Ki67 positive cells from q (n = 4–5 biologically independent samples per group). Unpaired two-sample t-test in all box and whisker plots. Scale bars, 100 μm (b, d, f, h, j, o and q), 1 mm (l). Source data
Extended Data Fig. 5
Extended Data Fig. 5. ATF4 ablation is associated with reduced levels of CAFs markers, proliferation and collagen deposition in the TME.
a, Box and whisker plot of the % colocalization of aSMA+ with CD31+ in B16F10 tumours (n = 5–6 biologically independent samples per group). b, Representative IF images from MH6419 tumours stained for CD31 (green) and αSMA (red). Magnification, 20x. c, Box and whisker plots of the % αSMA positive area and d, of the % colocalization of aSMA+ with CD31+from b (n = 4 biologically independent samples per group). e, Representative IF images from orthotopic MH6419 pancreatic tumours stained for CD31 (green) and αSMA (red). Magnification, 10x. f, Box and whisker plot of the % colocalization of aSMA+ with CD31+ from e. g, Representative IF images from B16F10 tumours stained for CD31 (green) and PDGFRβ (red). Magnification, 10x. h, Box and whisker plot of the % PDGFRβ positive area and i, of the % colocalization of PDGFRβ+ with CD31+ from g (n = 4–6 biologically independent samples per group). j, Representative IF images from B16F10 tumours stained for αSMA (orange) and Ki67 (green). Magnification, 20x. k, Box and whisker plot of %Ki67+αSMA+ cells from j. l, Representative IF images from B16F10 tumours stained for αSMA (orange) and TUNEL (green). Magnification, 10x. m, Box and whisker plot the %TUNEL+αSMA + cells from l (n = 4 biologically independent samples per group). n, Representative IF images from B16F10 tumours stained for CD31 (green) and NG2 (red). Magnification, 20x. o, Box and whisker plot of % colocalization of NG2+ with CD31+ from n (n = 10–12 biologically independent samples per group). p. Representative images from MH6419 tumour sections stained with an antibody against collagen (green). q, Box and whisker plot of the % of positive collagen area from p (n = 4–7 biologically independent samples per group). Unpaired two-sample t-test in all box and whisker plots. Scale bars, 100 μm (b, e, g, j, l and n) and 1 mm (p). Source data
Extended Data Fig. 6
Extended Data Fig. 6. Fibroblast specific ATF4 deletion causes abnormal vascularization.
a, Box and whisker plot display RT-qPCR of Atf4 in DFB cells (n = 4–5 biologically independent samples per group). Unpaired two-sample t-test. b, Representative images of labelled DFBs with the Vybrant™ DiD. Magnification, 10x. c, In vivo tracking of the DFB + DiD cells injected to the flank of the mice by IVIS imaging. d, Quantification of the fluorescent signal from c. Values represent mean ± SEM, unpaired two-sample t-test. e, Genotyping of mice for Col1a1::CreERT2 and ATF4 status. f, No BW changes post ATF4 excision in Col1a1Cre;Atf4wt/wt and Col1a1Cre;Atf4Δ/Δ mice (n = 6 biologically independent samples per group); n.s. = not significant. Values represent mean ± SEM, two-way ANOVA analysis. g, Representative IF images from B16F10 tumours grown in Col1a1Cre;Atf4wt/wt and Col1a1Cre;Atf4Δ/Δ mice stained for CD31 (green). Magnification, 10x. h, Box and whisker plot display the microvascular density from g (n = 5 biologically independent samples per group). Unpaired two-sample t-test. i, Floating bars display the RT-qPCR of Atf4, Pecam1, Col1a1 and Col1a2 in isolated tumour endothelial cells (TEC) and LFBs (n = 2–3 biologically independent samples per group). Light gray lines are used to separate the groups for each gene. Scale bars, 100 μm (b and g). Source data
Extended Data Fig. 7
Extended Data Fig. 7. ATF4 loss reduces intracellular and secreted collagen in DFBs.
a, Box and whisker plot display RT-qPCR of Atf4, Col1a1, Col1a2 and Asns in LFBs (n = 4–7 biologically independent samples per group). b, Box and whisker display RT-qPCR of Col1a1 in DFBs (n = 4–5 biologically independent samples per group). c, Bar plot displaying the negative log10 FDR of the fifteen most significantly upregulated gene ontology terms enriched in LFBWT/WT compared to LFBΔ/Δ cells. d, Schematic of the collagen synthesis pathway. e, Schematic of the enzymes involved in glycine and f, proline biosynthesis pathways. g and h, LC-ESI-MS/MS analysis to measure the precursor serine-13C3 and glutamine-13C515N2 and the metabolic flux from serine to glutathione in LFBWT/WT and LFBΔ/Δ cells, respectively (n = 3 biologically independent samples per group). Values represent mean + SEM. # and & indicate a statistically significant change from the LFBWT/WT at each isotopologue (# p < 0.001, & p < 0.01). i, Proteins were detected by immunoblotting in untreated DFBs. β-actin was used as a loading control. j, Representative images of collagen deposition from DFBWT/WT and DFBΔ/Δ using second harmonic generation (SHG) microscopy. Magnification, 10x. Scale bar, 100 μm. k, Box and whisker plot display the fluorescent signal from j. Each dot represents quantitative value from a 10x field. l, LFBWT/WT were treated with TGF-β1 for 24 h and proteins were detected by immunoblotting. β-actin was used as a loading control. Numbers below blots represent relative band intensities, normalized to T-eIF2a and β-actin. Unpaired two-sample t-test in all box and whisker plots. Source data
Extended Data Fig. 8
Extended Data Fig. 8. Reduced sprouting and tube formation of ECs treated with CM from LFBΔΔ.
a, Schematic of in vitro analysis of angiogenic activity of fibroblast-derived conditioned medium (CM). b, Flow cytometry to confirm the purity of the isolated lung ECs (pre = pre magnetic beads separation; CD31-, the negative fraction of beads; CD31 + , the positive fraction of beads). c, Box and whisker plots of number of branches and total branching length from the tube formation experiment. d, Box and whisker plot of %VEGF+ area and e, of %CXCL12+ area. f, Representative IF images from B16F10 tumours grown in Col1a1Cre;Atf4wt/wt and Col1a1Cre;Atf4Δ/Δ mice stained for VEGF (red) and CD31 (green). Magnification, 20x and 40x. g, Box and whisker plot display the %VEGF+CD31+ colocalization area from f (n = 5 biologically independent samples per group). Scale bar, 100 μm for 20x and 50 μm for 40x. h, Representative IF images from B16F10 tumours grown in Col1a1Cre;Atf4wt/wt and Col1a1Cre;Atf4Δ/Δ stained for CXCL12 (red) and CD31 (green). Magnification, 20x and 40x. i, Box and whisker plot display the %CXCL12+CD31+ colocalization area from h (n = 5 biologically independent samples per group). Scale bar, 100 μm for 20x and 50 μm for 40x. j, Box and whisker plot display RT-qPCR of indicative markers in Atf4wt/wt and Atf4Δ/Δ lungs (n = 4 biologically independent samples per group). k, Representative images of serial sections of lungs stained for H&E. l, Box and whisker plot of the percentage of lung tumour area from f (n = 5-6 biologically independent samples per group). m, Representative images from lungs, harvested at 3 weeks post injection (with tamoxifen treatment to start 3 days post injection). n, Box and whisker plot of the number of lung metastases. o, Representative images of serial sections of lungs stained for H&E. Scale bar, 3 mm. p, Box and whisker plot of the percentage of lung tumour area from k (n = 5–6 biologically independent samples per group). Unpaired two-sample t-test in all box and whisker plots. Source data
Extended Data Fig. 9
Extended Data Fig. 9. High ATF4 levels correlate with increased COL1 expression on human melanoma and pancreatic tumours.
a, Pearson correlation between the ISR target signature and COL1A2, FAP and PDGFRβ in Skin Cutaneous Melanoma (SKCM) and Pancreatic adenocarcinoma (PAAD). The linear regression lines along with 95% confidence intervals (shaded regions) are shown. b, Pearson correlation between randomly selected genes and COL1A1 in Skin Cutaneous Melanoma (SKCM) and Pancreatic adenocarcinoma (PAAD). The linear regression lines along with 95% confidence intervals (shaded regions) are shown. c, Representative images from immunohistochemical staining for COL1 and ATF4 of human melanoma tissues d, Pearson correlation between the % ATF4 area and % COL1 area in primary group from the human melanoma tissue array. e, Pancreatic adenocarcinoma tissue array containing sections from 24 tumours were stained for COL1 (upper panel) and ATF4 (lower panel) proteins. f, Representative images from immunohistochemical staining for COL1 and ATF4 of human pancreatic adenocarcinoma tissues. g, Pearson correlation between the % ATF4 area and % COL1 area in all samples from e and h, in grade 2 (left) and grade 3 (right) groups. Source data
Extended Data Fig. 10
Extended Data Fig. 10. Proposed model.
Working model for host ATF4’s role in tumour progression and metastasis. ATF4 is essential for the CAF activation via direct regulation of Col1a1 expression and by impacting multiple additional steps in the collagen synthesis pathway, including Glycine (Gly) and Proline (Pro) pools. The resulting abrogation of Collagen I (and potentially additional collagen isoforms) in ATF4-deficient FBs leads in dramatic reduction in secreted extracellular matrix collagen, which in turn results in defective CAF activation and reduced levels of angiogenic cytokine signaling to endothelial cells. The resulting defective angiogenesis leads to reduced support for primary and metastatic tumour growth.

Comment in

References

    1. Ho JW, Jaffee EM, Zheng L. The tumour microenvironment in pancreatic cancer—clinical challenges and opportunities. Nat. Rev. Clin. Oncol. 2020;17:527–540. doi: 10.1038/s41571-020-0363-5. - DOI - PMC - PubMed
    1. McGranahan N, Swanton C. Clonal heterogeneity and tumor evolution: past, present, and the future. Cell. 2017;168:613–628. doi: 10.1016/j.cell.2017.01.018. - DOI - PubMed
    1. Augsten M. Cancer-associated fibroblasts as another polarized cell type of the tumor microenvironment. Front. Oncol. 2014;4:62. doi: 10.3389/fonc.2014.00062. - DOI - PMC - PubMed
    1. Kalluri R. The biology and function of fibroblasts in cancer. Nat. Rev. Cancer. 2016;16:582–598. doi: 10.1038/nrc.2016.73. - DOI - PubMed
    1. Hanahan D, Coussens LM. Accessories to the crime: functions of cells recruited to the tumor microenvironment. Cancer Cell. 2012;21:309–322. doi: 10.1016/j.ccr.2012.02.022. - DOI - PubMed

Publication types