. 2022 Jun 2;5(1):532.
doi: 10.1038/s42003-022-03466-x.

Time-resolved structure-function coupling in brain networks

Affiliations

Time-resolved structure-function coupling in brain networks

Zhen-Qi Liu et al. Commun Biol. .

Abstract

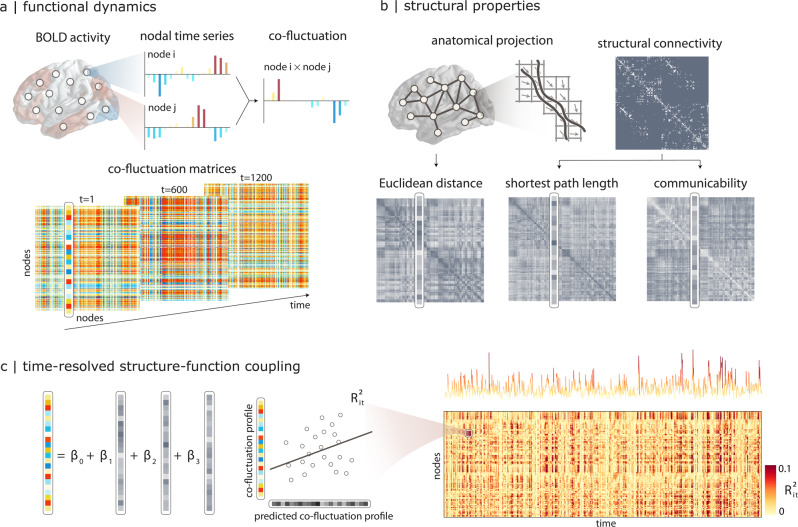
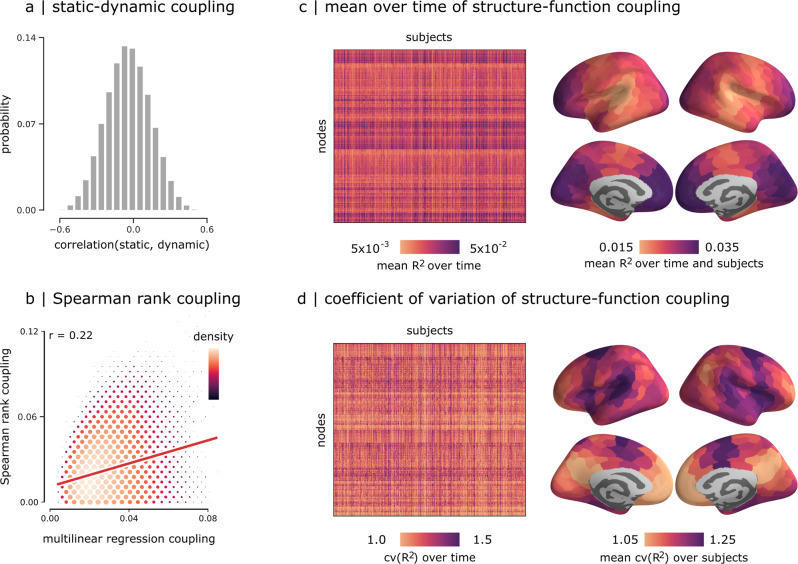
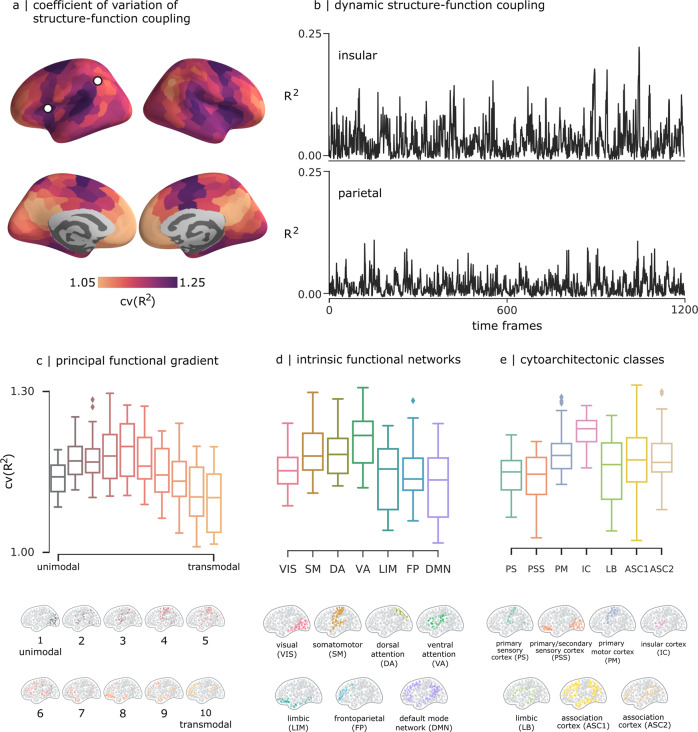
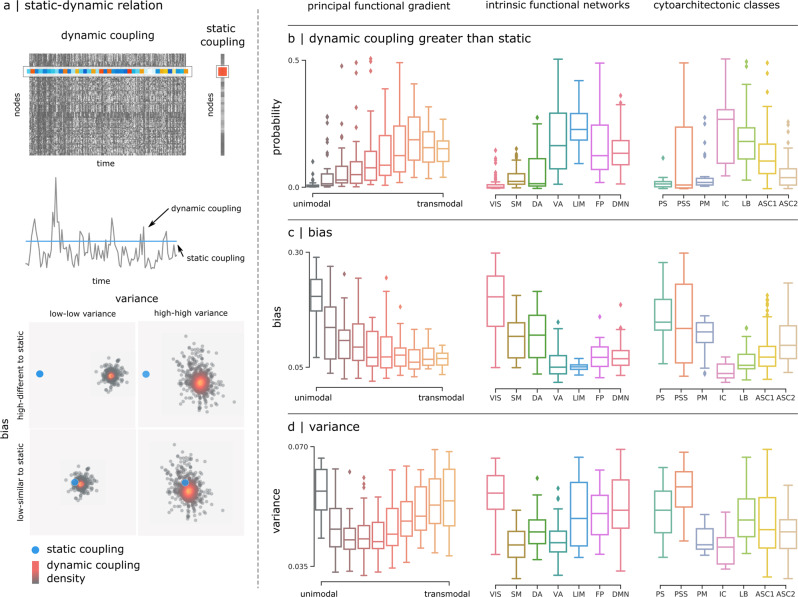
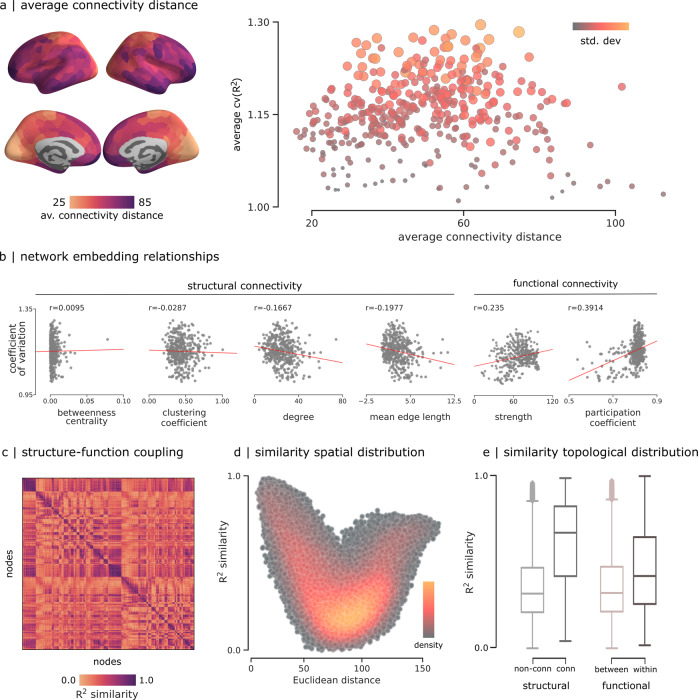
The relationship between structural and functional connectivity in the brain is a key question in systems neuroscience. Modern accounts assume a single global structure-function relationship that persists over time. Here we study structure-function coupling from a dynamic perspective, and show that it is regionally heterogeneous. We use a temporal unwrapping procedure to identify moment-to-moment co-fluctuations in neural activity, and reconstruct time-resolved structure-function coupling patterns. We find that patterns of dynamic structure-function coupling are region-specific. We observe stable coupling in unimodal and transmodal cortex, and dynamic coupling in intermediate regions, particularly in insular cortex (salience network) and frontal eye fields (dorsal attention network). Finally, we show that the variability of a region's structure-function coupling is related to the distribution of its connection lengths. Collectively, our findings provide a way to study structure-function relationships from a dynamic perspective.


Conflict of interest statement

The authors declare no competing interests.

Figures

Fig. 1
Fig. 1. Time-resolved structure-function coupling.
a The co-fluctuation of two brain regions i and j is calculated as the element-wise multiplication of the two z-scored fMRI BOLD activity time-series. The points of this time-series can be represented as one element in a co-fluctuation matrix. b Pairwise structural relationships are derived from structural connectivity networks reconstructed from diffusion MRI, including Euclidean distance between node centroids, shortest path length and communicability. c A multilinear regression model is used to predict a region’s co-fluctuation profile from its structural profile, using Euclidean distance, path length and communicability as predictors. The resulting coefficient of determination (Ri,t2) indicates how well the structural connectivity profile predicts the functional connectivity profile for a particular brain region i at a particular time point t. The procedure generates a region × time matrix that captures the fluctuation of structure-function coupling for individual regions across time. The time-series shows time-resolved fluctuations in mean R2.
Fig. 2
Fig. 2. Dynamic structure-function coupling.
a Correlations between regional patterns of static and dynamic structure-function coupling. b Correlations between dynamic structure-function coupling estimated using a multilinear model versus coupling estimated using an alternative Spearman rank correlation method. Scatter color and size represent the density. c Mean time-resolved structure-function coupling over time (left) and its mean over subjects (right). d Coefficient of variation of structure-function coupling across time (left), and its mean over subjects (right).
Fig. 3
Fig. 3. Relationship with cortical hierarchies.
a Coefficient of variation of structure-function coupling, averaged over all participants. b Time-series of regional structure-function coupling shown for one region in parietal cortex (left) and one region in insular cortex (right) from one randomly selected participant. The mean coefficient of variation is displayed for three types of cortical annotations: c 10 equally-sized bins of the principal functional gradient, d intrinsic functional networks, and e von Economo cytoarchitectonic classes.
Fig. 4
Fig. 4. Relating static and dynamic structure-function coupling.
a Top: static structure-function coupling is estimated using the functional connectivity matrix derived from the whole resting-state time-series, and compared with dynamic coupling. The dynamic structure-function coupling of node i corresponds to the ith row of the dynamic coupling matrix, while the static coupling corresponds to the ith element of static coupling vector. Middle: dynamic values represented as a time-series (black line) that fluctuates around the single static coupling value (blue line). Bottom: dynamic coupling values are represented as a scattered distribution of points (black) around the static coupling value (blue point). The two are compared in different cortical annotations using three summary statistics: b the probability of having a larger dynamic coupling value compared to the static coupling, c the bias, and d the variance of the dynamic coupling to reproduce the static values.
Fig. 5
Fig. 5. Spatial and topological determinants of structure-function coupling variability.
a Average connectivity distance calculated following, and correlated with the average coefficient of variation of the structure-function coupling from Fig. 3a. Scatter color and size represent the standard deviation. b Coefficient of variation of structure-function coupling compared to network embedding metrics derived from structural and functional networks. To account for the possible effects of outliers, we also estimated these relationships using the biweight midcorrelation (r = 0.0031; −0.0349; −0.1722; −0.1987; 0.1956; 0.1647) and percentage bend correlation (r = − 0.0152; − 0.0359; − 0.1605; − 0.1936; 0.1803; 0.2980). c R2 similarity between pairs of nodes calculated as the Pearson correlation between pairs of regional structure-function coupling averaged across subjects (d) R2 similarity correlated with Euclidean distance. Colormap shows the density of the scatter plot. e R2 similarity values grouped by structural connectedness and functional intrinsic networks.

References

    1. Avena-Koenigsberger A, Misic B, Sporns O. Communication dynamics in complex brain networks. Nat. Rev. Neurosci. 2018;19:17. doi: 10.1038/nrn.2017.149. - DOI - PubMed
    1. Suárez, L. E., Markello, R. D., Betzel, R. F. & Misic, B. Linking structure and function in macroscale brain networks. Trends Cogn. Sci. 24, 302–315 (2020). - PubMed
    1. Lurie DJ, et al. Questions and controversies in the study of time-varying functional connectivity in resting fMRI. Netw. Neurosci. 2020;4:30–69. doi: 10.1162/netn_a_00116. - DOI - PMC - PubMed
    1. Preti MG, Bolton TA, Van De Ville D. The dynamic functional connectome: State-of-the-art and perspectives. NeuroImage. 2017;160:41–54. doi: 10.1016/j.neuroimage.2016.12.061. - DOI - PubMed
    1. Shine JM, Poldrack RA. Principles of dynamic network reconfiguration across diverse brain states. NeuroImage. 2018;180:396–405. doi: 10.1016/j.neuroimage.2017.08.010. - DOI - PubMed

Publication types