. 2023 Jan;72(1):1-20.
doi: 10.1007/s00262-022-03215-3. Epub 2022 Jun 3.

Lactate modulates microglia polarization via IGFBP6 expression and remodels tumor microenvironment in glioblastoma

Affiliations

Lactate modulates microglia polarization via IGFBP6 expression and remodels tumor microenvironment in glioblastoma

Lucia Longhitano et al. Cancer Immunol Immunother. 2023 Jan.

Erratum in

Abstract

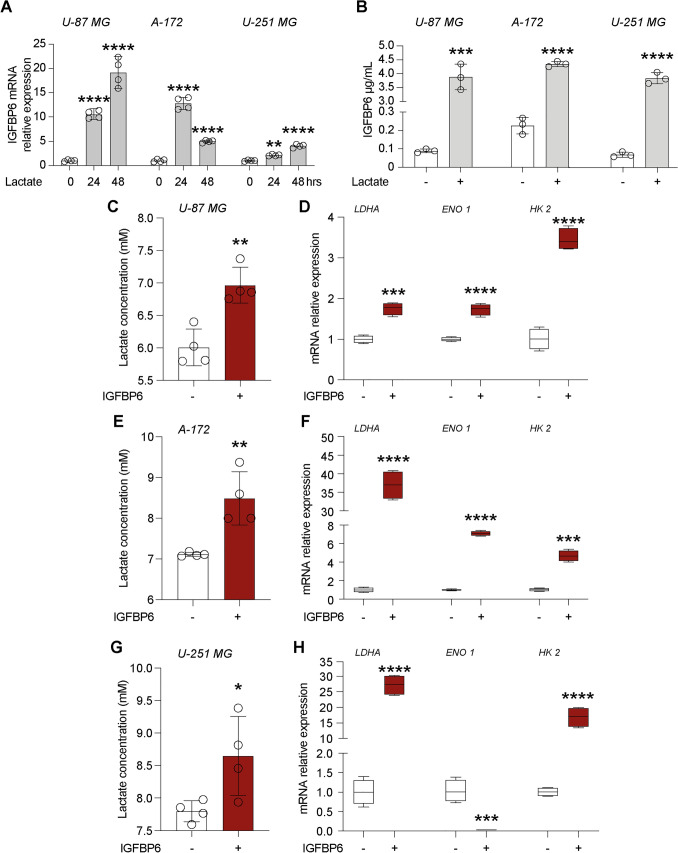
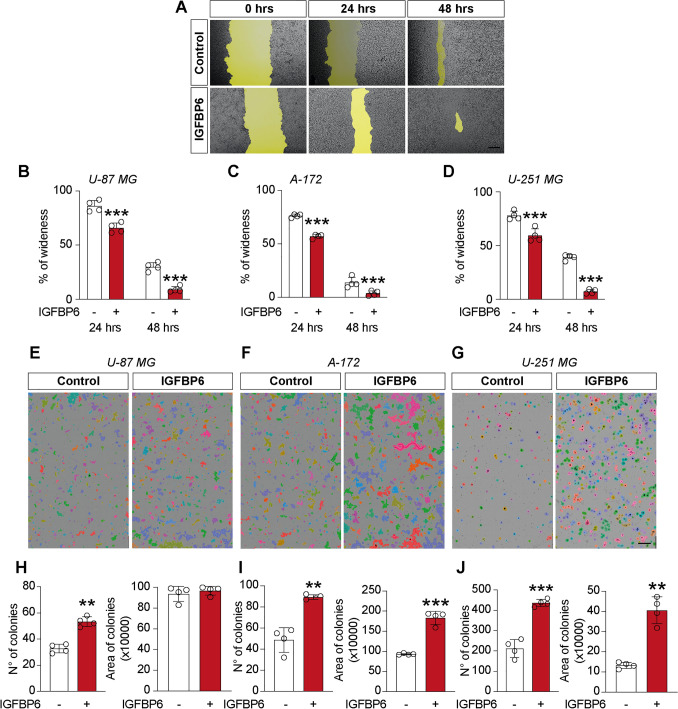
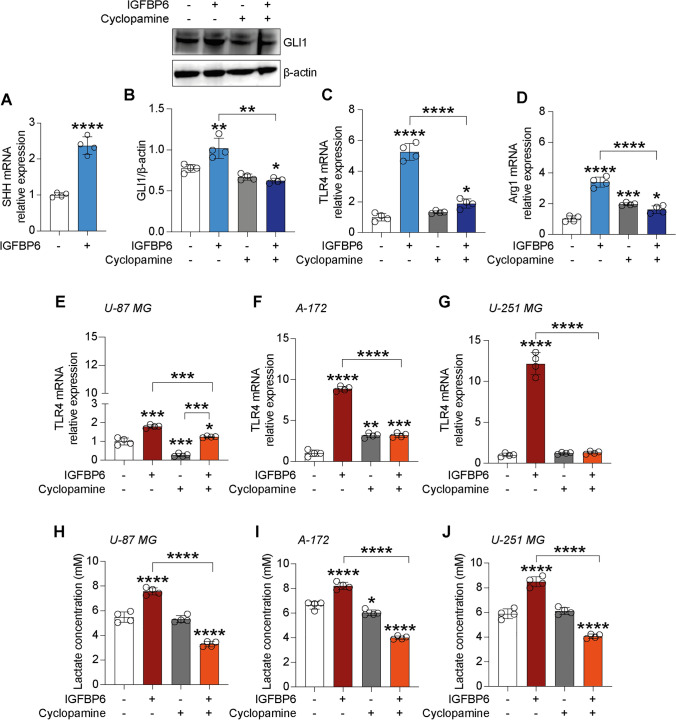
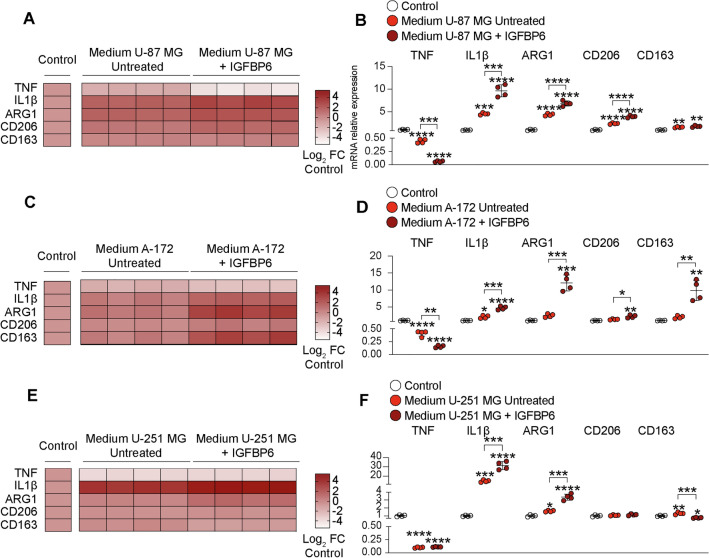
Lactic acidosis has been reported in solid tumor microenvironment (TME) including glioblastoma (GBM). In TME, several signaling molecules, growth factors and metabolites have been identified to induce resistance to chemotherapy and to sustain immune escape. In the early phases of the disease, microglia infiltrates TME, contributing to tumorigenesis rather than counteracting its growth. Insulin-like Growth Factor Binding Protein 6 (IGFBP6) is expressed during tumor development, and it is involved in migration, immune-escape and inflammation, thus providing an attractive target for GBM therapy. Here, we aimed at investigating the crosstalk between lactate metabolism and IGFBP6 in TME and GBM progression. Our results show that microglia exposed to lactate or IGFBP6 significantly increased the Monocarboxylate transporter 1 (MCT1) expression together with genes involved in mitochondrial metabolism. We, also, observed an increase in the M2 markers and a reduction of inducible nitric oxide synthase (iNOS) levels, suggesting a role of lactate/IGFBP6 metabolism in immune-escape activation. GBM cells exposed to lactate also showed increased levels of IGFBP6 and vice-versa. Such a phenomenon was coupled with a IGFBP6-mediated sonic hedgehog (SHH) ignaling increase. We, finally, tested our hypothesis in a GBM zebrafish animal model, where we observed an increase in microglia cells and igfbp6 gene expression after lactate exposure. Our results were confirmed by the analysis of human transcriptomes datasets and immunohistochemical assay from human GBM biopsies, suggesting the existence of a lactate/IGFBP6 crosstalk in microglial cells, so that IGFBP6 expression is regulated by lactate production in GBM cells and in turn modulates microglia polarization.

Keywords: Glioblastoma; IGFBP6; Lactate; Microenvironment; Microglia.


Conflict of interest statement

The authors declare that the research was conducted in the absence of any commercial or financial relationships that could be construed as a potential conflict of interest.

Figures

Fig. 1
Fig. 1
Lactate induces the expression of MCT1, promoting an oxidative metabolism in microglia cells. Effect of Lactate on A cell viability, B SLC16A1 (MCT1) and C SLC16A3 (MCT4) mRNA expression levels, in microglia cells. Evaluation of relative mRNA expression levels of D PGC1a, E TFAM, F ATP5F1A, G COX IV, H COX II, I CYTB, J ND4, following 24 and 48 h of lactate exposition, analyzed by Real-time PCR. The calculated value of 2ΔΔCt in untreated controls is 1. K Cytoplasm Mitotracker Intensity. Data are expressed as mean ± SD of at least four independent experiments. (*P < 0.05; **P < 0.005; ***P < 0.001; ****P < 0.0001). Scale bars in K 10 μm
Fig. 2
Fig. 2
Lactate induces IGFBP6 expression which promotes M2-like phenotype polarization of microglia. Effect of lactate on IGFBP6 A mRNA expression levels, B protein expression and C production in microglia cells. Evaluation of relative mRNA expression levels of D ATP5F1A, E COX IV, F COX II, G CyTB, H ND4. I Cytoplasm Mitotracker Intensity. Evaluation of relative mRNA expression levels of J Arg1, K CD 206, L CD 163 and M TNF, analyzed by real-time PCR. The calculated value of 2ΔΔCt in untreated controls is 1. Immunocytochemistry analysis of N iNOS and O Arg1, following 72 h of IGFBP6 treatment. Data are expressed as mean ± SD of at least four independent experiments. (*P < 0.05; **P < 0.005; ***P < 0.001; ****P < 0.0001). Scale bars in (I, N and O) 10 μm
Fig. 3
Fig. 3
Lactate and IGFBP6 crosstalk. Effect of lactate on IGFBP6 A mRNA expression levels and B production in Glioblastoma cells. Effect of IGFBP6 treatment on lactate production in (C) U-87 MG, E A-172 and G U-251 MG cells. Evaluation of mRNA expression levels of LDHA, ENO1 and HK2 in D U-87 MG, F A-172 and H U-251 MG cells
Fig. 4
Fig. 4
IGFBP6 enhances migratory and colony formation capacity in glioblastoma cells. Effect of IGFBP6 treatment on migratory capacity AD and colony formation capacity GH in Glioblastoma cells. Data are expressed as mean ± SD of at least four independent experiments. (*P < 0.05; **P < 0.005; ***P < 0.001; ****P < 0.0001). Scale bar in (A) 100 μm and scale bar in (E, F and G) 1 mm
Fig. 5
Fig. 5
IGFBP6 increases sonic hedgehog signalling pathway activation in GBM and microglia.Evaluation of mRNA expression levels of SHH in microglia cells treated with IGFBP6 A, and GLI1 protein expression after IGFBP6 and cyclopamine treatment B. Evaluation of mRNA expression levels of TLR4 C and ARG1 D after IGFBP6 and cyclopamine treatment in microglia cells. Evaluation of mRNA expression levels of TLR4 after IGFBP6 and cyclopamine treatment in U-87 MG E, A-172 F and U-251 MG G cells. Effect of IGFBP6 and cyclopamine treatment on lactate production in U-87 MG H, A-172 I and U-251 MG J cells. Data are expressed as mean ± SD of at least four independent experiments. (*P < 0.05; **P < 0.005; ***P < 0.001; ****P < 0.0001)
Fig. 6
Fig. 6
IGFBP6 produced by glioblastoma cells promote microglia M2-like phenotype polarization.Evaluation of mRNA expression levels of TNF, IL1β, ARG1, CD206 and CD163 in microglia cells treated with conditioned medium of A-B U-87 MG, C-D A-172, E-F U-251 MG pre-treated with IGFBP6. Data are expressed as mean ± SD of at least four independent experiments. (*P < 0.05; **P < 0.005; ***P < 0.001; ****P < 0.0001)
Fig. 7
Fig. 7
Lactate induces changes in microglia and igfbp6b expression in a zebrafish brain tumor model A Schematic representation of the genetic components of the zebrafish GBM model; B whole mount immunofluorescence of microglia (cyano) in zic:Ras larval brains treated as indicated; C count of microglia cells in whole zic:RAS control brains and treated with 20 mM lactate, data represent the means of counts performed on 5 biological replicates for each condition; d) gene expression analysis of igfbp6a and igfbp6b in 5dpf zic:Ras control larvae and treated with 20 mM lactate. (****P < 0.0001; *P < 0.01). Scale bar in B 40 μm
Fig. 8
Fig. 8
IGFBP6 was modulated in GBM patients.Analysis of IGFBP6 gene expression in brain biopsies of patients with astrocytoma, oligodendrocytoma, glioblastoma, and healthy subjects. b Pearson correlation analysis between IGFBP6 expression levels and tumor grade of brain biopsies obtained from patients affected by main brain tumors. c Pearson's correlation between IGFBP6 and IDH1 expression levels in brain biopsies of patients with glioblastoma. d Receiver operating characteristic (ROC) analysis between IGFBP6 brain expression levels in healthy subjects vs glioblastoma patients, between glioblastoma patients vs astrocytoma patients e, and vs oligodendrocytoma f. Data are expressed as mean ± SD of at least four independent experiments. (*P < 0.05; **P < 0.005; ***P < 0.001; ****P < 0.0001). Scale bar in A 50 μm

References

    1. Torrisi F, Vicario N, Spitale FM, et al. The role of hypoxia and src tyrosine kinase in glioblastoma invasiveness and radioresistance. Cancers. 2020;12(10):2860. doi: 10.3390/cancers12102860. - DOI - PMC - PubMed
    1. Poon CC, Sarkar S, Yong VW, Kelly JJP. Glioblastoma-associated microglia and macrophages: Targets for therapies to improve prognosis. Brain. 2017;140:1548. doi: 10.1093/brain/aww355. - DOI - PubMed
    1. Vicario N, Zappalà A, Calabrese G, et al. Connexins in the central nervous system: physiological traits and neuroprotective targets. Front Physiol. 2017;8:1060. doi: 10.3389/fphys.2017.01060. - DOI - PMC - PubMed
    1. Gieryng A, Pszczolkowska D, Bocian K, et al. Immune microenvironment of experimental rat C6 gliomas resembles human glioblastomas. Sci Rep. 2017 doi: 10.1038/s41598-017-17752-w. - DOI - PMC - PubMed
    1. Gieryng A, Pszczolkowska D, Walentynowicz KA, et al. Immune microenvironment of gliomas. Lab Investig. 2017;97:498–518. doi: 10.1038/labinvest.2017.19. - DOI - PubMed

MeSH terms

Substances