. 2022 Jun;28(6):1277-1287.
doi: 10.1038/s41591-022-01850-y. Epub 2022 Jun 2.

Noninvasive proteomic biomarkers for alcohol-related liver disease

Affiliations

Noninvasive proteomic biomarkers for alcohol-related liver disease

Lili Niu et al. Nat Med. 2022 Jun.

Abstract

Alcohol-related liver disease (ALD) is a major cause of liver-related death worldwide, yet understanding of the three key pathological features of the disease-fibrosis, inflammation and steatosis-remains incomplete. Here, we present a paired liver-plasma proteomics approach to infer molecular pathophysiology and to explore the diagnostic and prognostic capability of plasma proteomics in 596 individuals (137 controls and 459 individuals with ALD), 360 of whom had biopsy-based histological assessment. We analyzed all plasma samples and 79 liver biopsies using a mass spectrometry (MS)-based proteomics workflow with short gradient times and an enhanced, data-independent acquisition scheme in only 3 weeks of measurement time. In plasma and liver biopsy tissues, metabolic functions were downregulated whereas fibrosis-associated signaling and immune responses were upregulated. Machine learning models identified proteomics biomarker panels that detected significant fibrosis (receiver operating characteristic-area under the curve (ROC-AUC), 0.92, accuracy, 0.82) and mild inflammation (ROC-AUC, 0.87, accuracy, 0.79) more accurately than existing clinical assays (DeLong's test, P < 0.05). These biomarker panels were found to be accurate in prediction of future liver-related events and all-cause mortality, with a Harrell's C-index of 0.90 and 0.79, respectively. An independent validation cohort reproduced the diagnostic model performance, laying the foundation for routine MS-based liver disease testing.


Conflict of interest statement

P.E.G. is a cofounder of OmicEra Diagnostics, a company offering MS-based proteomics analysis, the founding of which was during conduction of the study. M.S. is a former employee at OmicEra Diagnostics. M.M. is currently an indirect investor in Evosep. M.T. has a speaker's fee received from Echosens and Siemens Healthcare. A.K. has served as a speaker for Norgine, Siemens and Nordic Bioscience and has participated in advisory boards for Norgine and Siemens, all outside the submitted work. The remaining authors declare no competing interests.

Figures

Fig. 1
Fig. 1. A framework for biomarker discovery in liver disease.
High-throughput, MS-based proteomics technology used to profile paired liver and plasma samples from 459 patients with ALD and 137 matched healthy controls. Proteome dysregulation in liver and plasma were integrated to capture disease-stage-relevant protein signatures in the bloodstream that were concordant with the liver. Last, a machine learning model was built to identify early stages of liver fibrosis, inflammatory activity and steatosis. We used the diagnostic models to assess their prognostic capabilities. We also validated model performance to rule out disease in low-incidence populations. In addition, the diagnostic capability of identified protein marker panels was evaluated in an independent cohort of 63 patients with ALD.
Fig. 2
Fig. 2. Liver proteome remodeling due to hepatic lesions.
a, Proteins in liver tissue that were significantly differentially abundant across stages of fibrosis, inflammatory activity and steatosis (FDR-corrected P < 0.05). n = 6/32/24/7/10 biologically independent samples for Kleiner score 0/1/2/3/4; n = 16/22/17/12/5/7 biological independent samples for NAS inflammation score 0/1/2/3/4/5; and n = 36/12/19/12 for NAS steatosis score 0/1/2/3. b, Hierarchical clustering of all significantly (sig.) dysregulated proteins in the liver proteome. Row clustering was based on median log2 intensity after z-score normalization across fibrosis stages F0–4. c, Fraction (%) of up- and downregulated liver-specific and secreted proteins. d, Top 20 proteins that correlate with Kleiner, NAS inflammation and NAS steatosis scores, respectively. Number of independent biological replicates for each disease group is the same as in a. e, Distribution of log2 intensity values of top four proteins correlating to each histologic score. The gray line in the middle of the box is the median, the top and bottom of the box represent the upper and lower quartile values of the data and the whiskers represent the upper and lower limits for consideration of outliers (Q3 + 1.5 × IQR, Q1 – 1.5 × IQR). IQR represents IQR (Q3 – Q1). Source data
Fig. 3
Fig. 3. Liver–plasma proteome integration.
a, Overlapping proteins between liver and plasma proteomes. The number of proteins significantly correlated between liver and plasma across patients is denoted (FDR-corrected P < 0.05 and minimum absolute Pearson r = 0.3). b, Liver–plasma proteome abundance map showing median protein intensity (assessed by MS intensity) in the liver as a function of that in the plasma. c, As in b but highlighting enzymes, clotting factors and functional plasma proteins known to be related to liver. df, Represented proteins (C7 (d), IGHA1 (e) and CRP (f)) were significantly correlated in paired liver and plasma samples, with Pearson r indicated. g, Top: proteins codysregulated in liver and plasma during disease progression; the dendrogram shows significantly codysregulated proteins across histologic stages of liver fibrosis, inflammation and steatosis. Bottom: functional categorization of proteins. Heat maps display z-scored median intensities across fibrosis stages within liver (left) and plasma (right). Source data
Fig. 4
Fig. 4. Prediction models based on plasma proteome for biopsy-verified fibrosis, inflammation and steatosis.
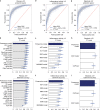
a–i, Prediction models. a,d,g. ROC–AUC statistics in fivefold cross-validation repeated ten times in a protein panel-based logistic regression model for detection of significant liver fibrosis (F2–4) (a), mild inflammatory activity (NAS I2–5) (d) and any steatosis (NAS S1–3) (g). b,c,e,f,h,i, F1 score (b,e,h) and balanced accuracy (c,f,i) in cross-validation of the above-mentioned logistic regression models in comparison with best-in-class existing markers for fibrosis (b,c), inflammation (e,f) and steatosis (h,i). Performance of existing markers was calculated based on both their established clinical cutoffs if applicable (indicated by ‘test’) and machine learning cutoffs (indicated by ‘model’). Error bars represent s.d. b,c,e,f,h,i, n = 50 independent experiments in the fivefold 10× cross-validation procedure; data presented as mean ± s.d. Source data
Fig. 5
Fig. 5. Validation of model performance and assessment of prognostic capability.
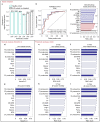
a, Percentage accuracy of proteomics models in excluding significant fibrosis, advanced fibrosis, mild inflammatory activity and steatosis in the healthy cohort (GALA–HP; n = 136), and in excluding significant fibrosis and advanced fibrosis in the subset of the GALA–ALD cohort (n = 97) who were not biopsied due to low liver stiffness as measured by FibroScan (<6.0 kPa). b, ROC curve and the corresponding AUC of F2, I2 and S1 proteomics models for the independent validation cohort (n = 63). c, ROC–AUC of F2, I2 and S1 proteomics models for the validation cohort in comparison with available best-in-class clinical tests. di, Survival and prognostic analyses of proteomics models. Survival analyses and clinical tests in prediction of future liver-related events (d) and all-cause mortality (g) during the entire follow-up period, ranked by Harrell’s C-index in descending order. e,f, Prognostic analyses of proteomics models and clinical tests in prediction of 3-year (e) and 5-year (f) liver-related events, ranked by ROC–AUC in descending order. h,i, Prognostic analyses of proteomics models and clinical tests in prediction of 3-year all-cause mortality (h) and 5-year all-cause mortality (i), ranked by ROC–AUC in descending order. NFS, NAFLD fibrosis score. Source data
Extended Data Fig. 1
Extended Data Fig. 1. Proteomics workflow.
a-c. Proteome profiling workflow for liver biopsy samples. d-f. Proteome profiling workflow for plasma samples. g. Computational and bioinformatics tools used for processing and analyzing proteomics data.
Extended Data Fig. 2
Extended Data Fig. 2. Proteomics data quality.
a,d. Pair-wise Pearson correlation between proteomes of the workflow replicates in the plasma (a) and liver (d) proteomics experiments. b, e. The coefficients of variation (CV) of each protein assessed by quality assessment samples are plotted against their median intensity, with (b) showing the plasma- and (e) showing the liver proteomics experiment. c, f. Protein intensity as a function of abundance rank in the plasma- and liver proteomes (c and f, respectively). Source data
Extended Data Fig. 3
Extended Data Fig. 3. Histologic score distributions.
a. Stage distribution of fibrosis (based on Kleiner score), inflammatory activity (summed lobular inflammation and ballooning scores) and steatosis (percentage of hepatic fat content) in patients whose liver biopsy proteomes were analyzed (n = 79). b. Stage distribution of fibrosis, inflammatory activity, and steatosis in patients whose plasma proteome were analyzed and passed quality control (n = 358). c. Stage distribution of fibrosis, inflammatory activity, and steatosis in the independent validation cohort of ALD (n = 63). Note that the number of patients in each sub-group may not add up to the total number due to missing histological scores.
Extended Data Fig. 4
Extended Data Fig. 4. Remodeled plasma proteome due to hepatic lesions.
a. Proteins in plasma significantly differentially abundant across stages/scores of fibrosis, inflammatory activity and steatosis in the disease cohort with biopsy-verified histologic scores (FDR-corrected p-value < 0.05). n = 35/124/106/27/66 biologically independent samples for Kleiner score 0/1/2/3/4; n = 72/90/82/53/30/23 biological independent samples for NAS inflammation score 0/1/2/3/4/5; and n = 154/85/72/39 for NAS steatosis score 0/1/2/3. b. Hierarchical clustering of significantly dysregulated plasma proteins. Row clustering was based on median log2-intensity after Z-score normalization across fibrosis stages HP-F0-F4. c. Ratios of up- and downregulated proteins of ‘liver-specific’ and ‘secreted’ proteins. d. Fold change (fibrosis stage F4/F0) of significant proteins when using the whole dataset (n = 358) and the subset with paired liver proteomes available (n = 79) e. Top 20 plasma proteins that correlate with the Kleiner score, inflammatory activity, and steatosis stages. f. Distribution of log2-intensity values of top four correlating proteins in plasma for each histologic score. Number of independent biological replicates is the same as Panel (a). The gray line in the middle of the box is the median, the top and the bottom of the box represent the upper and lower quartile values of the data and the whiskers represent the upper and lower limits for considering outliers (Q3 + 1.5*IQR, Q1‐1.5*IQR). IQR is the interquartile range (Q3–Q1). Source data
Extended Data Fig. 5
Extended Data Fig. 5. Model performance among state-of-the-art classifiers.
a-c. The F1 score of all classifiers for predicting significant fibrosis (F2, a), mild inflammatory activity (I2, b), and any steatosis (S1, c). Classifiers were ranked in decreasing order of F1 score. d-f. The area under the receiver operating characteristics curve (ROC-AUC) of all classifiers for predicting F2 (d), I2 (e), and S1 (f). Classifiers were ranked in decreasing order of ROC-AUC.
Extended Data Fig. 6
Extended Data Fig. 6. Abundance distribution of proteins in the selected marker panels.
a-c. Proteins comprising the marker panels for identifying significant fibrosis (a), mild inflammatory activity (b) and any steatosis (c), and their abundance distribution (log2-transformed) as a function of corresponding histologic stages. The gray line in the middle of the box is the median, the top and the bottom of the box represent the upper and lower quartile values of the data and the whiskers represent the upper and lower limits for considering outliers (Q3 + 1.5*IQR, Q1‐1.5*IQR). IQR is the interquartile range (Q3–Q1). For Panel (a), n = 35/124/106/27/66 biologically independent samples for Kleiner score 0/1/2/3/4 except for protein ASAP1 which has n = 30/94/62/13/24; For panel (b), n = 72/90/82/53/30/23 biological independent samples for NAS inflammation score 0/1/2/3/4/5 except for protein ALDOB which has n = 49/72/65/50/29/22. For panel (c), n = 154/85/72/39 for NAS steatosis score 0/1/2/3 except for protein ALDOB which has n = 97/80/71/39. Source data
Extended Data Fig. 7
Extended Data Fig. 7. Distribution of individual components of the liver-related event composite endpoint.
Percentage of occurrence of each liver-related events during the follow-up period. Abbreviations: AH, alcoholic hepatitis; HCC, hepatocellular carcinoma; HE, hepatic encephalopathy; HRS, hepatorenal syndrome; SBP, spontaneous bacterial peritonitis. Source data

Comment in

References

    1. Moon AM, Singal AG, Tapper EB. Contemporary epidemiology of chronic liver disease and cirrhosis. Clin. Gastroenterol. Hepatol. 2020;18:2650–2666. doi: 10.1016/j.cgh.2019.07.060. - DOI - PMC - PubMed
    1. Julien J, Ayer T, Bethea ED, Tapper EB, Chhatwal J. Projected prevalence and mortality associated with alcohol-related liver disease in the USA, 2019-40: a modelling study. Lancet Public Health. 2020;5:e316–e323. doi: 10.1016/S2468-2667(20)30062-1. - DOI - PubMed
    1. Pimpin L, et al. Burden of liver disease in Europe: epidemiology and analysis of risk factors to identify prevention policies. J. Hepatol. 2018;69:718–735. doi: 10.1016/j.jhep.2018.05.011. - DOI - PubMed
    1. Sheron N. Alcohol and liver disease in Europe–simple measures have the potential to prevent tens of thousands of premature deaths. J. Hepatol. 2016;64:957–967. doi: 10.1016/j.jhep.2015.11.006. - DOI - PubMed
    1. Nilsson E, Anderson H, Sargenti K, Lindgren S, Prytz H. Clinical course and mortality by etiology of liver cirrhosis in Sweden: a population based, long-term follow-up study of 1317 patients. Aliment. Pharmacol. Ther. 2019;49:1421–1430. doi: 10.1111/apt.15255. - DOI - PubMed

Publication types