. 2022 Jun;19(6):759-769.
doi: 10.1038/s41592-022-01498-z. Epub 2022 Jun 2.

Identification of cell types in multiplexed in situ images by combining protein expression and spatial information using CELESTA

Affiliations

Identification of cell types in multiplexed in situ images by combining protein expression and spatial information using CELESTA

Weiruo Zhang et al. Nat Methods. 2022 Jun.

Abstract

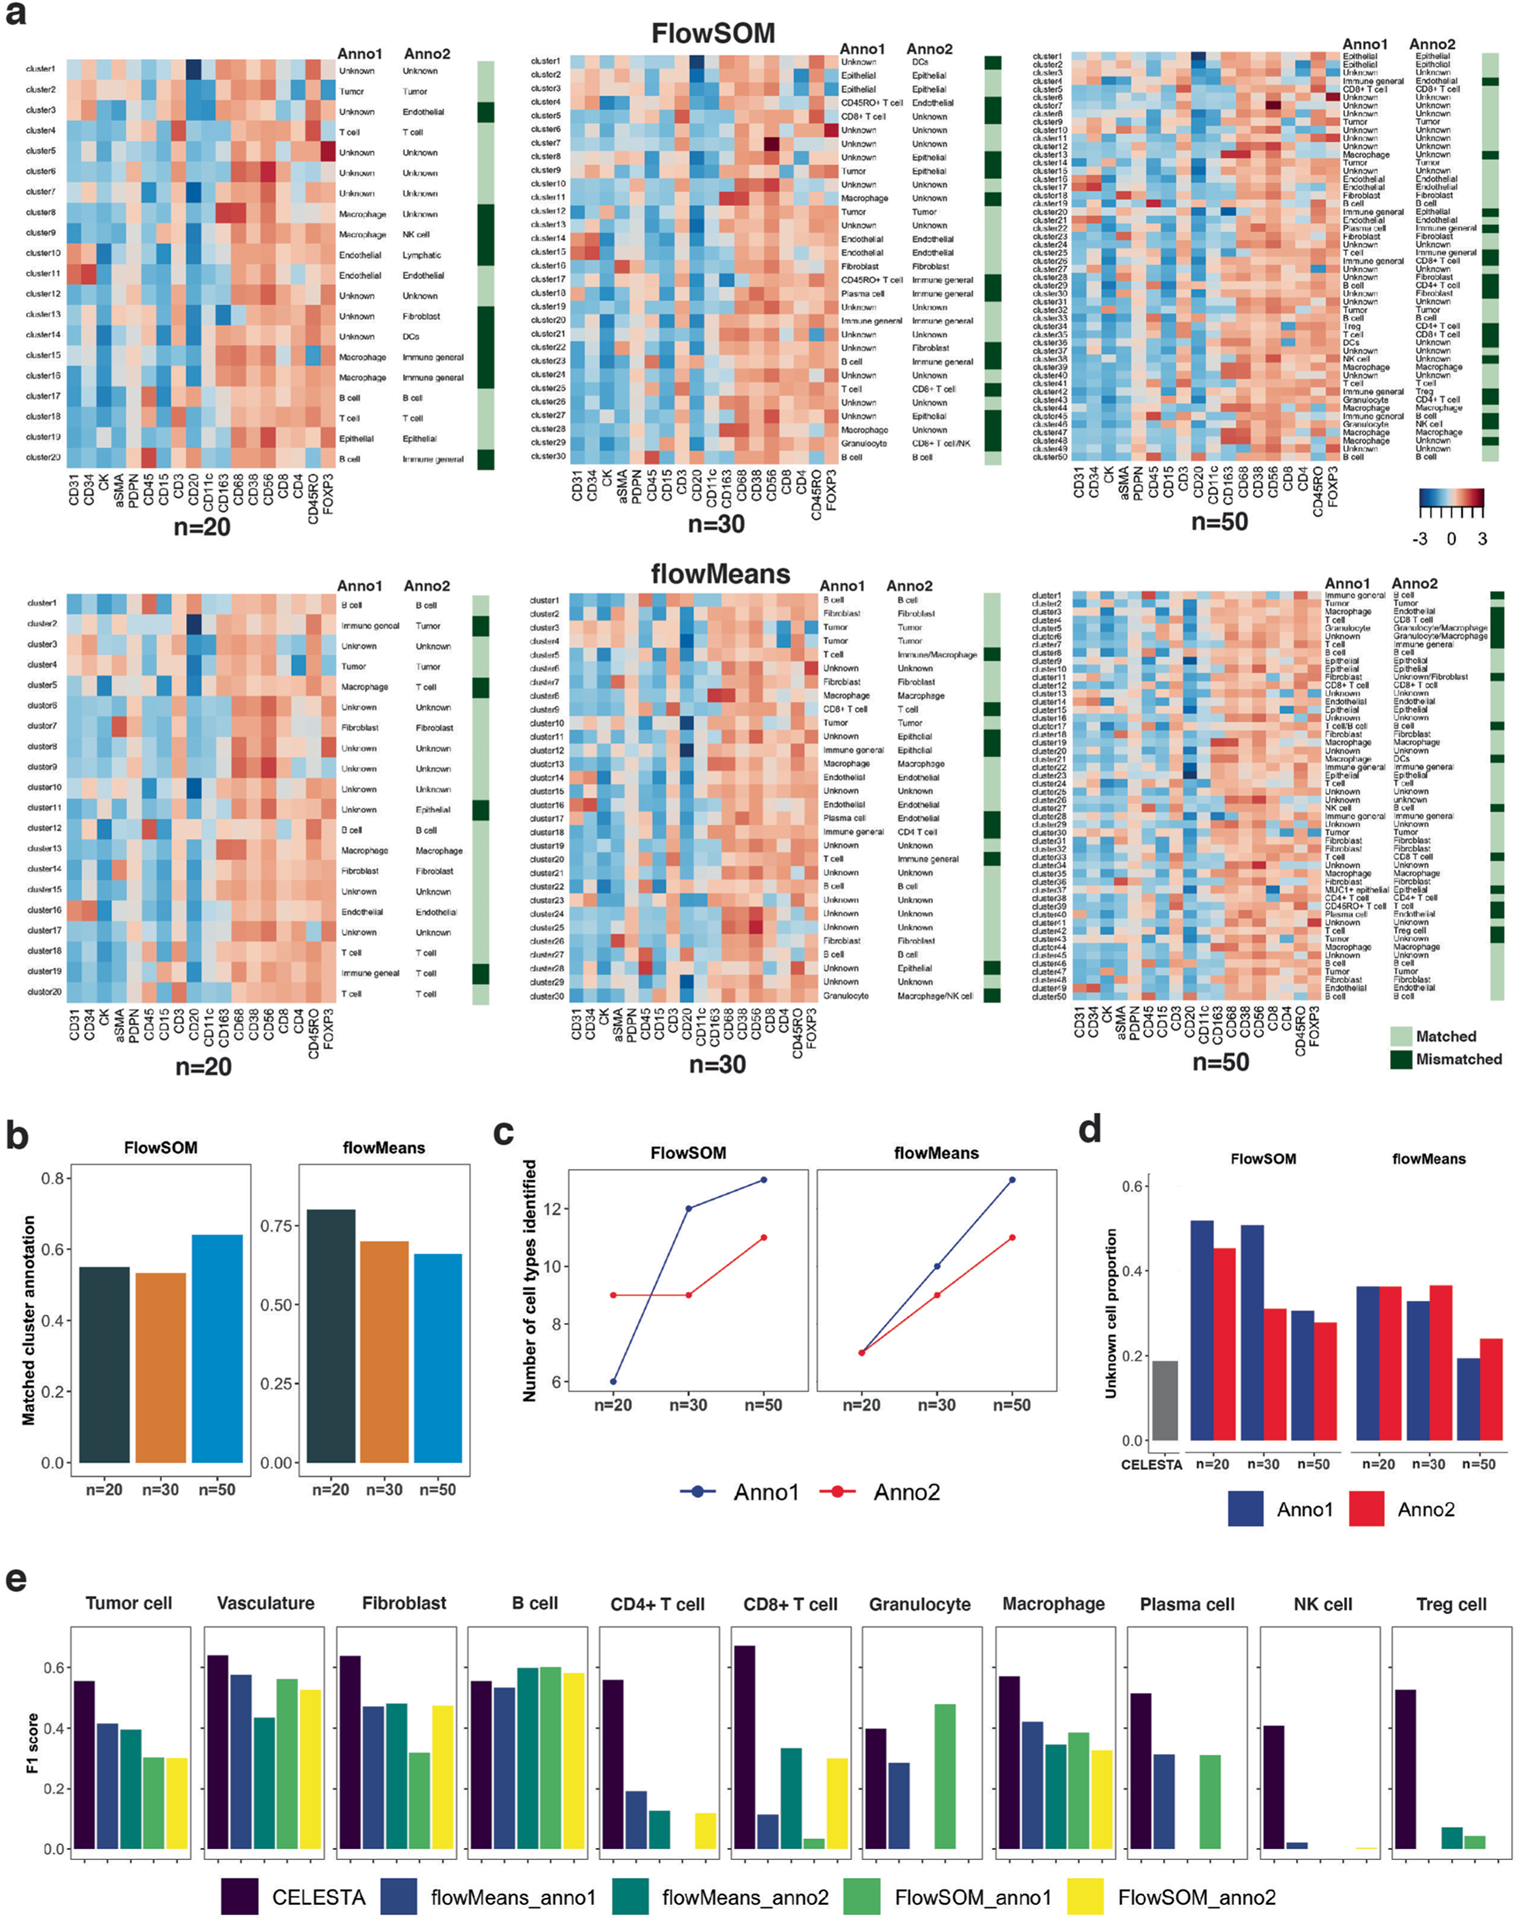
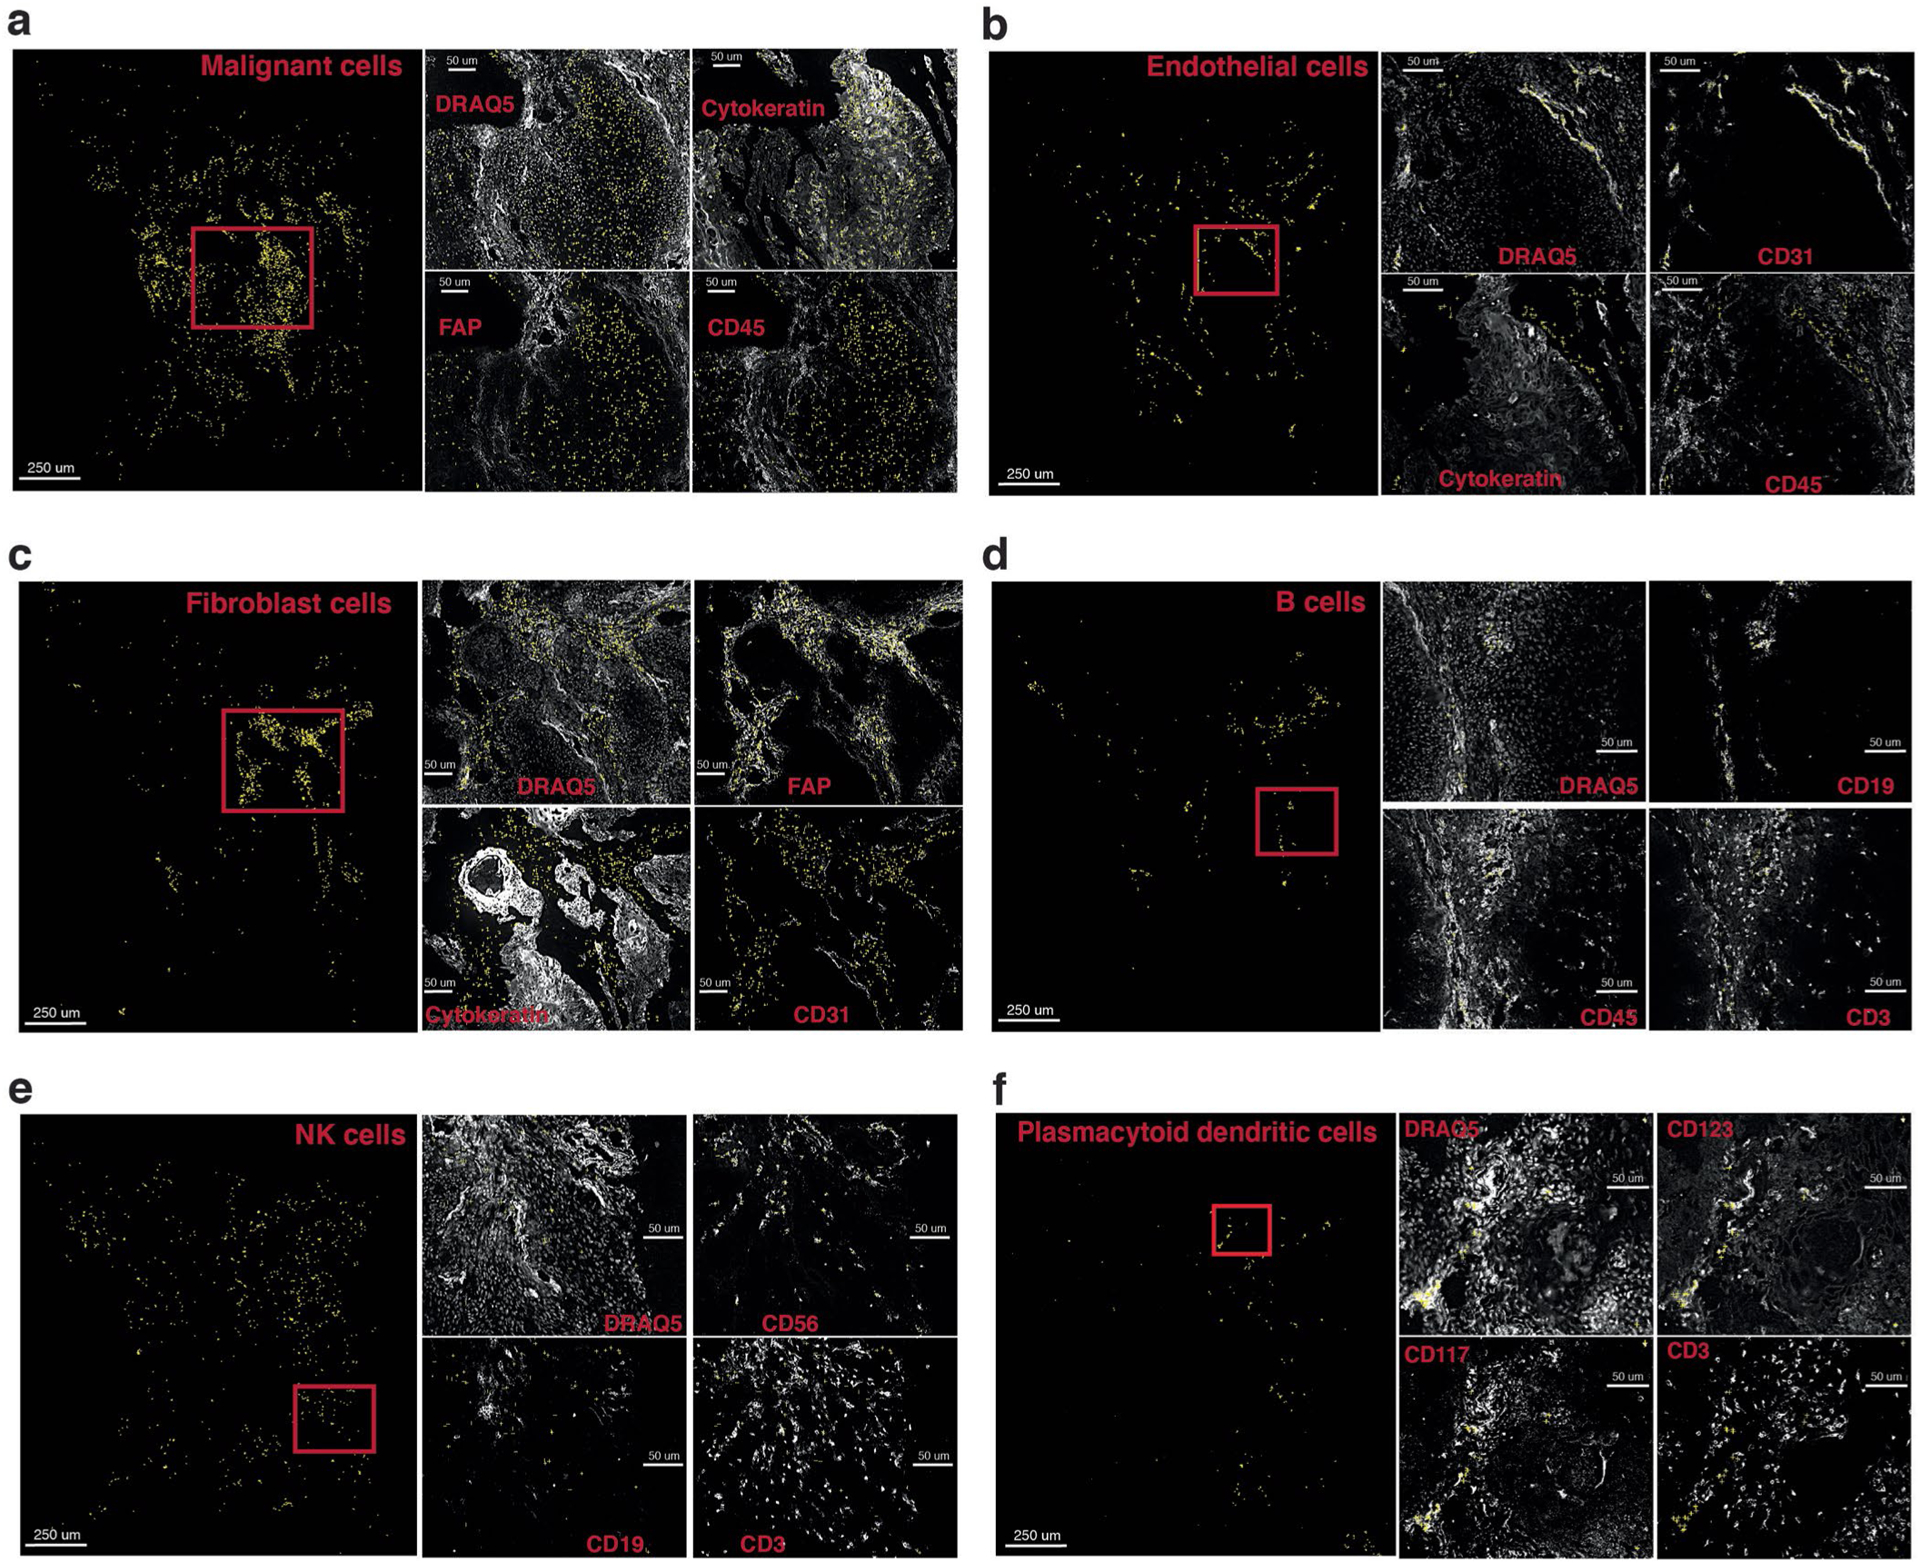
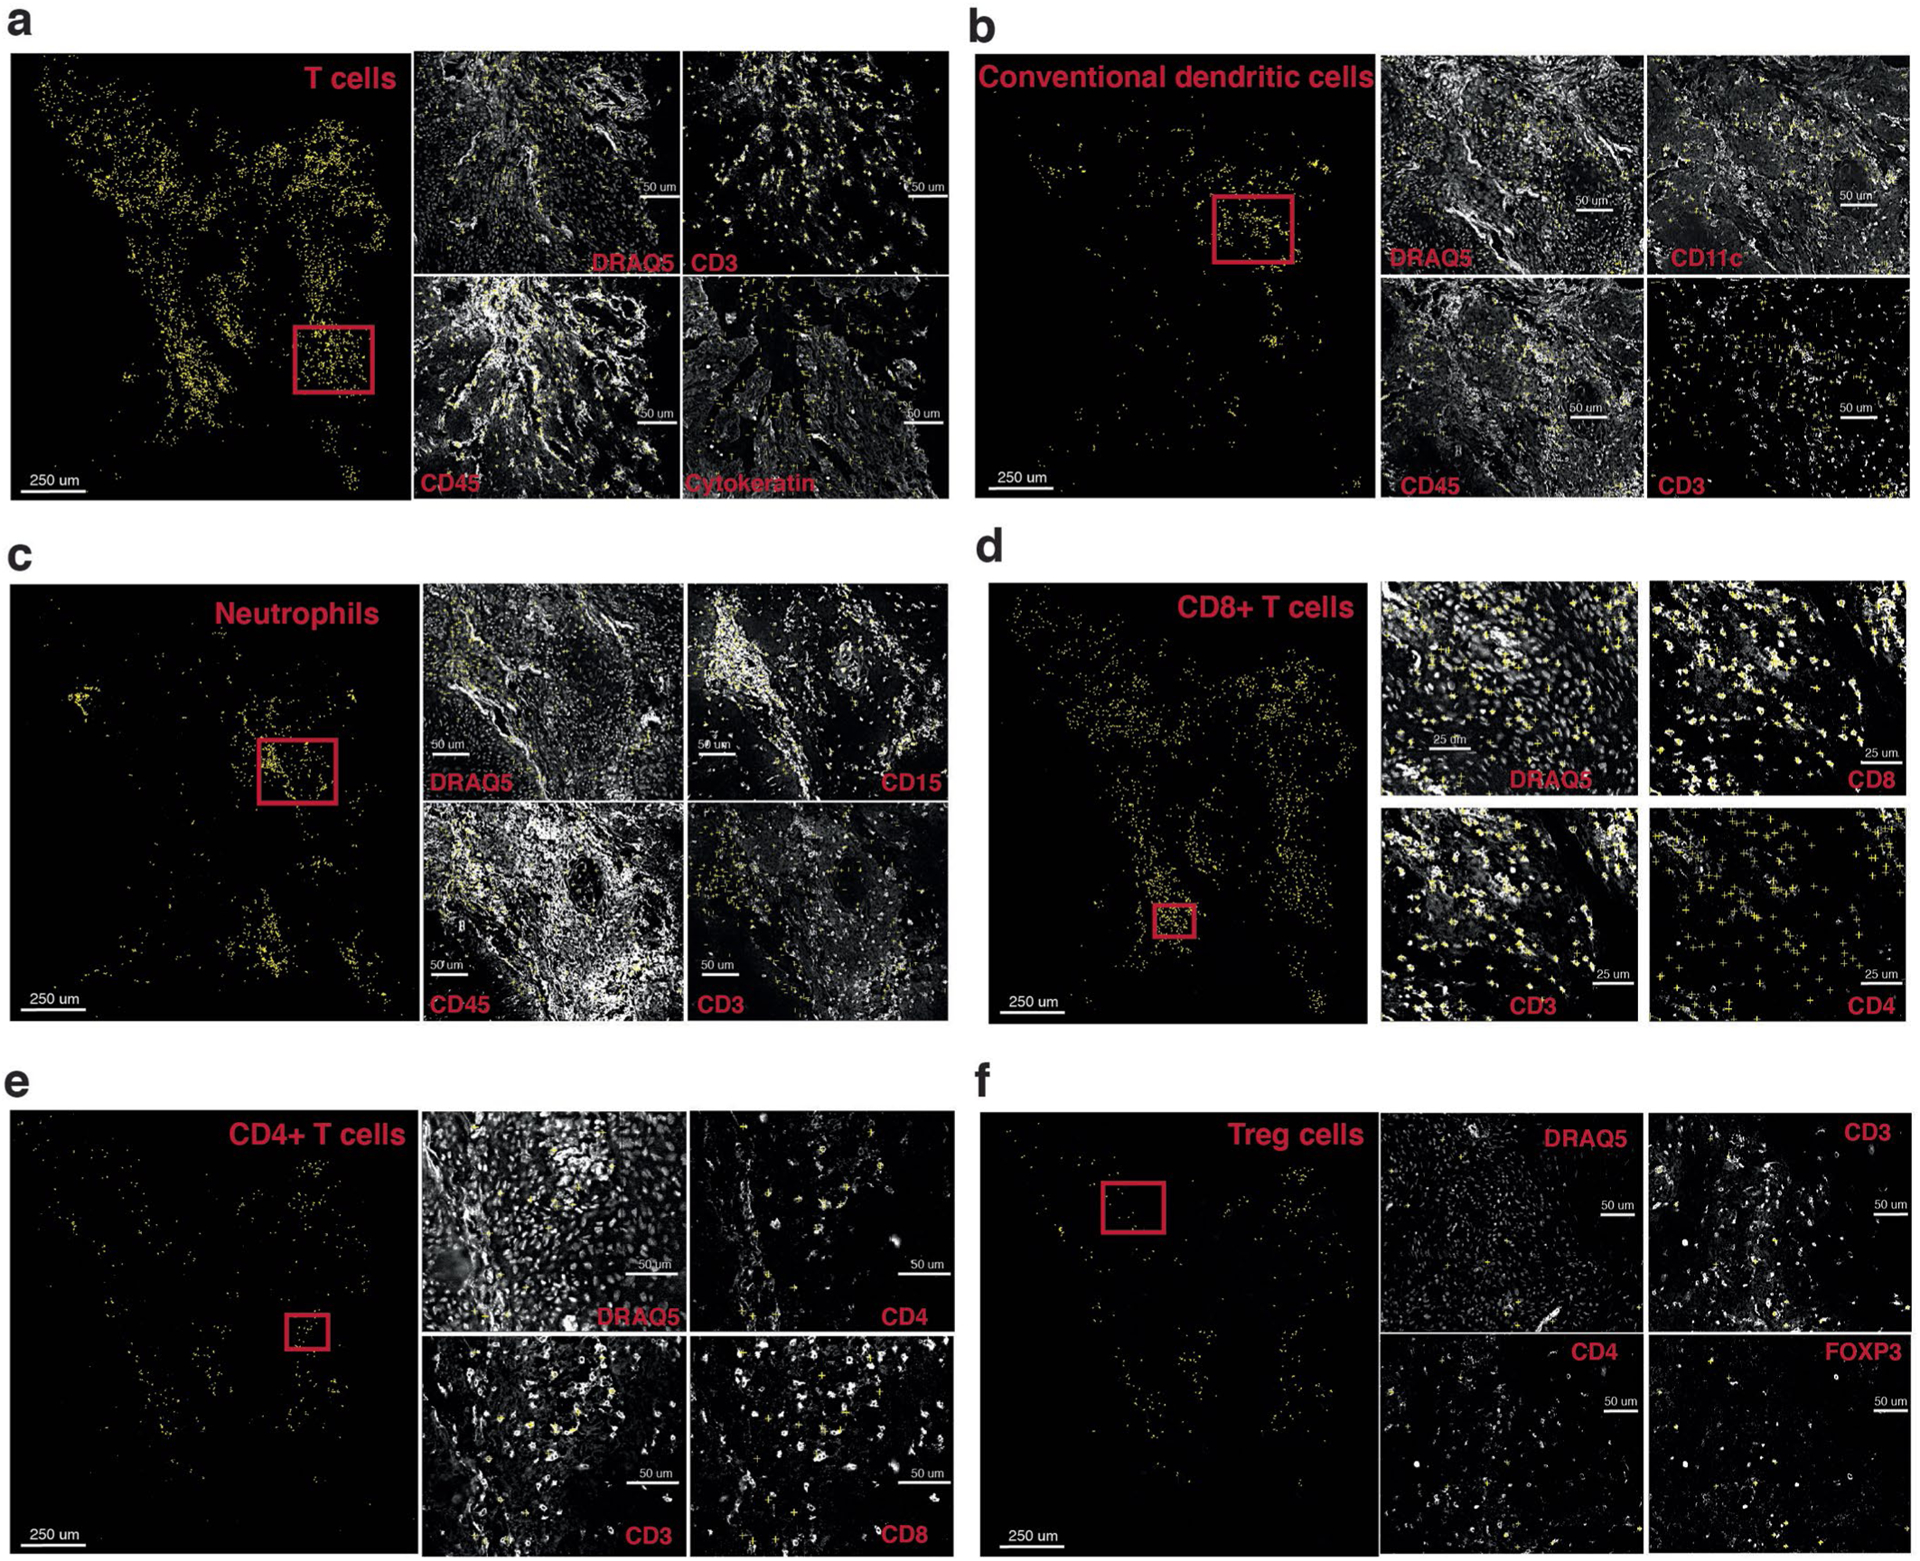
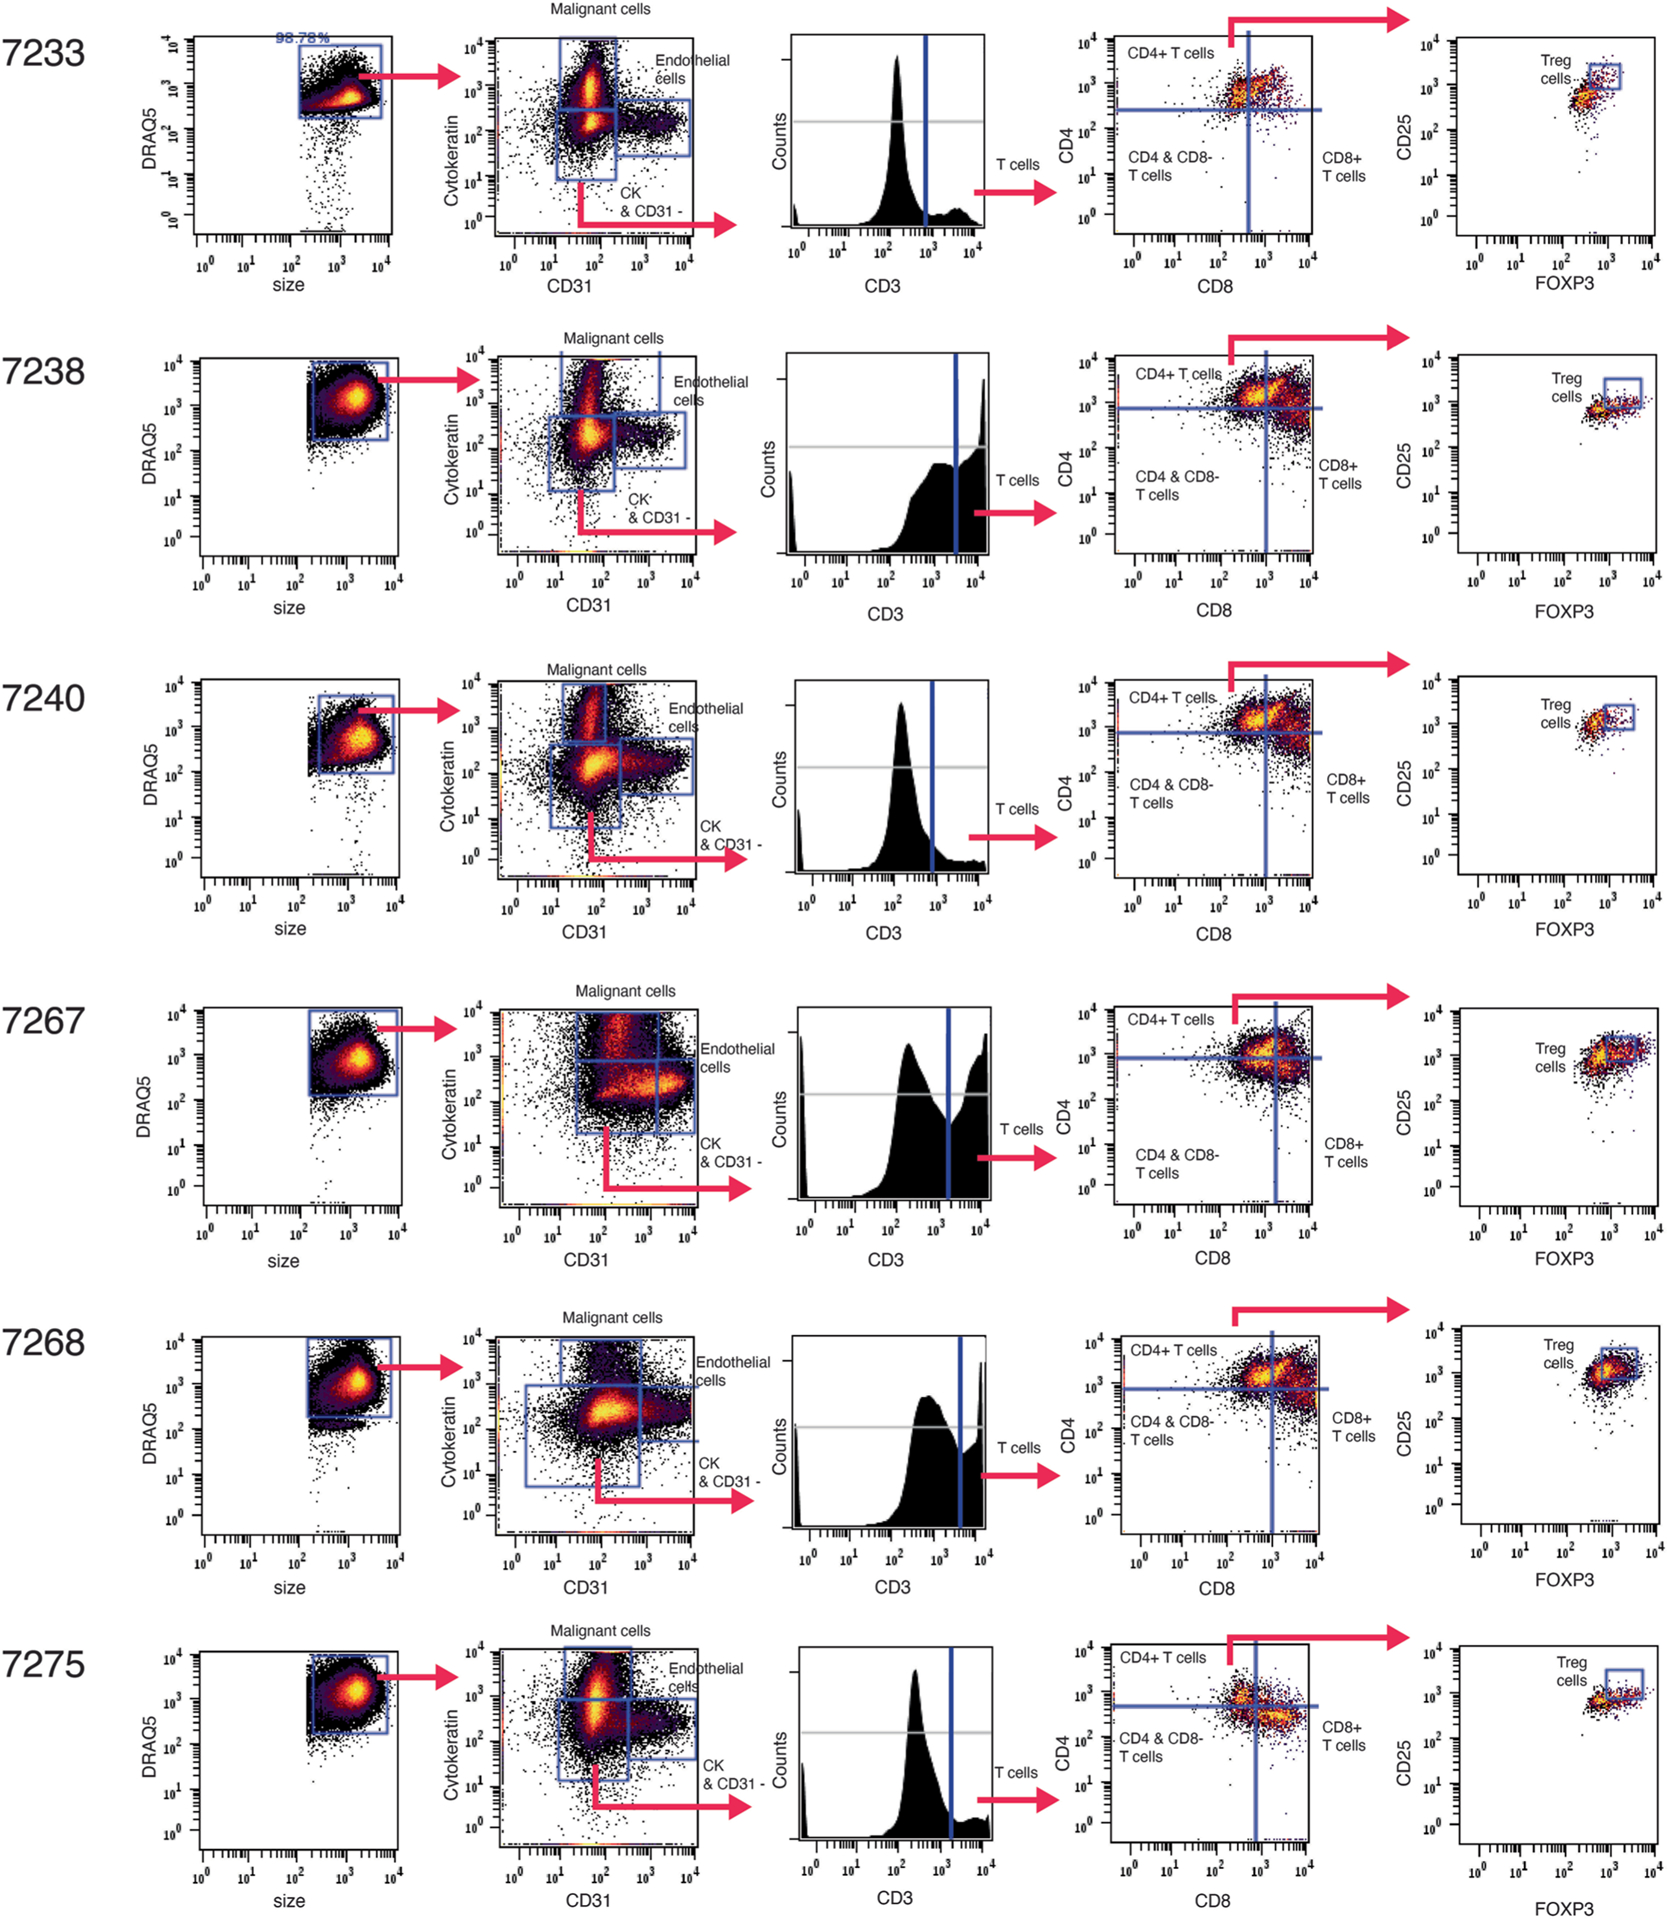
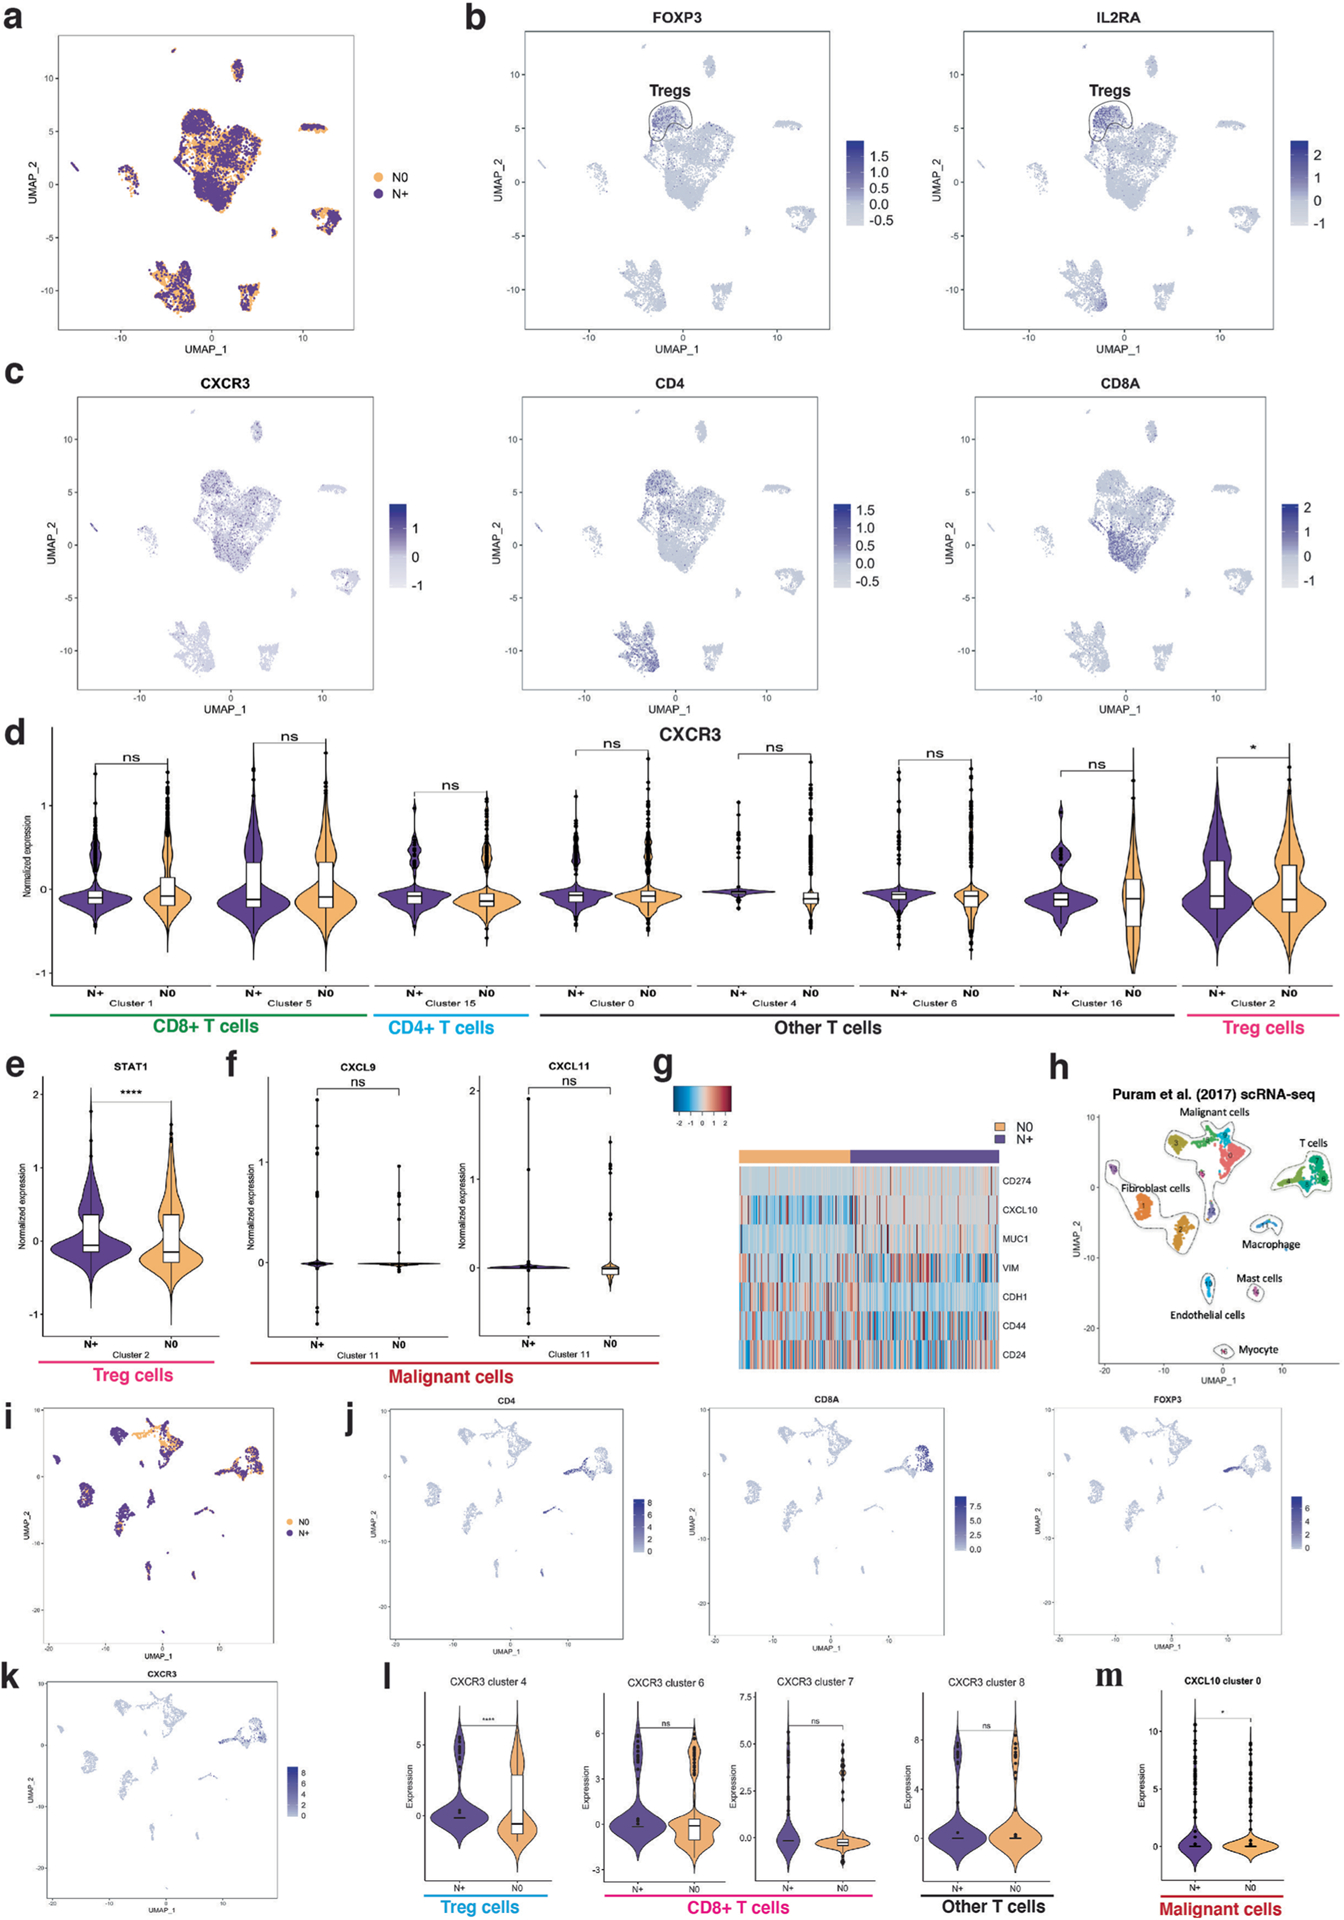
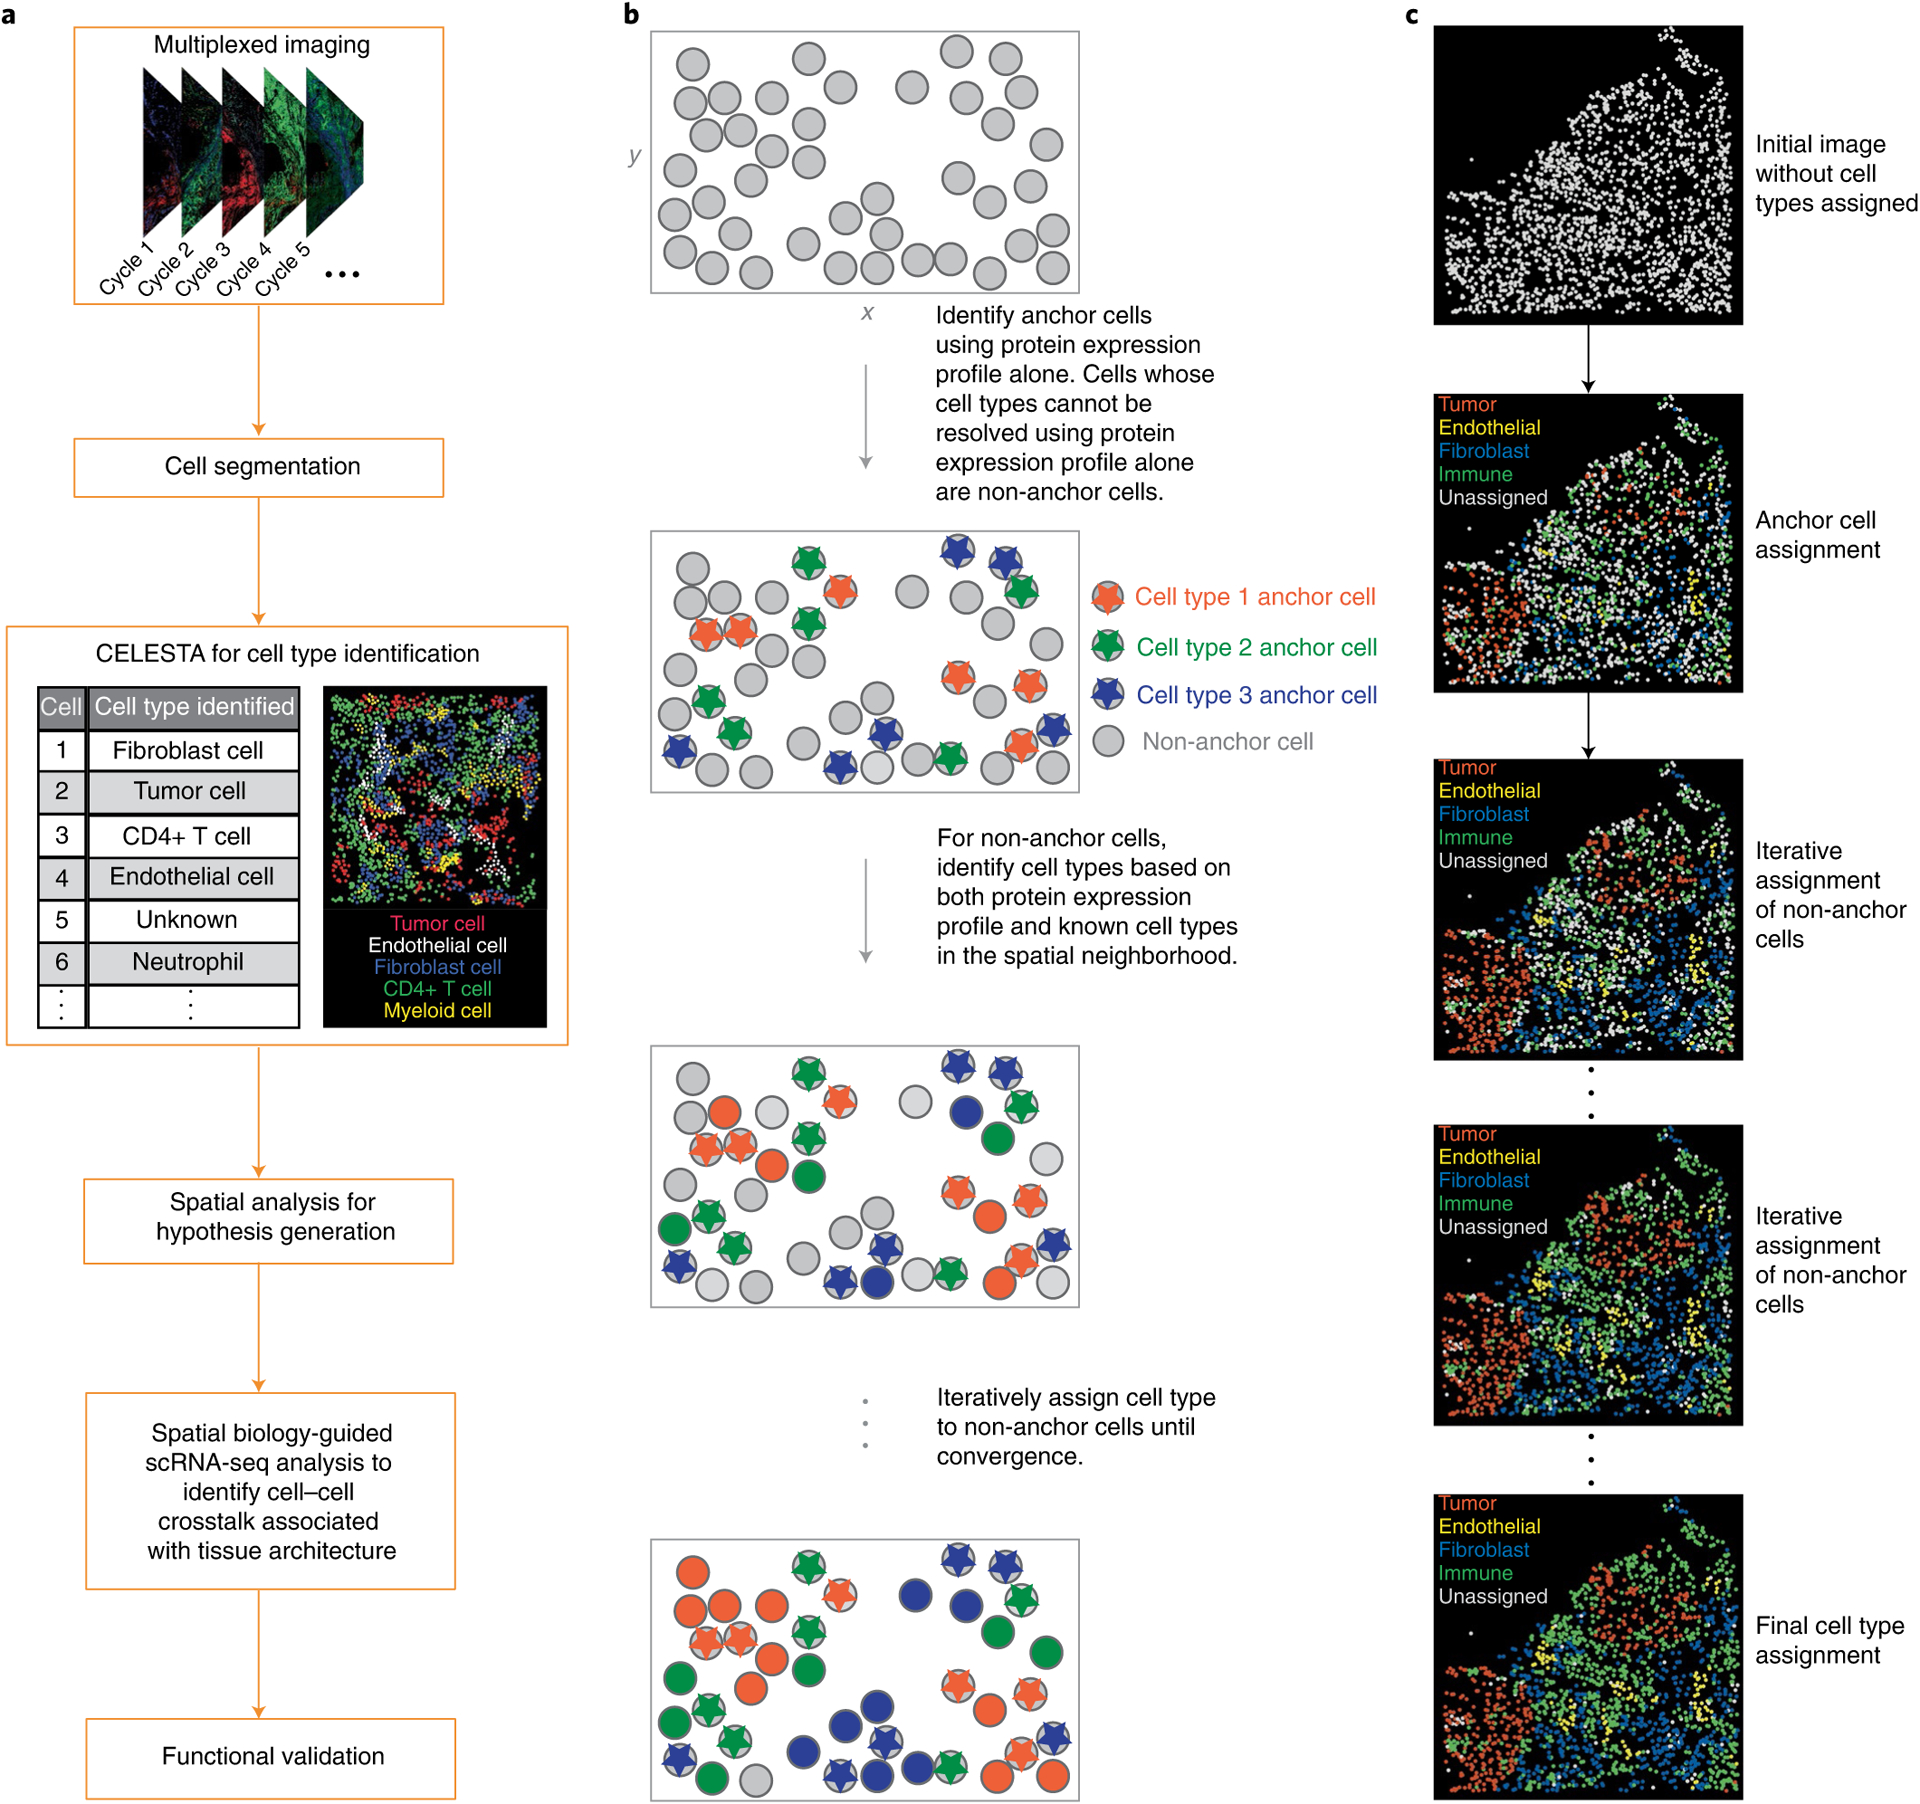
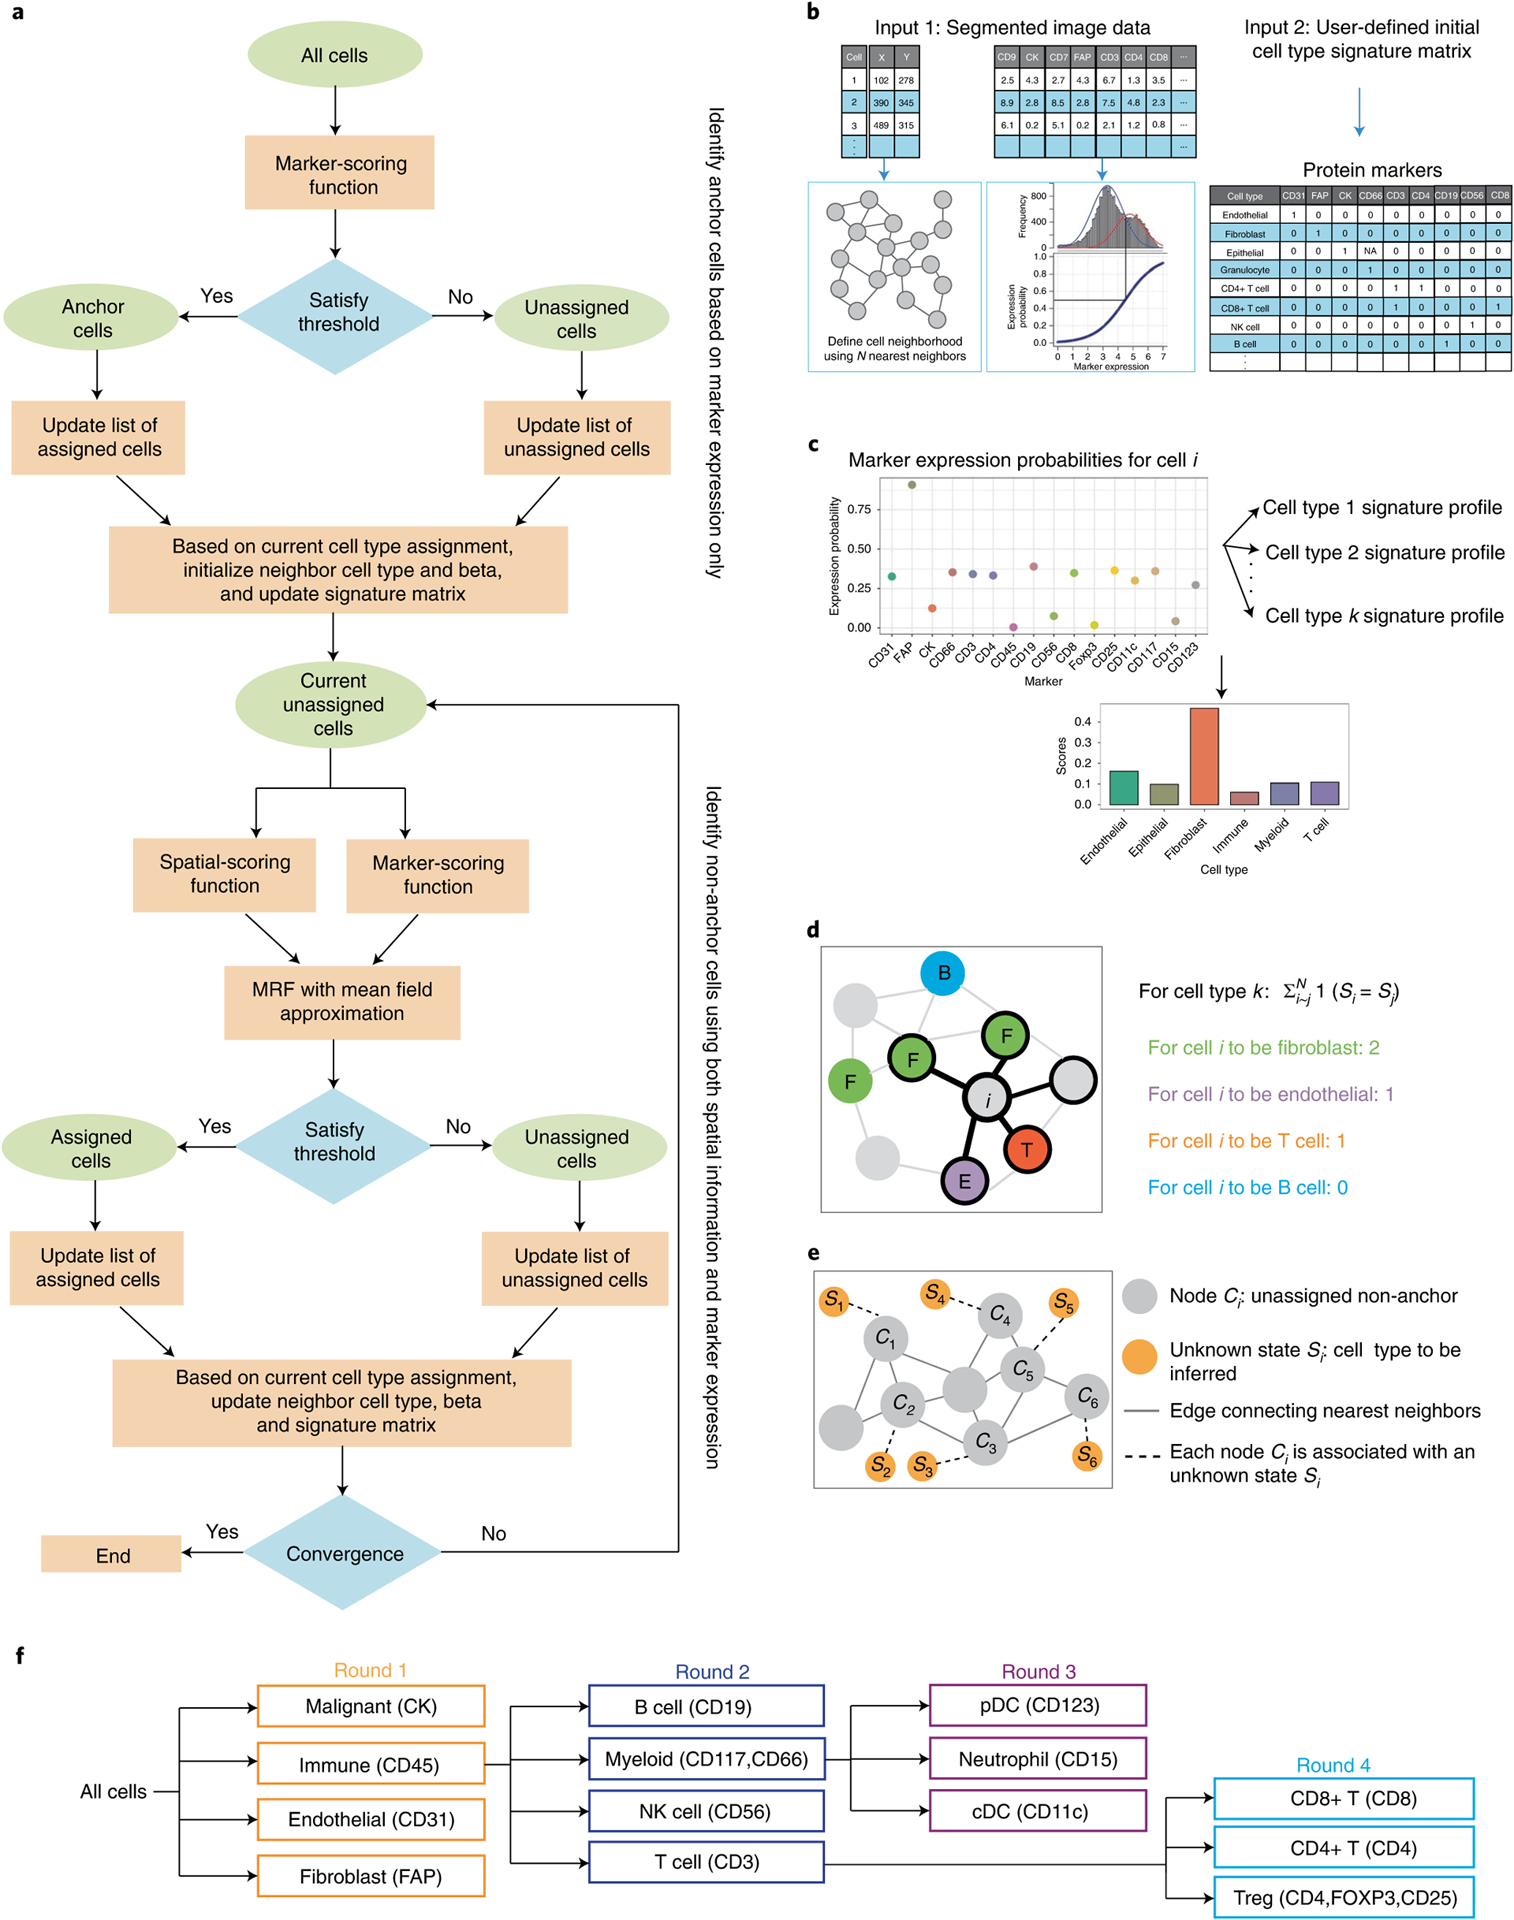
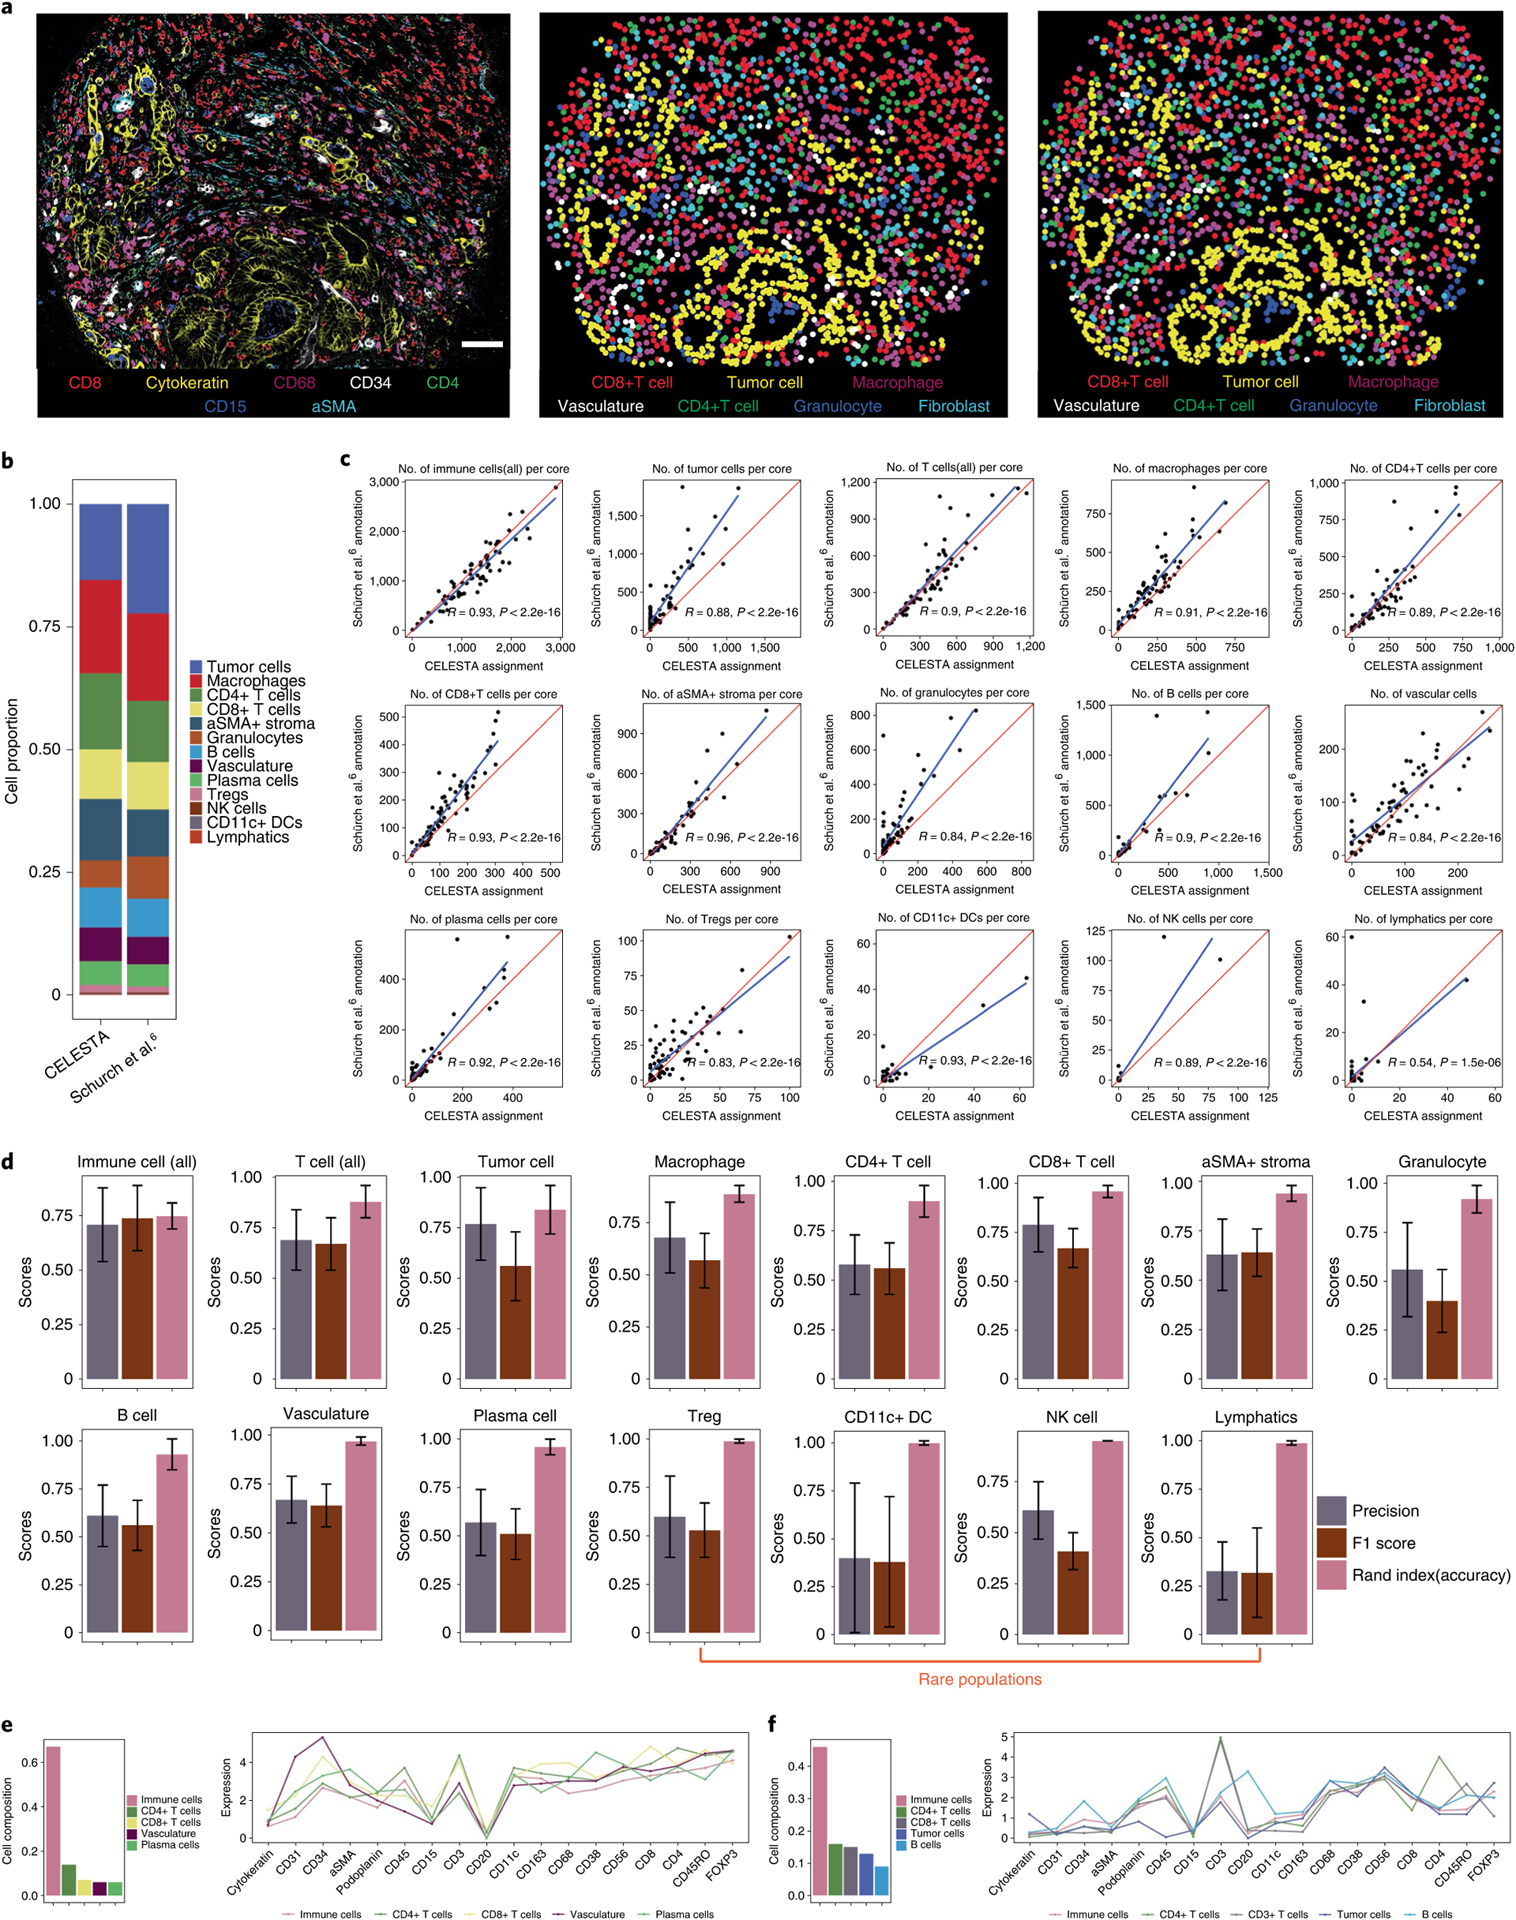
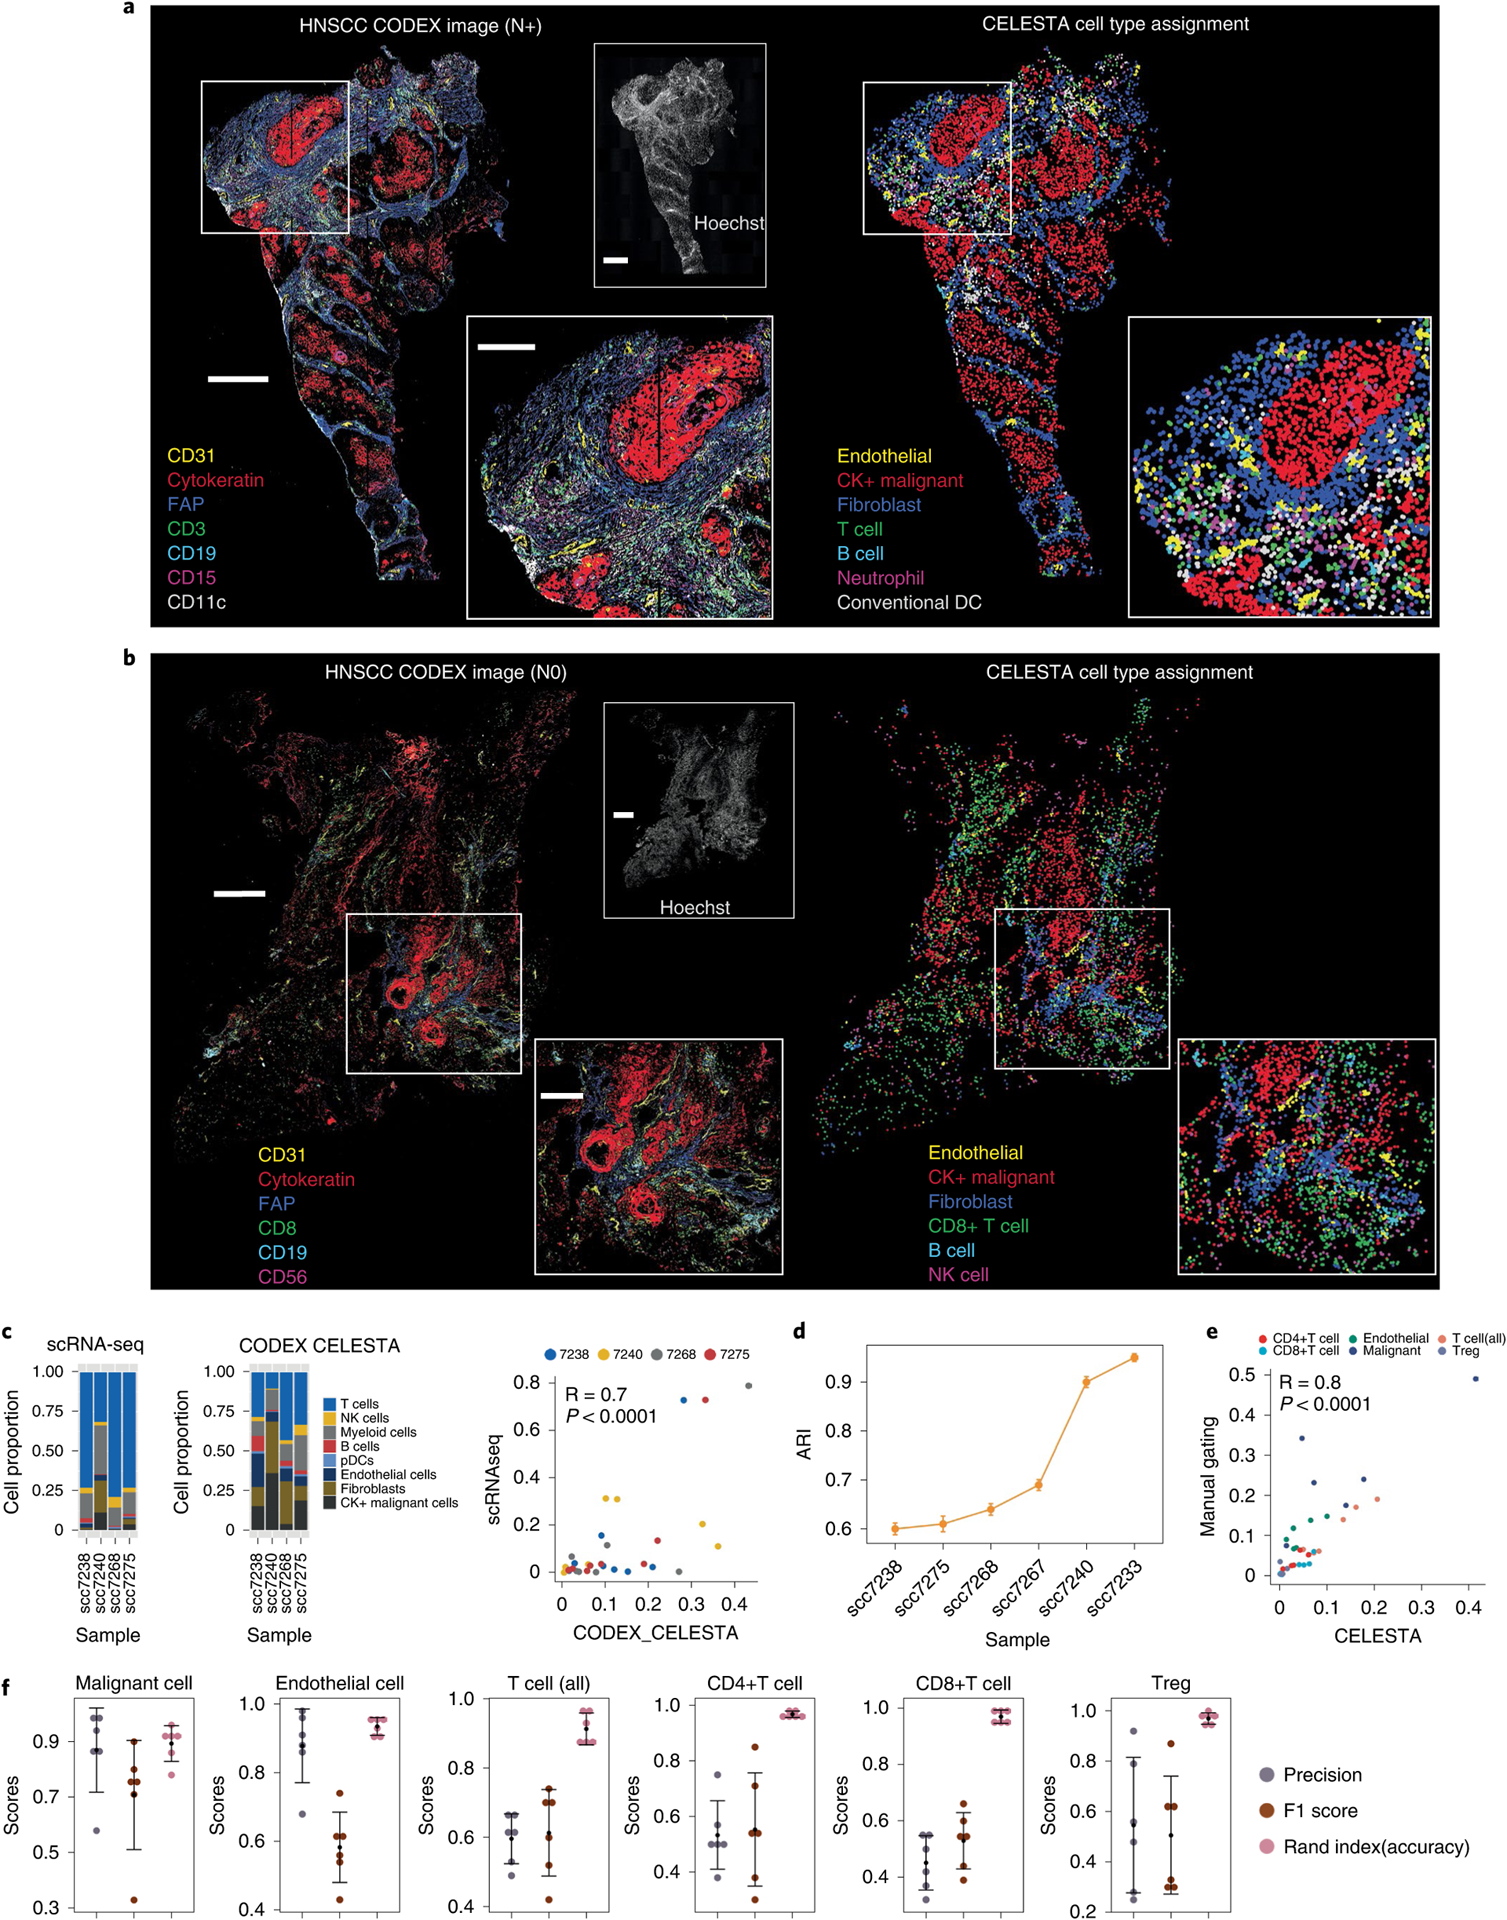
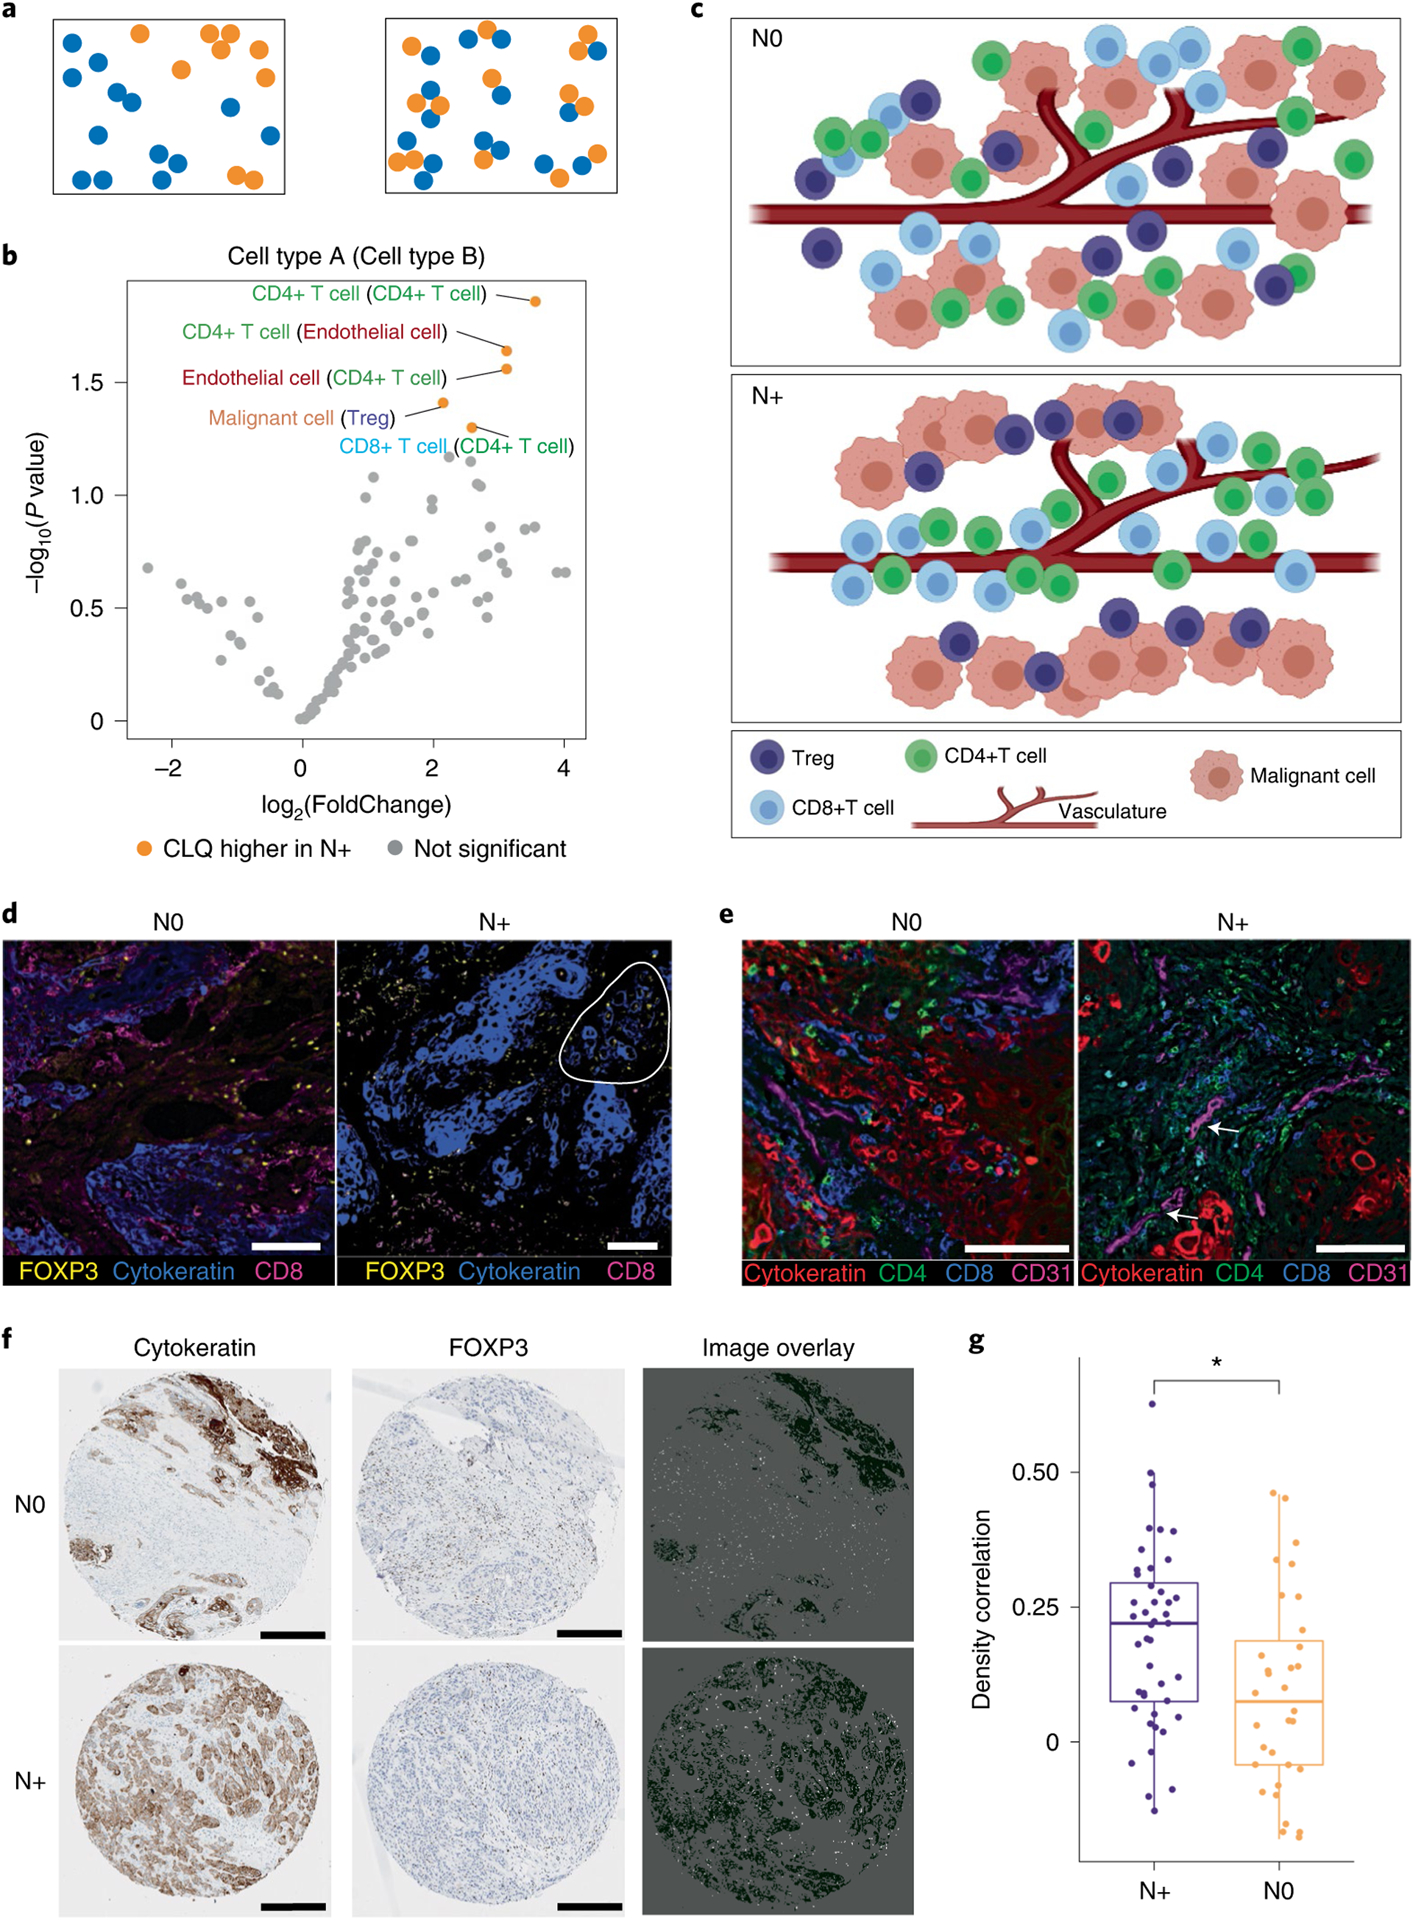
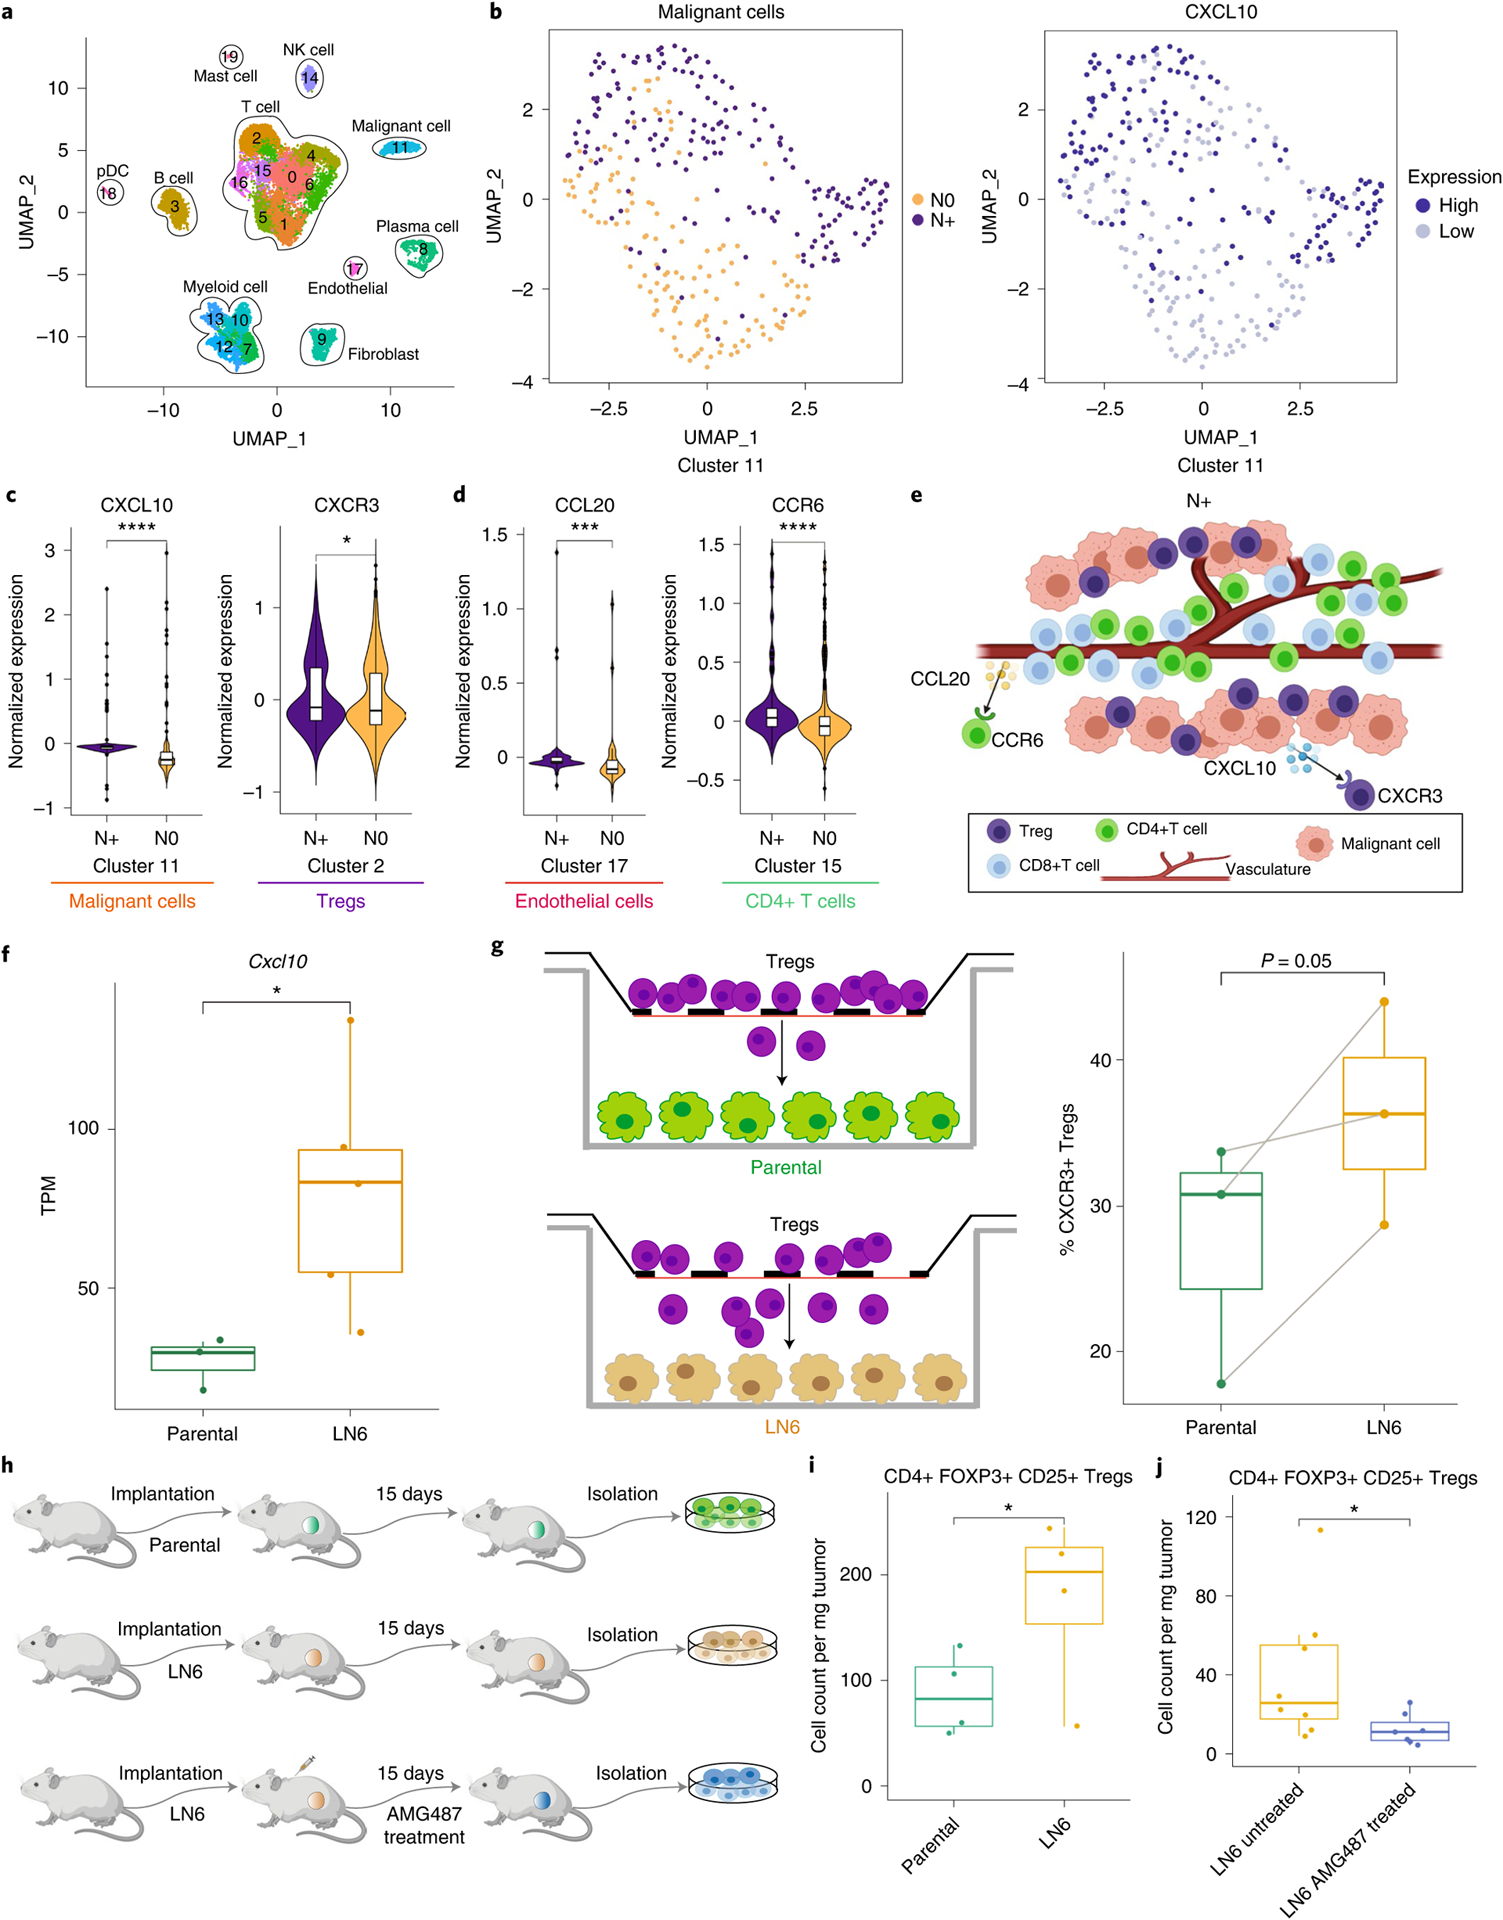
Advances in multiplexed in situ imaging are revealing important insights in spatial biology. However, cell type identification remains a major challenge in imaging analysis, with most existing methods involving substantial manual assessment and subjective decisions for thousands of cells. We developed an unsupervised machine learning algorithm, CELESTA, which identifies the cell type of each cell, individually, using the cell's marker expression profile and, when needed, its spatial information. We demonstrate the performance of CELESTA on multiplexed immunofluorescence images of colorectal cancer and head and neck squamous cell carcinoma (HNSCC). Using the cell types identified by CELESTA, we identify tissue architecture associated with lymph node metastasis in HNSCC, and validate our findings in an independent cohort. By coupling our spatial analysis with single-cell RNA-sequencing data on proximal sections of the same specimens, we identify cell-cell crosstalk associated with lymph node metastasis, demonstrating the power of CELESTA to facilitate identification of clinically relevant interactions.


Figures

Extended Data Fig. 1 |
Extended Data Fig. 1 |. Neighborhood enrichment analysis, expression distributions of protein markers and illustration of final updated prior knowledge cell type signature matrix.
(a) Cell neighborhood enrichment analysis using Schurch et al. cell type annotations. Red versus blue indicates that cells of a given cell type (columns) are significantly enriched versus are not enriched, respectively, in the 5-nearest neighborhood of a cell type of interest (rows). Cells of the same or similar cell type are enriched in each other’s neighborhoods. Statistical significance is determined with p-value right tail < 0.05 and Benjamini–Hochberg adjusted p-value < 0.05. Legend for cell count indicates the number of cells below 2,000, (2,000–4,000), (4,000–6,000), (6,000–8,000) and over 8,000 for each cell type across the 70 samples. (b) Histograms of protein expressions in a representative sample. Red curves illustrate fitted bimodal Gaussian mixture model. The protein expression levels were ArcSinh transformed. (c) Illustration of final updated prior knowledge cell type signature matrix on a representative sample from Schurch et al. data. The initial user-defined cell type signature matrix is shown in Supplementary Table 1. There were no NK cells identified in this sample, and thus information on NK cells is not updated in the cell type signature matrix. White to red color indicates values from 0 to 1. Gray color indicates NA values.
Extended Data Fig. 2 |
Extended Data Fig. 2 |. Comparison between CELESTA and Schurch et al. annotations on the colorectal cancer dataset.
(a) Confusion matrix for each cell type identified by CELESTA (rows) versus Schurch et al. (column) for 70 samples. White to red color indicates values from low to high. (b) Nuclei staining for sample core 032. (c) Cytokeratin staining for sample core 032. (d) Tumor cells identified by Schurch et al. (yellow crosses) overlaid on cytokeratin staining for sample core 032. (e) Tumor cells identified by CELESTA overlaid on cytokeratin staining for sample core 032. (f) Average canonical cell type marker expressions across all the 70 samples on cells identified to be tumor cells by (i) both CELESTA and Schurch et al. (black), (ii) only CELESTA (orange), and (iii) only Schurch et al. (blue). (g) Similar to (f) but with error bars indicating 95% confidence interval based on sampling the same number of cells from each category across n = 70 samples and center values indicate mean values.
Extended Data Fig. 3 |
Extended Data Fig. 3 |. Testing leave-one-out marker and cell type resolution strategy and sensitivity analysis of user-defined parameters (hyperparameters) in CELESTA using the Schurch et al. dataset.
(a) Assigned cell type proportions for testing of different cell type signature matrices with each time leaving one cell type marker and corresponding cell type out. (b) Comparison of CELESTA’s performance with (yellow) and without (purple) cell type resolution strategy. (c) Average numbers of neighboring cells as a function of the bandwidth parameter across n = 70 samples. Error bar indicates standard deviation, and center value indicates mean values. (d) F1 score as a function of the number of nearest neighbors. Left panel: major cell populations. Right panel: cell types with smaller populations. (e) Effect of different values for the threshold of high marker probability expression. Left panel: Number of cells assigned to unknown cell types as a function of the threshold for high marker probability expression. Middle panel: F1 scores as a function of the threshold for high marker probability expression, for major cell types. Right panel: F1 scores as a function of the threshold for high marker probability expression, for cell types with smaller populations.
Extended Data Fig. 4 |
Extended Data Fig. 4 |. Comparison of expression probabilities versus original staining across a representative sample.
Expression probability for a given marker for each cell CELESTA (left) compared to marker staining on the original image (right). For the CELESTA result, the marker expression probability is shown at the XY coordinates of the cell, where the XY coordinates represents the cell’s center; marker expression probabilities are color-coded for values over 0.5 in light blue to over 0.9 in dark blue. Markers illustrated are: (a) aSMA, a mesenchymal marker, (b) cytokeratin, a tumor marker and (c) CD31, an endothelial marker.
Extended Data Fig. 5 |
Extended Data Fig. 5 |. Analysis of two different clustering-based methods (namely, flowMeans and FlowSoM) used to assign cell types on the Schurch et al. dataset.
(a) Heatmaps of cluster marker expressions on different numbers of clusters (n = 20, 30, 50) with two independent annotators (Anno1 and Anno2) to assign cluster cell types based on manual assessment of cluster protein marker expressions; light green indicates matched annotations and dark green indicates mismatched annotations. (b) Percentage of matched cluster annotations between the two annotators as a function of the number of clusters, for two different clustering methods. (c) Number of cell types identified by the two annotators as a function of the number of clusters, for the two different clustering methods. (d) The percentage of cells assigned to unknown cell types with CELESTA and the two different clustering methods, as a function of the number of clusters and the annotator. (e) F1 scores per cell type, comparing CELESTA and cell type assignments from the two annotators using the two different clustering methods, where annotations from Schurch et al. are used as ground truth. Abbreviations: Anno1 for Annotator 1; Anno2 for Annotator 2.
Extended Data Fig. 6 |
Extended Data Fig. 6 |. Visual assessment of CELESTA’s performance for a representative HNSCC sample.
(a)–(f) Identified cells are shown as yellow crosses using the x and y coordinates overlaid on canonical marker staining (white) CODEX images. For each cell type, nuclei staining and three example markers (positive and negative) important for the cell type are shown. Cell types shown (a)–(f): malignant cells, endothelial cells, fibroblast cells, B cells, NK cells, plasmacytoid dendritic cells.
Extended Data Fig. 7 |
Extended Data Fig. 7 |. Additional visual assessment of CELESTA’s performance for a representative HNSCC sample.
(a)–(f) Identified cells are shown as yellow crosses using the x and y coordinates overlaid on canonical marker staining (white) CODEX images. For each cell type, nuclei staining and three example markers (positive and negative) important for the cell type are shown. Cell types shown (a)–(f): T cells, conventional dendritic cells, neutrophils, CD8 + T cells, CD4 + T cells, Treg cells.
Extended Data Fig. 8 |
Extended Data Fig. 8 |. Gating strategies on the head and neck squamous cell carcinoma (HNSCC) samples.
Gating strategies used to identify key cell types relevant to the HNSCC study including malignant cells, endothelial cells and subtypes of T cells.
Extended Data Fig. 9 |
Extended Data Fig. 9 |. Additional scRNA-seq analysis of primary HNSCC samples and scRNA-seq analysis using public domain data from Puram et al. (2017).
(a) UMAP plot of identified cell clusters with node status on the study HNSCC cohort. (b)–(c) UMAP plots highlighting expression of FOXP3, IL2RA, CXCR3, CD4 and CD8A. (d) CXCR3 expression in different T cell clusters showing that CXCR3 is differentially expressed in N0 (n = 2) versus N + (n = 2) samples only in the Treg cells. (e) Violin plot of STAT1 expression in the Treg cluster between N + (n = 2) and N0 (n = 2) samples. STAT1 is a CXCR3 inducer. (f) Violin plot of CXCL9 and CXCL11 in the malignant cell cluster between N + (n = 2) and N0 (n = 2) samples. CXCL9 and CXCL11 are both ligands of CXCR3, but they are not differentially expressed in our data. (g) Heatmap shows expressions of CD274 (PD-L1), MUC1, EMT markers (CDH1 and VIM) and stemness markers (CD44 and CD24). (h) UMAP of identified cell clusters using the Puram et al. dataset. (i) UMAP of identified cell type clusters with node status color-coded. (j) UMAP plots of CD4, CD8A, and FOXP3. (k) UMAP plot of CXCR3. (l) Violin plots of CXCR3 in the T cell clusters between N + (n = 12) and N0 (n = 6) samples. (m) Violin plot of CXCL10 in malignant cell cluster 0 between N + (n = 12) and N0 (n = 6) samples. Differentially expressed genes were identified using SAMR and false discovery rate was used to adjust p-values. Center line of box plot defines data median, top value indicates largest value within 1.5 times interquartile range above 75th percentile, bottom value indicates smallest value within 1.5 times interquartile range below 25th percentile, and upper and lower bounds of the box plot indicate 75th and 25th percentile respectively. *: adjusted p-value < 0.05, **: adjusted p-value < 0.01, ***: adjusted p-value < 0.005, ****: adjusted p-value < 0.001.
Extended Data Fig. 10 |
Extended Data Fig. 10 |. Gating strategies used for mouse model studies.
Gating strategies used to study CXCL10–CXCR3 crosstalk between malignant and Treg cells in the functional studies.
Fig. 1 |
Fig. 1 |. Image analysis pipeline with CELESTA.
a, Typical analysis pipeline for multiplexed in situ image data. b, Schematic diagram illustrating the iterative process in CELESTA’s cell type assignment. c, In CELESTA’s cell type assignment, the cell types are assigned to an image tile in which each dot represents a single cell and is positioned on the cell’s centroid.
Fig. 2 |
Fig. 2 |. overview of CELESTA.
a, CELESTA flowchart. b, CELESTA’s inputs and preprocessing steps. c, Illustration of CELESTA’s marker-scoring function. d, Illustration of CELESTA’s spatial-scoring function, using spatial neighborhood information for each non-anchor cell i. The cell type information from the spatially nearest neighboring cells of cell i is derived using the energy function of the Potts model. e, Each non-anchor cell Ci is associated with an unknown state Si, which is the cell type to be inferred. Cells are represented as nodes in an undirected graph with edges connecting N nearest spatial neighbors. The joint distribution of S is assumed to satisfy a discrete Markov random field. f, Illustration of the cell type resolution strategy used by CELESTA, based on the HNSCC imaging panel markers (in parentheses). cDC, conventional dendritic cell; CK, cytokeratin; MRF, Markov random field; NK, natural killer; pDC, plasmacytoid dendritic cell. Beta used in the flowchart (a) is a vector of model parameters.
Fig. 3 |
Fig. 3 |. CELESTA applied to a published CodEX dataset generated from a TMA of colorectal cancer primary samples (Schürch et al.6).
a, Representative TMA core with seven-channel overlay CODEX image (left), image using CELESTA-assigned cell types (middle) and image using annotated cell types from Schürch et al. (right). Scale bar, 50 μm. b, Cell type composition from CELESTA-assigned cell types versus annotations from Schürch et al., across the 70 cores of the entire TMA. c, Correlations between the number of cells identified, per TMA core across 70 cores, between the CELESTA and Schürch et al. annotations, for each cell type. The red line indicates a perfect correlation (slope = 1) and the blue line is the linear fit between the CELESTA-identified cell types and the Schürch et al. annotations. R represents the Pearson correlation coefficient. d, Precision score, F1 score and accuracy (Rand index) score for the major cell types identified by CELESTA using the Schürch et al. annotations as the ground truth. Error bars are calculated using s.d. across all of the cores (n = 70) as independent samples; the center of the error bars indicates the mean. A cell type is defined as rare if it has, on average, fewer than 100 cells per core. e,f, CELESTA cell type assignments for a cluster that Schürch et al. annotated as a mixture of vasculature or immune cells (e) and as a mixture of tumor or immune cells (f). CELESTA cell type compositions are shown in the left panels and the average canonical marker expressions for each cell type in the cluster are shown in the right panels. aSMA, alpha-smooth muscle actin.
Fig. 4 |
Fig. 4 |. CELESTA applied to CodEX data generated from fresh-frozen HNSCC primary tumor samples.
a,b, CODEX image overlay (left) and CELESTA (right) for a primary tumor HNSCC sample associated with lymph node metastasis (N+) (a) and not associated with lymph node metastasis (N0) (b). Scale bars: main image and Hoechst stain, 200 μm; inset, 100 μm. c, Cell type compositions from scRNA-seq data (left) and CELESTA-inferred cell types on CODEX data (middle), by HNSCC patient sample. Paired scRNA-seq and CODEX data were generated on proximal tissue sections from four patient samples. The graph on the right shows the correlation (Pearson correlation test) between CELESTA-inferred cell compositions and scRNA-seq cell compositions on the same four samples. d, Adjusted Rand index (ARI) to assess the performance of CELESTA against manual gating for each HNSCC sample. Error bars indicate the s.d. calculated based on 50 runs of random sampling, and the center of the error bars indicates the mean. e, Correlation (Pearson correlation test) between CELESTA-inferred cell compositions and manual gating compositions. f, Cell type precision score, F1 score and accuracy score (Rand index), across six independent samples, for six cell types. Error bars are calculated using s.d., and the center of the error bars indicates the mean. CK, cytokeratin; NK, natural killer.
Fig. 5 |
Fig. 5 |. Spatial pairwise cell type co-localization analysis based on CELESTA-identified cell types in the HNSCC study cohort.
a, Schematic representation of two different pairwise cell type spatial patterns: low pairwise cell type co-localization (left) and high pairwise cell type co-localization (right). b, Differential pairwise cell type co-location quotients (CLQs) when comparing N+ (n = 4) versus N0 (n = 4) HNSCC samples. Volcano plot based on nominal P values from two-sided Student’s t-test. c, Graphical illustration of inferred spatial architectural differences of cell–cell co-localizations in N0 samples (top) versus N+ samples (bottom). Created with BioRender.com. d, Representative regions of an N0 sample (left) and N+ sample (right) shown as three-color overlay images. Circled region in the right panel highlights a region with high co-localization of malignant and Treg cells in the N+ sample. Scale bars, 50 μm (0.4 μm per pixel). e, Representative regions for an N0 sample (left) and N+ sample (right) shown as four-color overlay images. The arrows highlight the regions in the right panel with high co-localization of endothelial and T cells in the N+ sample. Scale bars, 50 μm (0.4 μm per pixel). f, Representative HNSCC TMA cores for N0 and N+ patients shown as overlay images with cytokeratin and FOXP3 staining. Each TMA core is approximately 1 mm in diameter. Scale bars, 0.25 mm. g, Density correlation analysis shows that cytokeratin and Foxp3 expression have a higher density correlation in N+ patients (n = 44) than in N0 patients (n = 32) in an independent TMA cohort of HNSCC primary samples (P = 0.011, two-sided Student’s t-test). The center line of the box plot represents the median, the whiskers represent 1.5-fold the interquartile range, and the upper and lower ends of the box plot indicate the 75th and 25th percentiles, respectively. *P < 0.05.
Fig. 6 |
Fig. 6 |. scRNA-seq analysis guided by spatial biology reveals cell–cell interactions unique to primary HNSCC associated with lymph node metastasis.
a, UMAP (Uniform Manifold Approximation and Projection; an algorithm for dimension reduction) of identified cell type clusters using HNSCC scRNA-seq data. b, UMAP of malignant cells (cluster 11) by node status (left) and CXCL10 expression (right). c,d, Violin plots showing the differential expression of CXCL10 and CXCR3 in malignant and Treg cell clusters (c) and CCL20 in an endothelial cell cluster and CCR6 in a CD4+ T cell cluster (d) between N+ (n = 2) and N0 (n = 2) samples. Differentially expressed genes were identified using SAMR (Significance Analysis of Microarrays in R) and the false discovery rate was used to adjust the P values. Violin plots show density distributions of the data. Center line of the box defines median. The white box in the center of the violin defines the interquartile range. The black line stretched above from the box defines 1.5 times interquartile range above the 75th percentile, and the black line stretched below from the box defines 1.5 times interquartile range below the 25th percentile. e, Graphical illustration showing the cell–cell crosstalk with identified chemokine ligand–receptor pairs mediating the cellular spatial co-localization in N+ samples. Created with BioRender. com. f, CXCL10 expression is significantly higher (two-sided non-parametric Wilcoxon test) in the sixth generation of a lymph node tumor cell line (LN6) in a mouse model (n = 5) than in the parental (n = 3) tumor cell lines (P = 0.036). TPM, Transcripts Per Kilobase Million. g, Transwell experiment showing that LN6 tumor cells attract more CXCR3+ Tregs through the membrane than parental tumor cell lines (paired t-test right-tailed, P = 0.05). Tregs were plated in the upper chambers; the bottom chambers were plated with either the parental cells (control group, n = 3) or LN6 cells (study group, n = 3). h, Schematic diagram of the in vivo experiments. Created with BioRender.com. i, LN6 (n = 4) tumors recruit more Tregs than parental (n = 4) tumors (paired t-test right-tailed, P = 0.034). j, AMG487 treatment significantly reduces the number of Tregs recruited into the LN6 tumors (two-sided non-parametric Wilcoxon test, P = 0.029). Untreated samples, n = 8, and treated samples, n = 7. The center line of the box plot defines the median, the top whisker indicates the largest value within 1.5-fold the interquartile range from the 75th percentile, the bottom whisker indicates the smallest value within 1.5-fold the interquartile range below the 25th percentile, and the upper and lower bounds of the box indicate the 75th and 25th percentiles, respectively. *adjusted P < 0.05, **adjusted P < 0.01, ***adjusted P < 0.005, ****adjusted P < 0.001.

References

    1. Stack EC, Wang C, Roman KA & Hoyt CC Multiplexed immunohistochemistry, imaging, and quantitation: a review, with an assessment of tyramide signal amplification, multispectral imaging and multiplex analysis. Methods 70, 46–58 (2014). - PubMed
    1. Angelo M et al. Multiplexed ion beam imaging (MIBI) of human breast tumors. Nat. Med 20, 436–442 (2014). - PMC - PubMed
    1. Wang YJ et al. Multiplexed in situ imaging mass cytometry analysis of the human endocrine pancreas and immune system in type 1 diabetes. Cell Metab. 29, 769–783 (2019). - PMC - PubMed
    1. Ptacek J et al. Multiplexed ion beam imaging (MIBI) for characterization of the tumor microenvironment across tumor types. Lab. Invest 100, 1111–1123 (2020). - PubMed
    1. Parra ER, Francisco-Cruz A & Wistuba II State-of-the-art of profiling immune contexture in the era of multiplexed staining and digital analysis to study paraffin tumor tissues. Cancers (Basel) 11, 247 (2019). - PMC - PubMed

Publication types