. 2022 Sep;54(9):1293-1304.
doi: 10.1038/s41588-022-01072-5. Epub 2022 Jun 2.

Genetic correlates of phenotypic heterogeneity in autism

Collaborators, Affiliations

Genetic correlates of phenotypic heterogeneity in autism

Varun Warrier et al. Nat Genet. 2022 Sep.

Abstract

The substantial phenotypic heterogeneity in autism limits our understanding of its genetic etiology. To address this gap, here we investigated genetic differences between autistic individuals (nmax = 12,893) based on core and associated features of autism, co-occurring developmental disabilities and sex. We conducted a comprehensive factor analysis of core autism features in autistic individuals and identified six factors. Common genetic variants were associated with the core factors, but de novo variants were not. We found that higher autism polygenic scores (PGS) were associated with lower likelihood of co-occurring developmental disabilities in autistic individuals. Furthermore, in autistic individuals without co-occurring intellectual disability (ID), autism PGS are overinherited by autistic females compared to males. Finally, we observed higher SNP heritability for autistic males and for autistic individuals without ID. Deeper phenotypic characterization will be critical in determining how the complex underlying genetics shape cognition, behavior and co-occurring conditions in autism.


Conflict of interest statement

M.E.H. is a cofounder of and consultant to and holds shares in Congenica Ltd., a genetics diagnostics company.

Figures
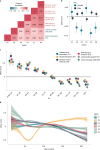
Fig. 1
Fig. 1. Factor analyses of the core autism features.
a, Pearson’s correlation coefficient between the six factors. Factors are ordered based on hierarchical clustering, demonstrating higher correlations among social (teal labels) and non-social (red labels) factors than between them. b, Mean scores and 95% confidence intervals for the six factor scores in males (n = 18,761) and females (n = 5,050). c, Mean scores and 95% confidence intervals for the six factor scores in ten full-scale IQ bins (n = 11,371). d, Smoothed Loess curve for mean factor scores for the six factors across age. The six factors are (1) insistence of sameness (F1), (2) social interaction (F2), (3) sensory–motor behavior (F3), (4) self-injurious behavior (F4), (5) idiosyncratic repetitive speech and behavior (F5) and (6) communication skills (F6). F2 primarily consists of items related to social interaction at the age of 4–5 years (past 12 months if younger than 4 years); hence, the trajectory likely reflects recall bias in participants. Shaded regions indicate 95% confidence intervals of the Loess curves.
Fig. 2
Fig. 2. Association of PGS and high-impact de novo variants with core and associated autism features.
Results from linear regression analyses testing the associations between the core and associated autism features and PGS for autism, ADHD, schizophrenia, educational attainment and intelligence, and with high-impact de novo variants (n = 2,421–12,893). For all association plots, standardized regression coefficients from linear regressions (central point) and 95% confidence intervals are provided. Yellow indicates significant association after Benjamini–Yekutieli correction for multiple comparisons (corrected P < 0.05). Red text indicates associated features, where higher values correspond to greater ability. Phenotypes are Autism Diagnostic Observation Schedule social affect (ADOS SA) and restricted and repetitive behavior (ADOS RRB); Autism Diagnostic Interview-Revised verbal communication (ADI VC), social interaction (ADI SOC) and restricted and repetitive behavior (ADI RRB); insistence of sameness factor (F1); social interaction factor (F2); sensory–motor behavior factor (F3); self-injurious behavior factor (F4); idiosyncratic repetitive speech and behavior factor (F5); communication skills factor (F6); adaptive behavior assessed by the Vineland Adaptive Behavior Scales (VABS); motor coordination assessed by the Development Coordination Disorder Questionnaire (DCDQ); score on the Social Responsiveness Scale (SRS); full-scale IQ (FSIQ); nonverbal IQ (NVIQ); and verbal IQ (VIQ).
Fig. 3
Fig. 3. Association between genotype and full-scale IQ and impact of full-scale IQ on genotype–phenotype associations.
a, Line plots for full-scale IQ scores as a function of intelligence PGS and counts of high-impact de novo variants in the SPARK and SSC cohorts, plotted with n = 3,197 autistic individuals. Only binned full-scale IQ scores were available in the SPARK cohort, and, subsequently, full-scale IQ was binned in the SSC cohort and treated as a continuous variable (Methods). Shaded regions indicate 95% confidence intervals of fitted values of the regression line. b, Point estimates of linear regression coefficients (central point) for the association between PGS and high-impact de novo variants and core and associated autism features without (y axis) and after (x axis) accounting for full-scale IQ scores (n = 2,232–12,893 autistic individuals). Confidence intervals (95%) for both regressions are provided. Only significant genotype–phenotype estimates are plotted. Point estimates closer to the diagonal line indicate no change in β coefficient (linear regression) after controlling for full-scale IQ.
Fig. 4
Fig. 4. Additivity and impact of high-impact de novo variants on core autism features.
a, β coefficients (βde novo) and 95% confidence intervals for carrying a high-impact de novo variant per decile of autism PGS in autistic individuals after accounting for sex, age, ten genetic principal components and PGS for educational attainment, intelligence and schizophrenia, calculated using logistic regression (n = 5,575). b, Overtransmission (central point) and 95% confidence errors of PGS for autism in all probands, siblings, carriers of high-impact de novo variants and non-carriers. P values are provided above for the overtransmission. We also compare differences in overtransmission between carriers and non-carriers and carriers and siblings and provide the P values for this from two-tailed Z-tests. c, Phenotypic correlation between the core features and associated autism features. d, Statistical power for identifying a significant association between the number of high-impact de novo variants and core features based on the correlation with the three associated features, which is provided in c. The highest correlation between a core feature and an associated feature is indicated on the power graph. Shaded regions indicate 95% confidence intervals of the power curve.
Fig. 5
Fig. 5. Associations between high-impact de novo variants and autism PGS and co-occurring developmental disabilities and delays.
a, β coefficients for the association of high-impact de novo variants (logistic regression) and autism PGS (linear regression) with case–control status (using sibling controls) by counts of co-occurring developmental disabilities. Error bars are 95% confidence intervals. b, Distribution and mean age of first words (top) and age of walking (bottom) in siblings, non-carriers and carriers of high-impact variants in either DD or non-DD genes. P values were calculated using Wilcoxon rank-sum tests (two-sided). c, Likelihood of autism, measured using relative risk, and (any number of) developmental disabilities with 95% confidence intervals for different sets of probands with high-impact de novo variants. Sibling controls were used. All relative risks were statistically significant after correcting for multiple comparisons. All data for a,b are from the SPARK cohort, and sample sizes are provided in Supplementary Table 13. Sample sizes for c are provided in Supplementary Table 14b.
Fig. 6
Fig. 6. Sex differences in high-impact de novo and common variants.
a, Likelihood for autism, measured using relative risk (central point) and 95% confidence intervals for females compared to males for being a carrier, a DD gene carrier and a non-DD gene carrier. Sample sizes are provided in Supplementary Table 15. b, Point estimates and 95% confidence intervals showing sex-stratified autism PGS for subgroups of autistic individuals. Left, midparental estimates. Right, overtransmitted PGS scores. All scores are standardized to midparental means. P values are provided from two-tailed Z-tests. Carriers, carriers of high-impact de novo variants; ID, autistic individuals with co-occurring ID (full-scale IQ < 70). Sample sizes are provided in Supplementary Table 17.
Fig. 7
Fig. 7. SNP heritability estimates.
a, SNP heritability (central point) and 95% confidence intervals for various subgroups (males and females combined) of autistic individuals (maximum of n = 4,481 autistic individuals and 4,481 population controls). Estimates from two methods (GCTA-GREML and PCGC) are shown. Empty shapes indicate that SNP heritability was not estimated due to low statistical power. b, SNP heritability (central point) and 95% confidence intervals for sex- and ID-stratified autism subgroups (maximum of n = 4,481 autistic individuals and 4,481 population controls). Empty shapes indicate that SNP heritability was not estimated due to low statistical power. c, SNP heritability (central point) by sex for varying levels of autism prevalence in the USA (males, n = 2,386 autistic individuals and 2,386 controls; females, n = 2,095 autistic individuals and 2,095 controls). Shaded regions, 95% confidence intervals. The six factors are (1) insistence of sameness (F1), (2) social interaction (F2), (3) sensory–motor behavior (F3), (4) self-injurious behavior (F4), (5) idiosyncratic repetitive speech and behavior (F5) and (6) communication skills (F6).

References

    1. Lai M-C, Lombardo MV, Baron-Cohen S. Autism. Lancet. 2013;383:896–910. doi: 10.1016/S0140-6736(13)61539-1. - DOI - PubMed
    1. American Psychiatric Association. Diagnostic and Statistical Manual of Mental Disorders 5th edn (American Psychiatric Association, 2013).
    1. Lord C, et al. Autism spectrum disorder. Nat. Rev. Dis. Primers. 2020;6:5. doi: 10.1038/s41572-019-0138-4. - DOI - PMC - PubMed
    1. Geschwind DH. Advances in autism. Annu. Rev. Med. 2009;60:367–380. doi: 10.1146/annurev.med.60.053107.121225. - DOI - PMC - PubMed
    1. Mandell DS, Novak MM, Zubritsky CD. Factors associated with age of diagnosis among children with autism spectrum disorders. Pediatrics. 2005;116:1480–1486. doi: 10.1542/peds.2005-0185. - DOI - PMC - PubMed

Publication types