

Photocycle of point defects in highly- and weakly-germanium doped silica revealed by transient absorption measurements with femtosecond tunable pump
- PMID: 35654982
- PMCID: PMC9163034
- DOI: 10.1038/s41598-022-13156-7
Photocycle of point defects in highly- and weakly-germanium doped silica revealed by transient absorption measurements with femtosecond tunable pump
Abstract
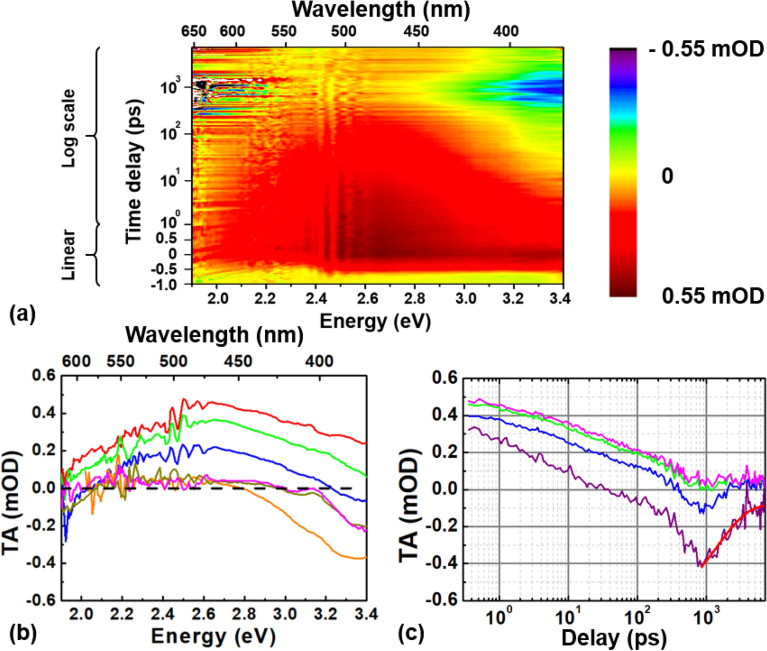
We report pump-probe transient absorption measurements addressing the photocycle of the Germanium lone pair center (GLPC) point defect with an unprecedented time resolution. The GLPC is a model point defect with a simple and well-understood electronic structure, highly relevant for several applications. Therefore, a full explanation of its photocycle is fundamental to understand the relaxation mechanisms of such molecular-like systems in solid state. The experiment, carried out exciting the sample resonantly with the ultraviolet (UV) GLPC absorption band peaked at 5.1 eV, gave us the possibility to follow the defect excitation-relaxation dynamics from the femto-picosecond to the nanosecond timescale in the UV-visible range. Moreover, the transient absorption signal was studied as a function of the excitation photon energy and comparative experiments were conducted on highly- and weakly-germanium doped silica glasses. The results offer a comprehensive picture of the relaxation dynamics of GLPC and allow observing the interplay between electronic transitions localized on the defect and those related to bandgap transitions, providing a clear evidence that the role of dopant high concentration is not negligible in the earliest dynamics.
© 2022. The Author(s).
Conflict of interest statement
The authors declare no competing interests.
Figures


References
-
- Pacchioni G, Skuja L, Griscom DL. Defect in SiO2 and Related Dielectrics: Science and Technology. Springer; 2000.
-
- Devine RAB. Physics and Technology of Amorphous SiO2. Springer; 1988.
-
- Girard S, et al. Overview of radiation induced point defects in silica based optical fibers. Rev. Phys. 2019;4:100032. doi: 10.1016/j.revip.2019.100032. - DOI
-
- Girard S, et al. Recent advances in radiation-hardened fiber-based technologies for space applications. J. Opt. 2018;20:093001. doi: 10.1088/2040-8986/aad271. - DOI
-
- Krohn DA, MacDougall TW, Mendez A. Fiber Optics Sensors: Fundamentals and Applications. SPIE; 2014.
Publication types
MeSH terms
Substances
LinkOut - more resources
Full Text Sources
