. 2022 May;4(5):524-533.
doi: 10.1038/s42255-022-00565-1. Epub 2022 Jun 2.

Mesaconate is synthesized from itaconate and exerts immunomodulatory effects in macrophages

Affiliations

Mesaconate is synthesized from itaconate and exerts immunomodulatory effects in macrophages

Wei He et al. Nat Metab. 2022 May.

Abstract

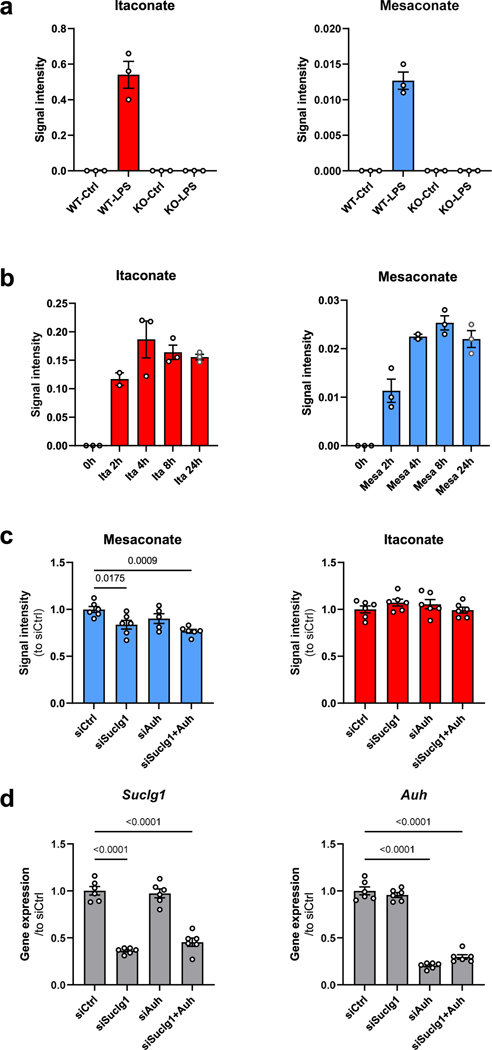
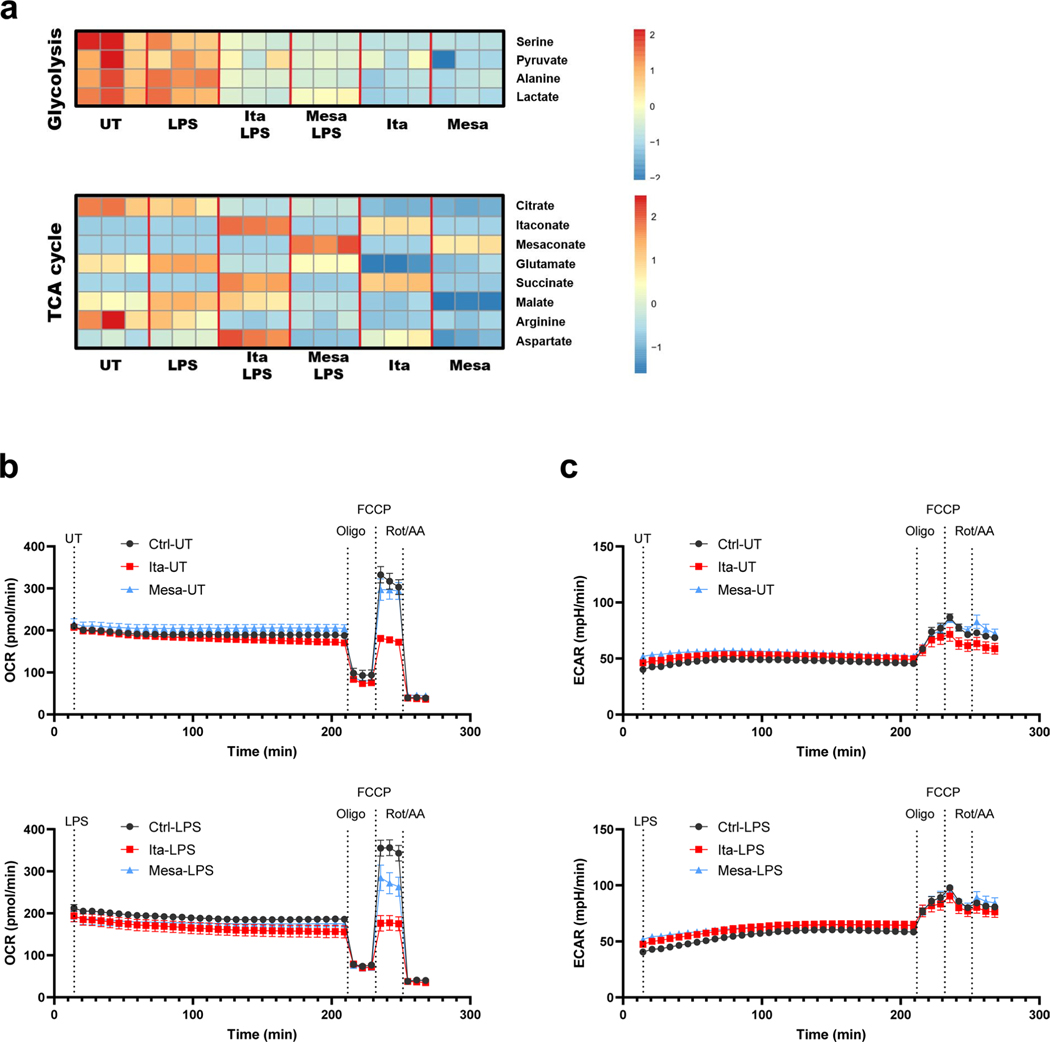
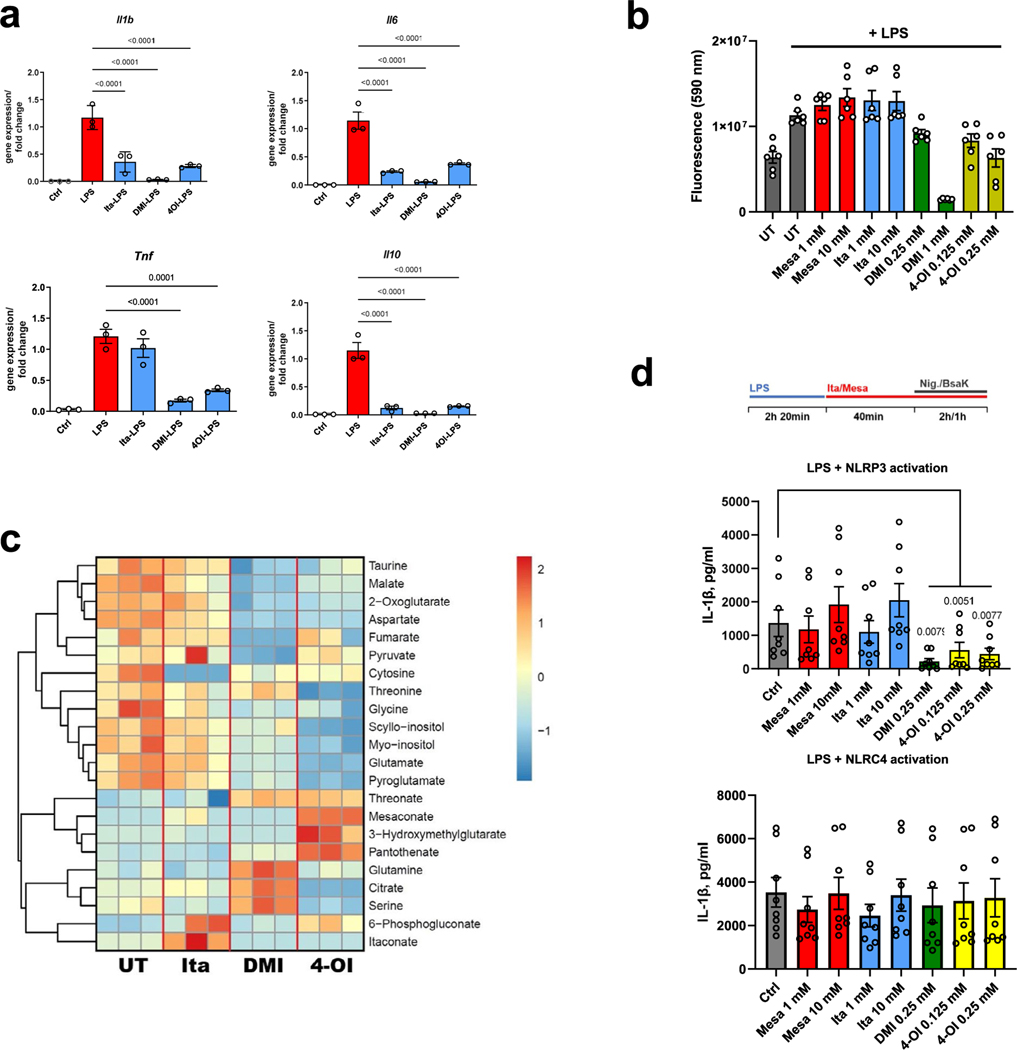
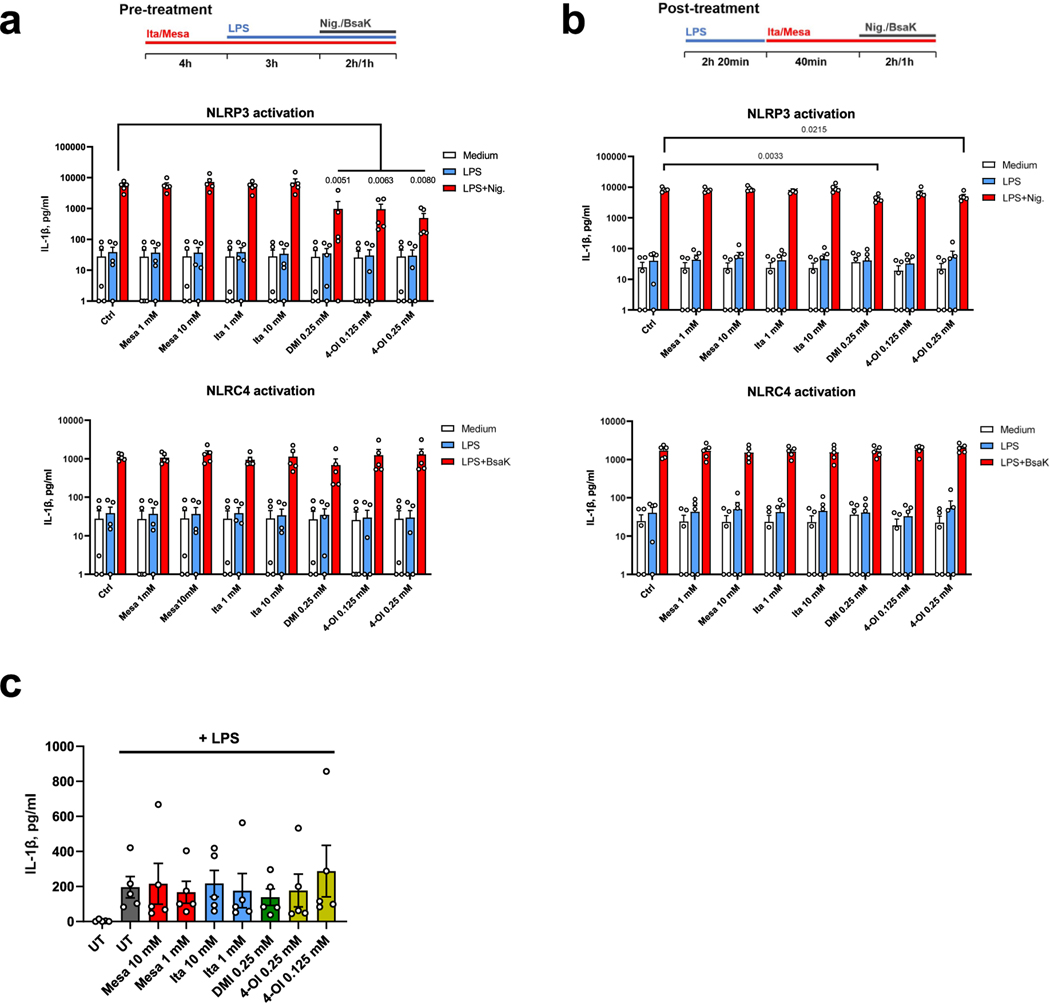
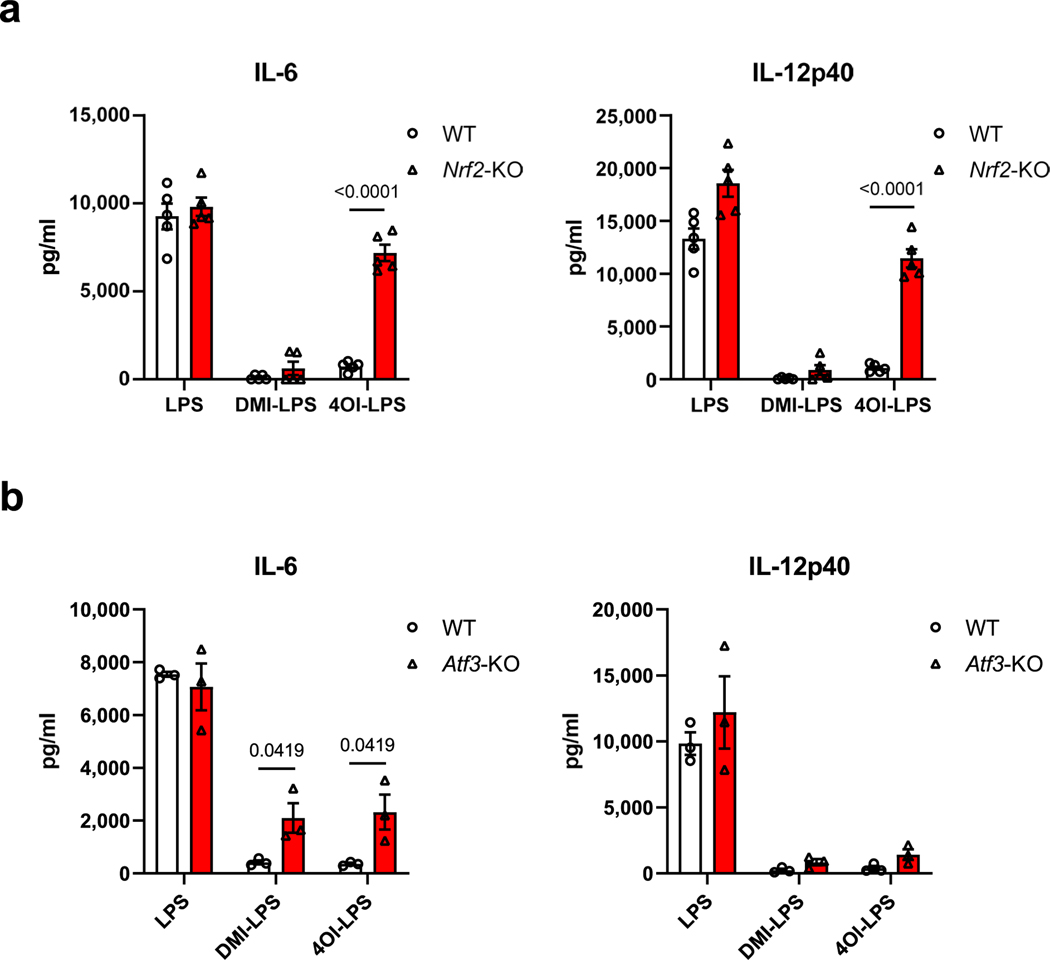
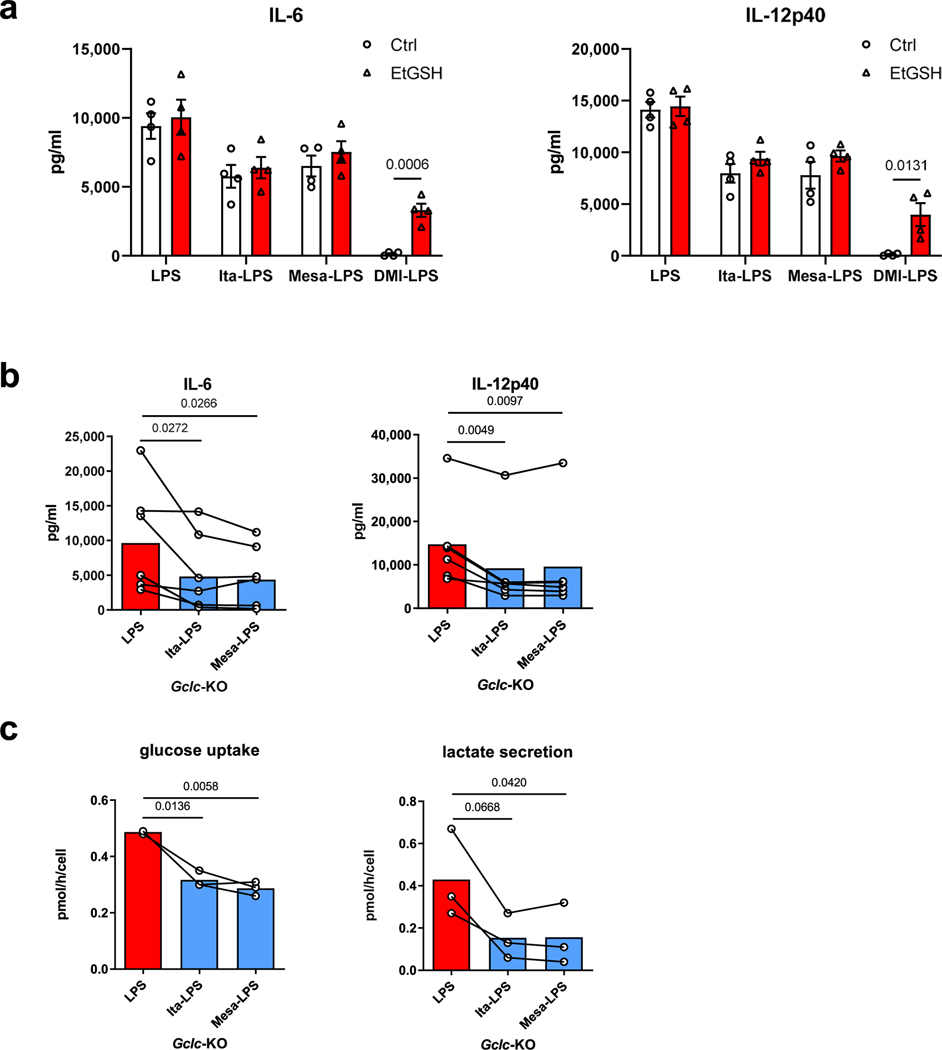
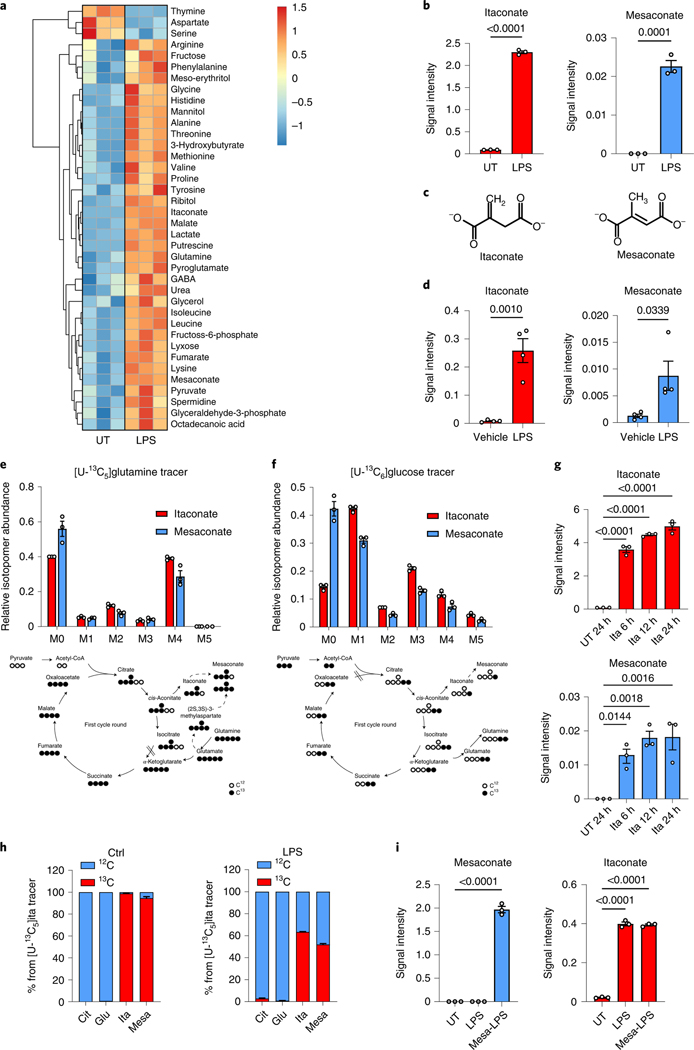
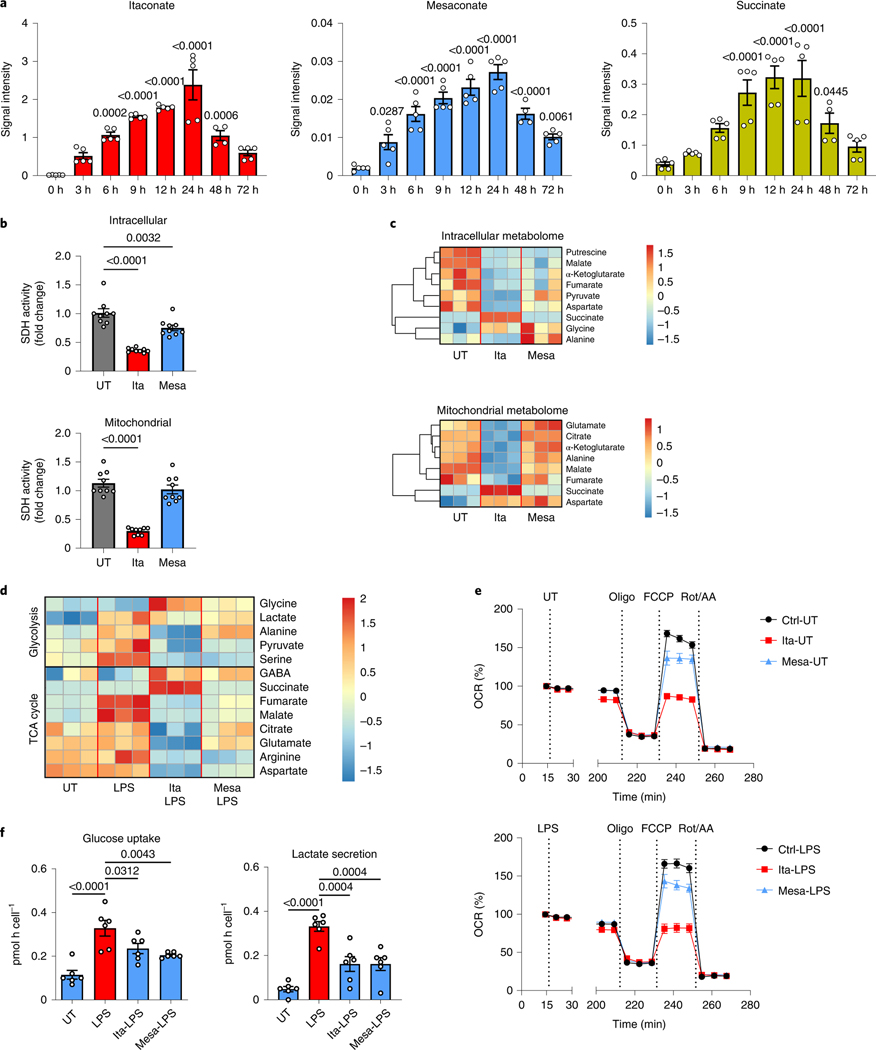
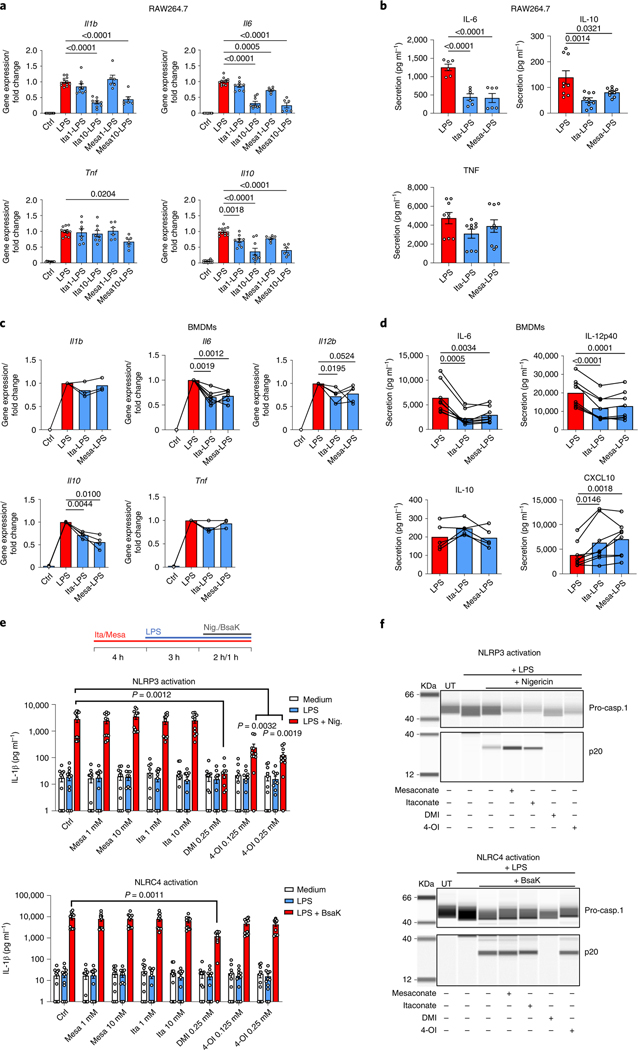
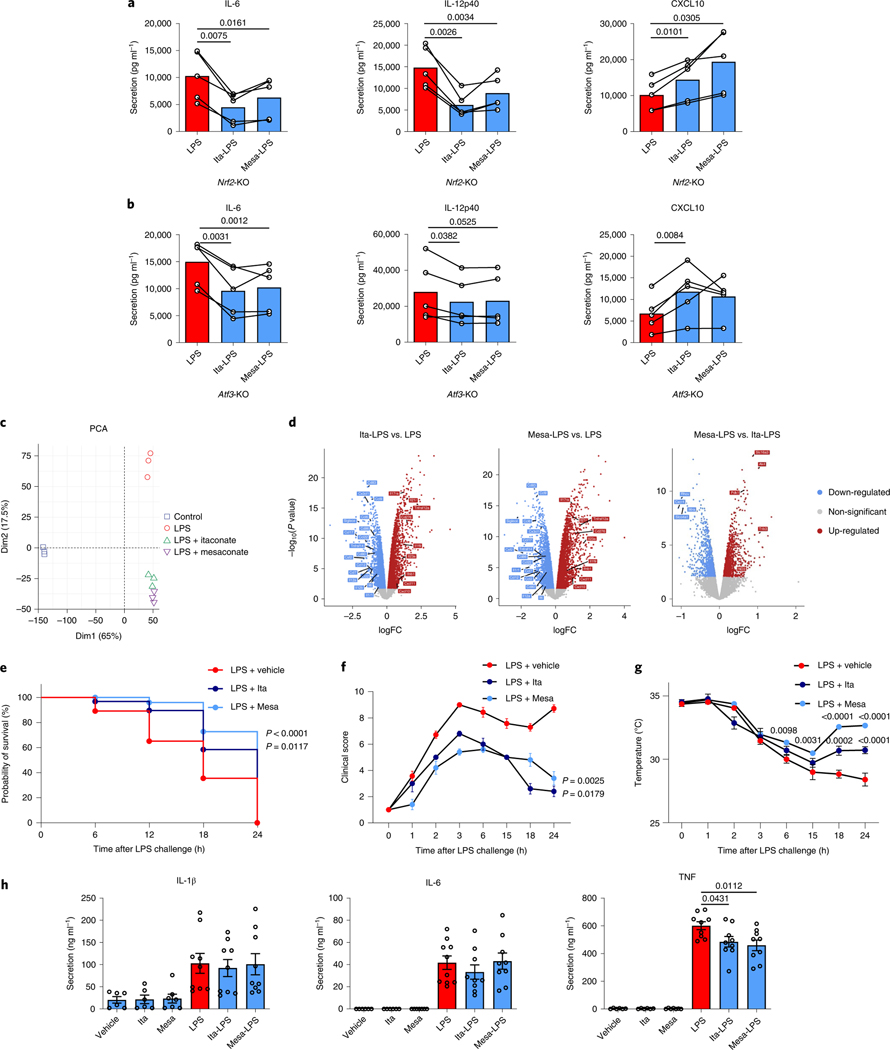
Since its discovery in inflammatory macrophages, itaconate has attracted much attention due to its antimicrobial and immunomodulatory activity1-3. However, instead of investigating itaconate itself, most studies used derivatized forms of itaconate and thus the role of non-derivatized itaconate needs to be scrutinized. Mesaconate, a metabolite structurally very close to itaconate, has never been implicated in mammalian cells. Here we show that mesaconate is synthesized in inflammatory macrophages from itaconate. We find that both, non-derivatized itaconate and mesaconate dampen the glycolytic activity to a similar extent, whereas only itaconate is able to repress tricarboxylic acid cycle activity and cellular respiration. In contrast to itaconate, mesaconate does not inhibit succinate dehydrogenase. Despite their distinct impact on metabolism, both metabolites exert similar immunomodulatory effects in pro-inflammatory macrophages, specifically a reduction of interleukin (IL)-6 and IL-12 secretion and an increase of CXCL10 production in a manner that is independent of NRF2 and ATF3. We show that a treatment with neither mesaconate nor itaconate impairs IL-1β secretion and inflammasome activation. In summary, our results identify mesaconate as an immunomodulatory metabolite in macrophages, which interferes to a lesser extent with cellular metabolism than itaconate.


Conflict of interest statement

Competing interests

The authors declare no competing interests.

Figures

Extended Data Fig. 1 |
Extended Data Fig. 1 |. Mesaconate is endogenously synthesized from itaconate and cellularly permeable in mouse macrophages.
a. Intracellular itaconate and mesaconate of BMDMs from wildtype (WT) or IRG1-deficient (KO) mice stimulated with or without LPS for 24 h. b. Intracellular itaconate and mesaconate of BMDMs incubated with exogenous itaconate or mesaconate for the indicated time points. c. Intracellular itaconate and mesaconate of RAW264.7 cells transfected with indicated siRNA, followed with LPS stimulation for 24 h. d. Silencing efficiency of indicated genes from experiments shown in (c). Data are presented as mean ± SEM: a,b. calculated from n = 3 mice from a representative experiment of 2 independent experiments; c,d. n = 6 biological replicates pooled from 2 independent experiments. P values were calculated by one-way ANOVA with Dunnet post-test and overlayed on respective comparisons.
Extended Data Fig. 2 |
Extended Data Fig. 2 |. Mesaconate and itaconate exhibit different metabolic impacts in macrophages.
a. Intracellular metabolite levels of glycolysis and TCA cycle in human monocyte-derived macrophages pre-treated with 10 mM itaconate or mesaconate for 4 h prior to LPS stimulation for 3 h. b,c. Unnormalized oxygen consumption rate (OCR) and extracellular acidification rate (ECAR) from the experiment shown in Fig. 2e. Data are presented as mean ± SEM, and figures are representative of 3 independent experiments.
Extended Data Fig. 3 |
Extended Data Fig. 3 |. Both non-derivatized itaconate and mesaconate are immunomodulatory in mouse macrophages.
a. Cytokine expression of RAW264.7 cells pre-treated with 10 mM itaconate, 0.25 mM DMI or 0.125 mM 4-OI for 4 h prior to LPS stimulation for 3 h. b. Viability of BMDMs pre-treated with indicated concentrations of mesaconate, itaconate, DMI and 4-OI for 4 h prior to LPS stimulation overnight. c. Non-targeted intracellular metabolome of RAW264.7 cells treated with 1 mM itaconate, DMI or 4-OI for 6 h. d. IL-1β in supernatants of BMDMs treated with indicated concentrations of mesaconate, itaconate, DMI or 4-OI, LPS stimulation as well as NLRP3 or NLRC4 inflammasome activation with nigericin or a mixture of BsaK and protective antigen, respectively, following a post-treatment protocol as indicated at top. Data are shown as: a,b,d. mean ± SEM calculated from (a) n = 3 biological replicates from one representative experiment, (b) n = 6 biological replicates from 3 mice, (d) n = 8 mice from 3 independent experiments; c. a representative heatmap showing z-scores of the data by row, from 2 independent experiments; P values were calculated by one-way ANOVA with Dunnet post-test (a) or paired t test (d, paired by each mouse) and overlayed on respective comparisons.
Extended Data Fig. 4 |
Extended Data Fig. 4 |. itaconate derivatives impairs iL-1β secretion in human macrophages.
a,b. IL-1β in supernatants of human monocyte-derived macrophages treated with mesaconate, itaconate, DMI or 4-OI of indicated concentrations, LPS stimulation as well as NLRP3 or NLRC4 inflammasome activation by nigericin or a mixture of BsaK and protective antigen, respectively, following the pre- (a) or post-treatment protocol (b) as shown at the top. c. IL-1β in supernatants of human whole blood pre-treated with mesaconate, itaconate, DMI or 4-OI of indicated concentrations for 4 h prior to LPS stimulation overnight. Data are shown as mean ± SEM calculated from n = 5 donors. P values were calculated by one-way ANOVA with Dunnet post-test and overlayed on respective comparisons.
Extended Data Fig. 5 |
Extended Data Fig. 5 |. Dependency of DMi and 4-Oi on NRF2 and ATF3 for their anti-inflammatory effects in mouse BMDMs.
Cytokine secretion of BMDMs from wildtype (WT) and Nrf2-KO (a) or Atf3-KO (b) mice pre-treated with 0.25 mM DMI or 0.125 mM 4-OI for 4 h prior to LPS stimulation for 21 h. Data are shown as mean ± SEM calculated from n = 5 (a) or 3 (b) mice. P values were calculated by multiple unpaired t-test and overlayed on respective comparisons.
Extended Data Fig. 6 |
Extended Data Fig. 6 |. Effects of itaconate and mesaconate are independent of GsH.
a. Cytokine secretion of BMDMs from wildtype mice pre-treated with 10 mM itaconate or mesaconate, or 0.25 mM DMI, in the presence or absence of 1 mM cellular permeable GSH (EtGSH) for 4 h prior to LPS stimulation for 21 h. b,c. Cytokine secretion (b), glucose uptake and lactate secretion (c) of Gclc-deficient (Gclc-KO) BMDMs pre-treated with 10 mM itaconate or mesaconate for 4 h prior to LPS stimulation for 21 h. Data are shown as: a. mean ± SEM calculated from n = 4 mice; b,c. mean with individual mouse data pooled from n = 6 (b) or 3 (c) mice, and conditions from individual mouse are connected with a line. P values were calculated by multiple unpaired t-test (a) or paired t-test (b,c, paired by each mouse) and overlayed on respective comparisons.
Fig. 1 |
Fig. 1 |. Mesaconate is endogenously synthesized from itaconate in macrophages.
a, Non-targeted intracellular metabolome of mouse macrophage RAW264.7 cells in the absence or presence of 10 ng ml−1 LPS for 24 h. b, Signal intensity of intracellular itaconate and mesaconate in RAW264.7 cells. c, Chemical structure of itaconate and mesaconate. d, Intracellular levels of both metabolites in peritoneal cells isolated from mice intraperitoneally injected with 1 mg per kg body weight of LPS for 24 h. e,f, Mass isotopomer distribution of itaconate and mesaconate in RAW264.7 cells incubated with [U-13C5]glutamine (e) or [U-13C6]glucose (f) tracer for 24 h. Atom transitions for TCA cycle metabolites and potential mesaconate biosynthesis are indicated below. g, Intracellular levels of itaconate and mesaconate in RAW264.7 cells treated with 10 mM exogenous itaconate at the indicated time points. h, Carbon contribution of supplemented [U-13C5]itaconate to intracellular itaconate and mesaconate and mass isotopomer distribution of both metabolites in RAW264.7 cells incubated with [U-13C5]itaconate tracer for 24 h in the absence or presence of LPS. i, Intracellular levels of itaconate and mesaconate in RAW264.7 cells pretreated with 10 mM exogenous mesaconate for 4 h before 3 h LPS stimulation. Data are presented as a representative heat map showing z-scores of the data by row, from three independent experiments (a), the mean ± s.e.m. calculated from (b and ei) n = 3 biological independent replicates from a representative experiment of two (eg and i) or three (b and h) independent experiments or (d) n = 4 mice. UT, untreated control. P values were calculated by one-way analysis of variance (ANOVA) with Dunnet’s post hoc test (g and i) or unpaired t-test (b and d) and overlayed on respective comparisons.
Fig. 2 |
Fig. 2 |. impact of mesaconate and itaconate on macrophage metabolism.
a, Intracellular levels of itaconate, mesaconate and succinate in RAW264.7 cells stimulated with 10 ng ml−1 LPS for the indicated periods. b,c, Intracellular and mitochondrial SDH activities (b) and metabolomes (c) of RAW264.7 cells incubated with 10 mM itaconate or mesaconate for 6 h. d, Intracellular metabolome of RAW264.7 cells pretreated with 10 mM itaconate or mesaconate for 4 h before 3 h LPS stimulation. e, Oxygen consumption rate (OCR) of RAW264.7 cells pretreated with 10 mM itaconate or mesaconate for 4 h before 3 h LPS stimulation, followed by a sequential addition of oligomycin (Oligo), FCCP and rotenone plus antimycin A (Rot/AA). All values were normalized to the measurement time point 1 (immediately before LPS injection) of each well. Unnormalized results are shown in Extended Data Fig. 2b,c. f, Glucose uptake and lactate secretion of mouse BMDMs pretreated with 10 mM itaconate or mesaconate for 4 h before 21 h LPS stimulation. Data are shown as the mean ± s.e.m. calculated from n = 5 biological replicates from two independent experiments (a; except n = 4 for 48 h), n = 9 biological replicates from three independent experiments (b) or n = 6 mice from five independent experiments (f); a representative heat map showing z-scores of the data by row, from three independent experiments (c and d); and the mean ± s.e.m. calculated from n = 10 biological replicates from a representative result of three independent experiments (e). P values were calculated by one-way ANOVA with Dunnet’s post hoc test and overlayed on respective comparisons.
Fig. 3 |
Fig. 3 |. Both non-derivatized itaconate and mesaconate are immunomodulatory in macrophages.
a,b, Cytokine expression (a) and secretion (b) of RAW264.7 cells pretreated with 10 mM itaconate or mesaconate for 4 h before 3 h (a) or 21 h (b) of LPS stimulation. c,d, Cytokine expression (c) and secretion (d) of BMDMs pretreated with 10 mM itaconate or mesaconate for 4 h before 3 h (c) or 21 h (d) LPS stimulation. e, IL-1β in supernatants of BMDMs treated with indicated concentrations of mesaconate, itaconate, DMI or 4-OI, LPS stimulation as well as NLRP3 or NLRC4 inflammasome activation with nigericin (10 μM) or a mixture of BsaK (100 ng ml−1) and protective antigen (1 μg ml−1), respectively, following a pretreatment protocol as indicated. f, Western blots of pro-caspase-1 and cleaved caspase-1 (p20) in supernatants of BMDMs treated as in e. Data are presented as: the mean ± s.e.m. calculated from n = 12 (Ctrl, LPS), 9 (Ita1/10) or 6 (Mesa1/10) biological replicates pooled from three independent experiments (a); the mean ± s.e.m. calculated from n = 6 (IL-6) or 9 (IL-10 and TNF) biological replicates pooled from two to three independent experiments (b); the mean with overlayed data of individual mice pooled from n = 3–8 mice (each data point represent a mouse) from at least two independent experiments, and conditions from individual mice are connected with a line (c and d); the mean ± s.e.m. calculated from n = 11 mice from four independent experiments (e); representative images are from three independent experiments (f). P values were calculated by one-way ANOVA with Dunnet’s post hoc test (a, b and e) or paired t-test (paired by each mouse; c and d) and overlayed on respective comparisons.
Fig. 4 |
Fig. 4 |. itaconate and mesaconate modulate cytokine production in NRF2- and ATF3-deficient macrophages, and protect mice from LPs-induced sepsis.
a,b, Cytokine secretion of Nrf2-knockout (KO) (a) and Atf3-KO (b) BMDMs pretreated with 10 mM itaconate or mesaconate for 4 h before LPS stimulation for 21 h. c,d, Transcriptomic analysis with PCA (c) and volcano plots (d) of RNA-seq data from wild-type BMDMs pretreated with 10 mM itaconate or mesaconate for 4 h before 10 ng ml−1 LPS stimulation for 3 h. eh, Itaconate and mesaconate protect from LPS-induced sepsis: survival curve (e), clinical score (f), body temperature (g) and plasma cytokines (h) in mice intraperitoneally injected with 250 mg per kg body weight itaconate or mesaconate for 2 h, followed by 30 mg (e) or 2.5 mg (fh) per kg body weight LPS for 24 h. Data are presented as: a,b, the mean with data of individual mice from n = 5 mice (each data point represents a mouse) from two (a) or three (b) independent experiments, and conditions from individual mice are connected with a line; the relative distribution of overall transcriptome of different groups (c); x axis for the log-fold change (logFC) between two groups, y axis for the P value of corresponding comparisons, and the colouring is generic for P < 0.05 (d); probability of survival calculated from n = 20 mice per group, a representative result from two independent experiments (e); the mean ± s.e.m. was calculated from n = 7 mice for LPS + vehicle, n = 5 mice for LPS + itaconate/mesaconate, representative from three independent experiments (f and g); the mean ± s.e.m. calculated from n = 6 mice for no-LPS conditions and n = 9 mice for LPS conditions, pooled from two independent experiments (h). P values were calculated by paired t-test (paired by each mouse; a and b), an exact test based on the dispersion generated by the quantile-adjusted conditional maximum likelihood (qCML) method (d), curve comparison with log-rank (Mantel–Cox) test (e), one-way ANOVA with Dunnet’s post hoc test (f for curve mean and h) or two-way ANOVA with Dunnet’s post hoc test (g) and overlayed on respective comparisons.

Comment in

References

    1. Michelucci A. et al. Immune-responsive gene 1 protein links metabolism to immunity by catalyzing itaconic acid production. Proc. Natl Acad. Sci. USA 110, 7820–7825 (2013). - PMC - PubMed
    1. Mills EL et al. Itaconate is an anti-inflammatory metabolite that activates Nrf2 via alkylation of KEAP1. Nature 556, 113–117 (2018). - PMC - PubMed
    1. Bambouskova M. et al. Electrophilic properties of itaconate and derivatives regulate the IκBζ–ATF3 inflammatory axis. Nature 556, 501–504 (2018). - PMC - PubMed
    1. Wynn TA, Chawla A. & Pollard JW Macrophage biology in development, homeostasis and disease. Nature 496, 445–455 (2013). - PMC - PubMed
    1. He W, Heinz A, Jahn D. & Hiller K. Complexity of macrophage metabolism in infection. Curr. Opin. Biotechnol 68, 231–239 (2021). - PubMed

Publication types

LinkOut - more resources