. 2022 May;4(5):534-546.
doi: 10.1038/s42255-022-00577-x. Epub 2022 Jun 2.

Citraconate inhibits ACOD1 (IRG1) catalysis, reduces interferon responses and oxidative stress, and modulates inflammation and cell metabolism

Affiliations

Citraconate inhibits ACOD1 (IRG1) catalysis, reduces interferon responses and oxidative stress, and modulates inflammation and cell metabolism

F Chen et al. Nat Metab. 2022 May.

Abstract

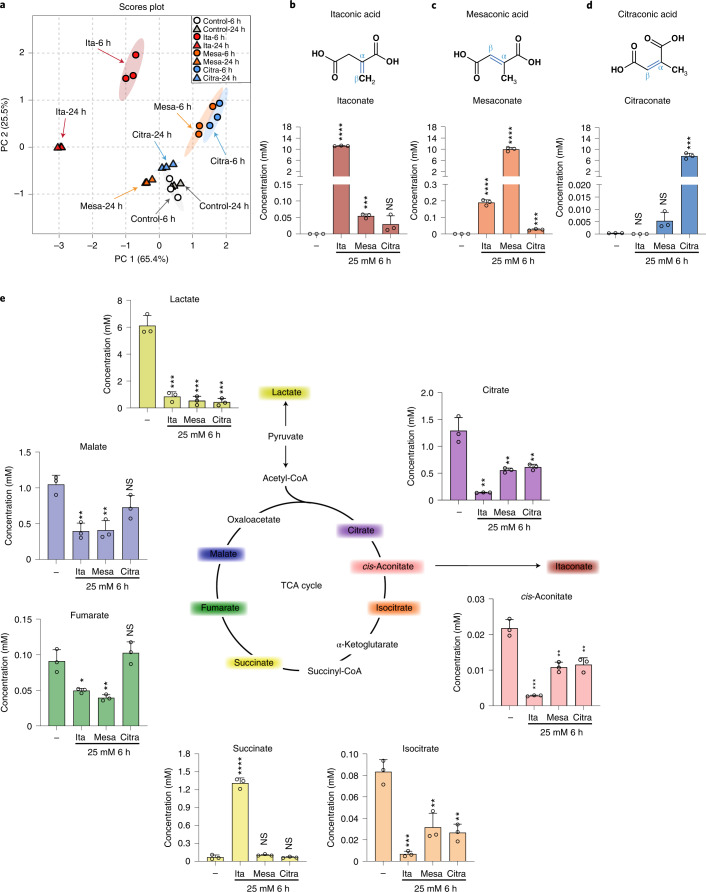
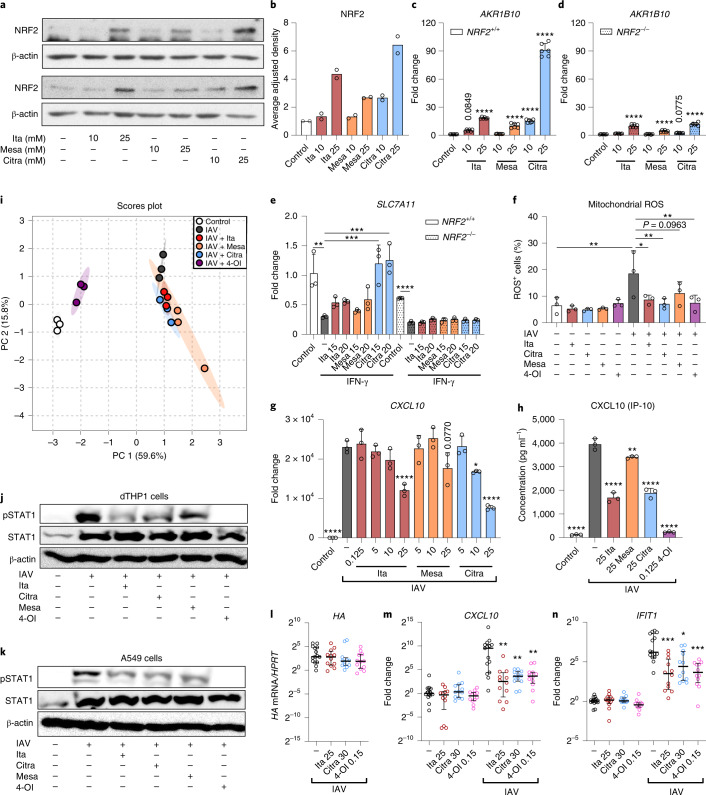
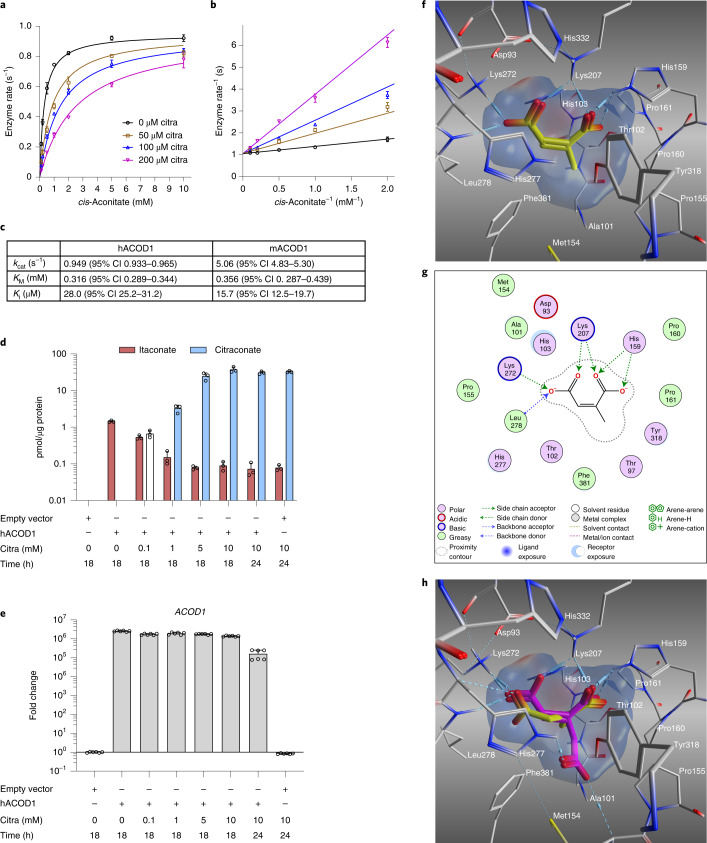
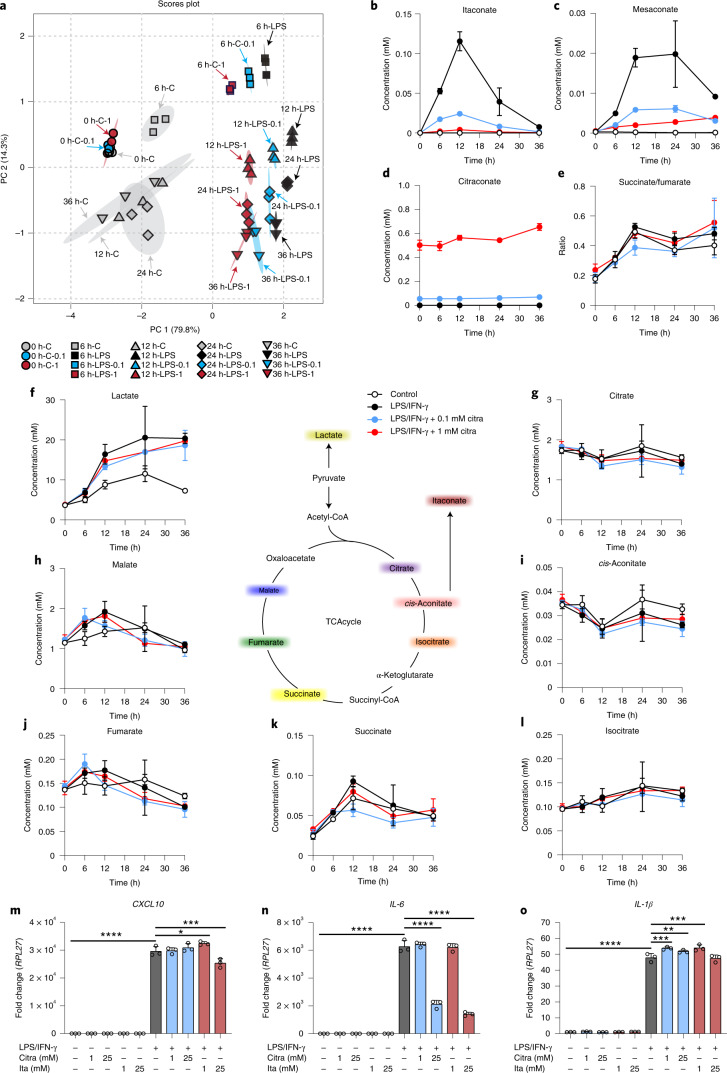
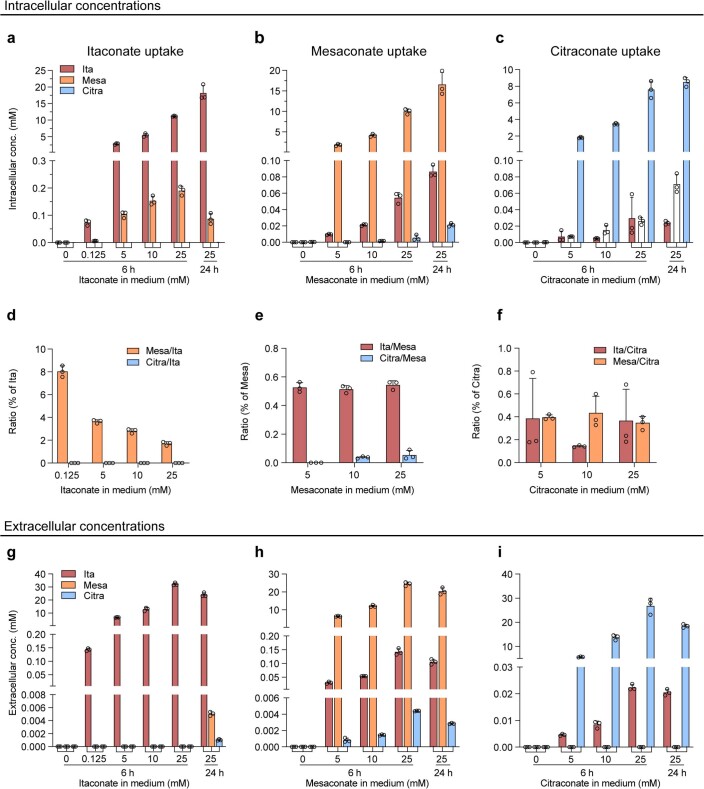
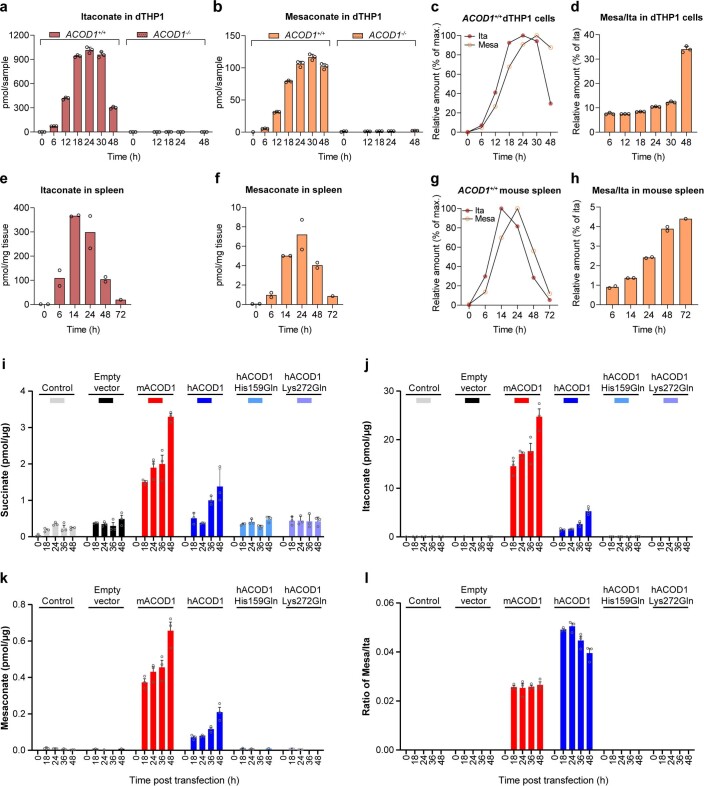
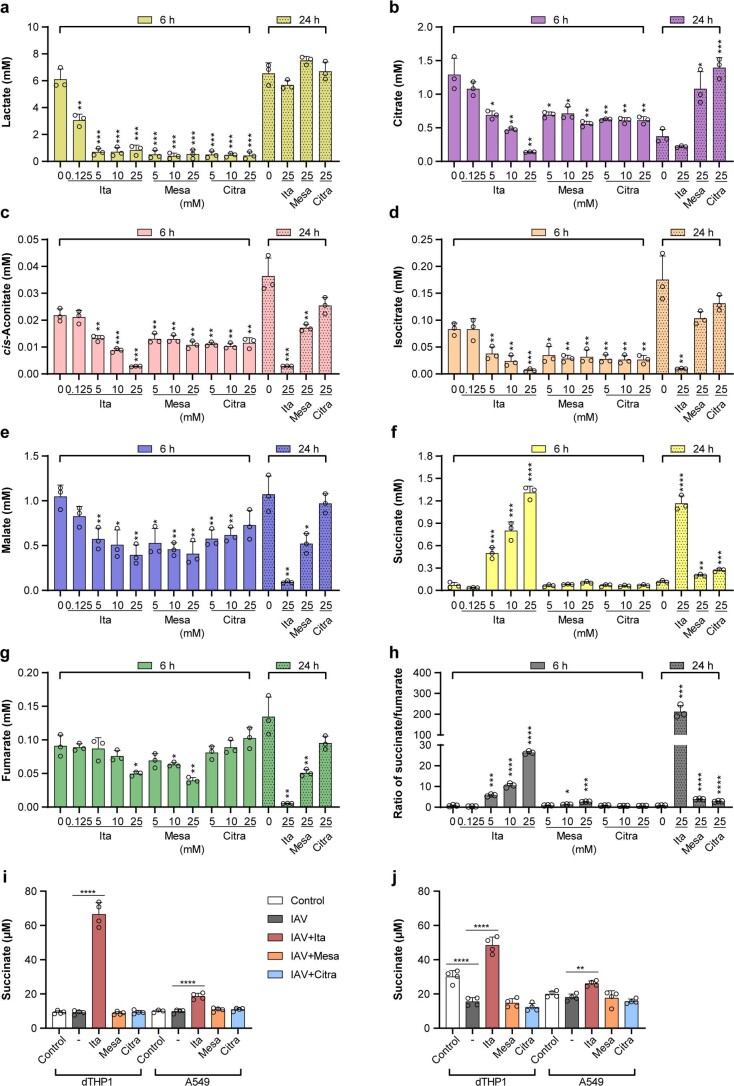
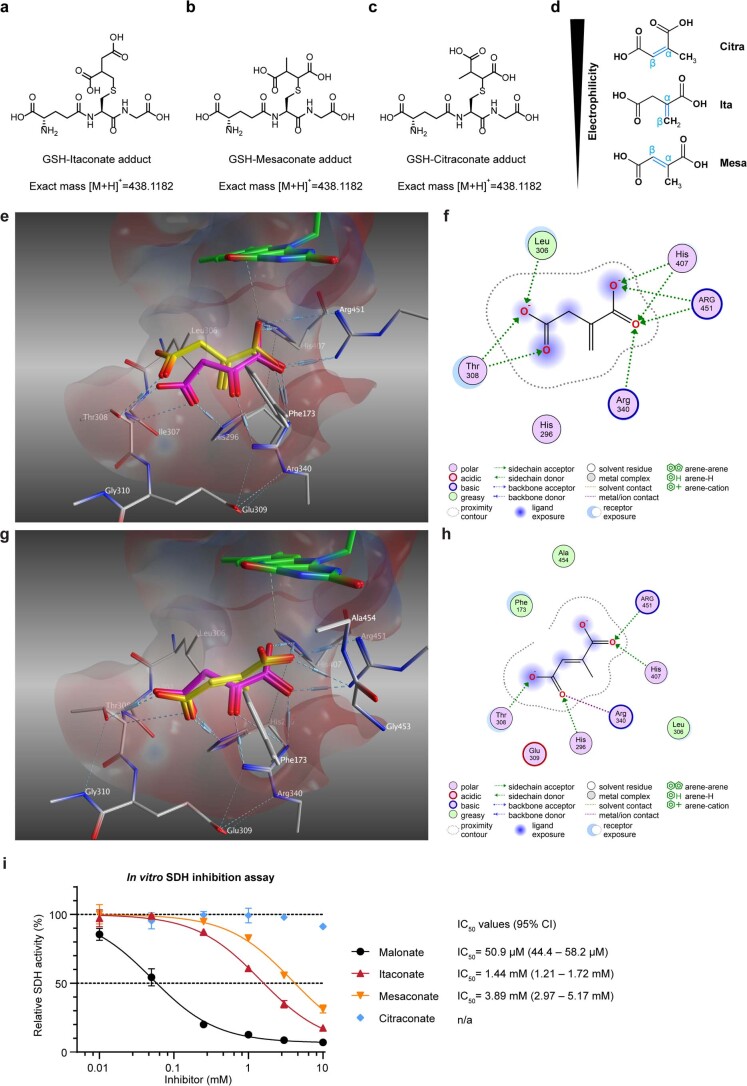
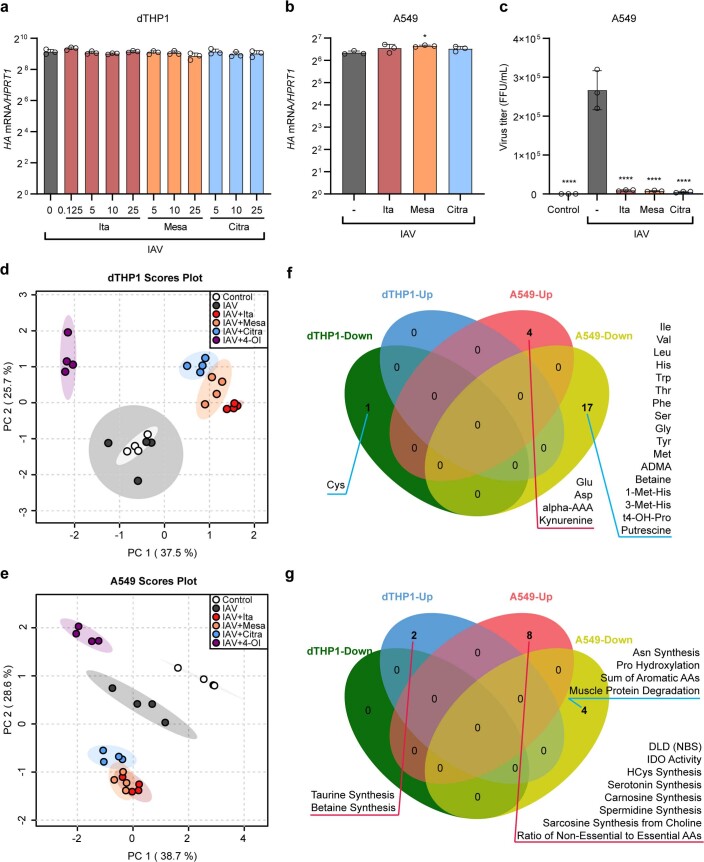
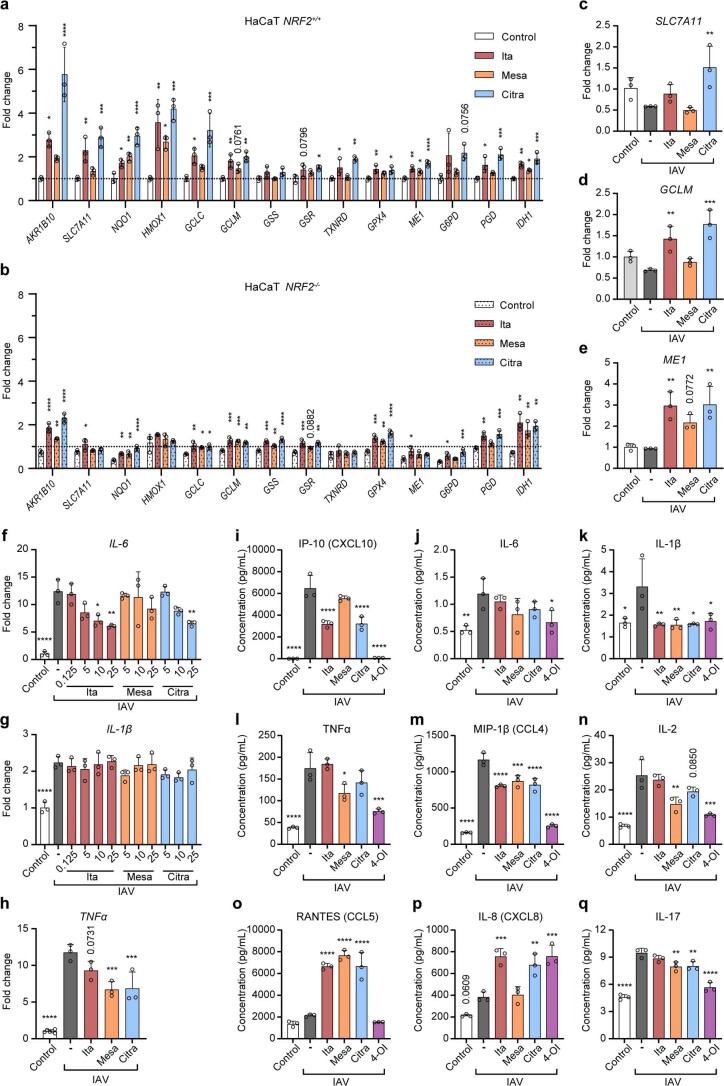
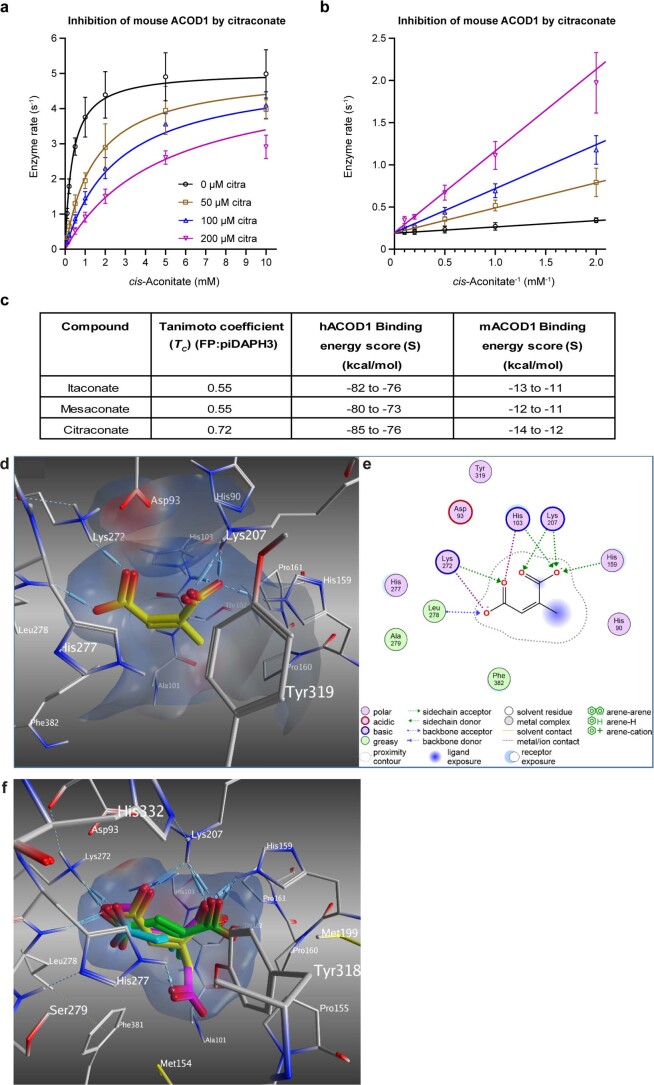
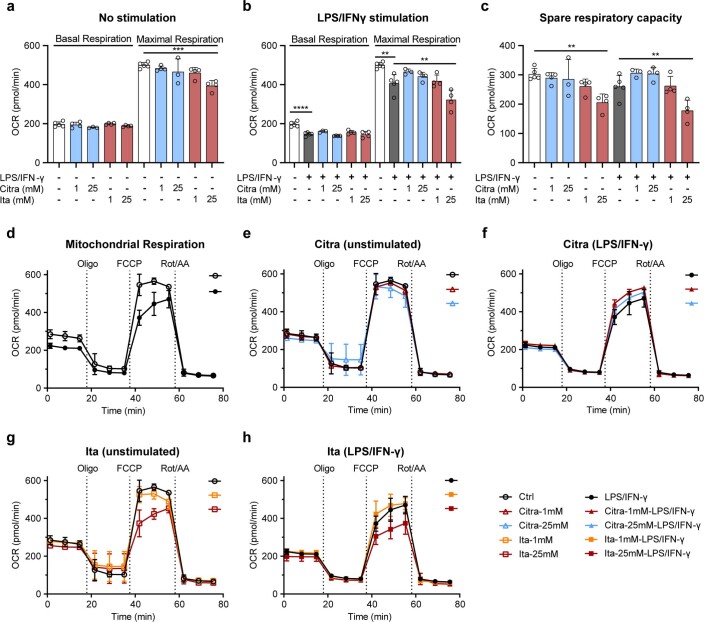
Although the immunomodulatory and cytoprotective properties of itaconate have been studied extensively, it is not known whether its naturally occurring isomers mesaconate and citraconate have similar properties. Here, we show that itaconate is partially converted to mesaconate intracellularly and that mesaconate accumulation in macrophage activation depends on prior itaconate synthesis. When added to human cells in supraphysiological concentrations, all three isomers reduce lactate levels, whereas itaconate is the strongest succinate dehydrogenase (SDH) inhibitor. In cells infected with influenza A virus (IAV), all three isomers profoundly alter amino acid metabolism, modulate cytokine/chemokine release and reduce interferon signalling, oxidative stress and the release of viral particles. Of the three isomers, citraconate is the strongest electrophile and nuclear factor-erythroid 2-related factor 2 (NRF2) agonist. Only citraconate inhibits catalysis of itaconate by cis-aconitate decarboxylase (ACOD1), probably by competitive binding to the substrate-binding site. These results reveal mesaconate and citraconate as immunomodulatory, anti-oxidative and antiviral compounds, and citraconate as the first naturally occurring ACOD1 inhibitor.


Conflict of interest statement

F.P., F.C., M.W., K.B., W.B., A.K.H.H. and W.A.M.E. are co-inventors on a patent covering medical applications of citraconate, including immunomodulatory, anti-oxidative and antiviral use. USE OF CITRACONATE AS A MEDICAMENT. Patent holder: Helmholtz Centre for Infection Research. Inventors: Pessler F, Chen F, Winterhoff M, Büssow K, Blankenfeldt W, Hirsch AKA, Elgaher WM, PCT/EP2022/060682 (22 April 2022).

Figures

Fig. 1
Fig. 1. Differential impact of itaconate isomers on concentrations of selected TCA cycle intermediates and lactate in dTHP1 cells.
Selected TCA intermediates and lactate were measured by HPLC–MS/MS at 6 and 24 h in the itaconate isomer uptake experiments shown in Extended Data Fig. 1. Concentrations are expressed based on calculated cell volume. a, PCA illustrating strong alterations due to all three isomers at 6 h, but a relative normalization of mesaconate and citraconate effects by 24 h. bd, The measured isomer is indicated above each graph, the added isomers below the x axis. e, Concentrations of lactate and selected TCA intermediates (concentrations given on the y axes) 6 h after addition of the isomers indicated below the x axis. All three isomers reduce lactate levels (consistent with inhibition of glycolysis), but only itaconate raises succinate levels, suggesting inhibition of SDH. Citra, citraconic acid; Ita, itaconic acid; Mesa, mesaconic acid. n = 3 biological replicates, means ± s.d. Unpaired t-test. *P ≤ 0.05, **P ≤ 0.01, ***P ≤ 0.001, ****P ≤ 0.0001; NS, not significant.
Fig. 2
Fig. 2. Differential effects of the isomers on NRF2 stabilization, mitochondrial ROS levels and IFN-signaling.
ad, Citraconate is the strongest NRF2 agonist. a,b, Stabilization of NRF2 protein in wild-type cells. Western blot (3 h after stimulation) of two independent experiments (a) and combined densitometric measurements of the bands at 110–120 kDa corresponding to NRF2 (b) (n = 2). c,d, Expression of the NRF2-inducible AKR1B10 mRNA in wild-type and NRF2–/– cells 16 h after stimulation. Cells were pre-treated with itaconate isomers for 6 h or left untreated and then stimulated with IFN-γ (300 U ml−1) for 10 h in the presence or absence of the isomers (n = 6, mean ± s.d.). e, Citraconate rescues SLC7A11 mRNA suppression by IFN-γ in wild-type but not NRF2–/– HaCaT cells (RT–qPCR). f, Citraconate exerts anti-oxidative effects similar to itaconate. dTHP1 cells were infected with IAV and ROS were measured at 12 h p.i. (itaconate isomers = 25 mM, 4-OI = 125 µM). gn, Shared and distinct immunomodulatory effects of the isomers and 4-OI. dTHP1 cells were infected with IAV in the absence or presence of itaconate, mesaconate, citraconate (variable concentrations) or 4-OI (125 µM), and inflammation-related molecules were measured at 12 h p.i. g,h, Levels of CXCL10 mRNA in cell pellets and CXCL10 protein in supernatant. i, Differential effects on inflammation-related polypeptides in cell culture supernatants (27-plex assay; separate experiment from g,h; isomer concentrations = 20 mM, 4-OI = 125 µM.) PCA based on concentrations of 25 targets that passed quality assessment. ci, n = 3 biological replicates, mean ± s.d. j,k, Itaconate isomers reduce STAT1 phosphorylation. A549 and dTHP1 cells (one representative blot of two replicas) were pretreated with itaconate isomers (25 mM) or 4-OI, infected with IAV for 2 h and treated for 10 h (dTHP1) and 22 h (A549) (anti-P-STAT1 immunoblot). ln, Citraconate reduces IAV-induced IFN responses in human lung tissue. Lung explants were infected with IAV (2 × 105 FFU ml−1) in the presence or absence of itaconate, citraconate and 4-OI at the indicated concentrations (mM). Expression of target mRNAs was measured at 24 h p.i. (five explants, three pieces per explant, total n = 15, median, interquartile range). Citra, citraconic acid; Ita, itaconic acid; Mesa, mesaconic acid. *P ≤ 0.05, **P ≤ 0.01, ***P ≤ 0.001, ****P ≤ 0.0001; one-way ANOVA with Dunnett’s multiple comparisons test, except ln (two-tailed Mann–Whitney U test with Bonferroni correction). Source data
Fig. 3
Fig. 3. Citraconate is a competitive inhibitor of ACOD1 that binds in the substrate-binding site.
ac, Cell-free assay. Recombinant hACOD1 was incubated with increasing concentrations of substrate (cis-aconitate) and inhibitor (citraconate) and itaconate accumulation was measured by HPLC. n = 3 independent assays, mean ± s.d. The line represents a curve fit to the Michaelis–Menten equation with a competitive inhibitor. b, Lineweaver–Burk plot of the data shown in a (mean ± s.d.). c, Summary of enzyme and inhibition kinetics based on a (hACOD1) and data shown in Extended Data Fig. 7a,b (mACOD1). d,e, Cell-based assay. A549 cells were transfected with a plasmid overexpressing hACOD1 and incubated with increasing concentrations of citraconate. Intracellular citraconate and itaconate concentrations were measured by HPLC–MS/MS. Adding citraconate leads to reduced itaconate accumulation in a dose-dependent manner (d), which is not due to decreased hACOD1 transcription (e). n = 3 biological replicates (d), n = 6 biological replicates (e), mean ± s.d. fg, Putative binding mode of citraconate (yellow) in the active site of hACOD1 (PDB ID: 6R6U). f, The C1- and C4-carboxyl groups of citraconate are optimally anchored in the active site through a network of electrostatic attractions; that is, hydrogen bonds and salt bridges (dashed lines) with the residues His159, Lys207, Lys272 and Leu278. Electrostatic protein surface at the active site: positive (blue), negative (red) and neutral (white). g, Two-dimensional ligand interactions. h, Molecular modelling of itaconate (yellow) compared with cis-aconitate (magenta) revealing fewer interactions between the two carboxyl groups of itaconate and the basic residues of the hACOD1 active site mainly due to its non-planar and flexible structure. CI, confidence intervals; citra, citraconate.
Fig. 4
Fig. 4. Citraconate prevents itaconate and mesaconate accumulation in LPS/IFN-γ-mediated macrophage activation.
dTHP1 cells were stimulated with LPS (200 ng ml−1) and IFN-γ (400 U ml−1) for the indicated times in the absence or presence of 0.1, 1, 5, 10 and 25 mM citraconate. Unstimulated dTHP1 cells treated for 6 h were used as an additional control. Itaconate isomers, lactate and the same TCA intermediates as in Fig. 1 were measured by LC–MS/MS. Concentrations 0.1 and 1 mM citraconate in medium resulted in strong ACOD1 inhibition at physiologically plausible intracellular citraconate concentrations and were thus used for the analyses shown in al. Data obtained with the 5–25 mM concentrations were additionally used to calculate IC50 values. a, PCA based on all analytes except citraconate. be, Time course of itaconate (b), mesaconate (c), citraconate (d) concentrations and succinate/fumarate ratio (e). fl, Concentrations of lactate and selected TCA intermediates. mo, ACOD1 inhibition by citraconate does not have a strong effect on inflammation in dTHP1 cells activated by LPS-IFN-γ. Experimental set-up identical to al. Levels of the indicated mRNAs were measured by RT–qPCR 12 h after stimulation. m, CXCL10 mRNA. n, IL-6 mRNA. o, IL-1β mRNA. Citra, citraconic acid; ita, itaconic acid. bo, n = 3 biological replicates, mean ± s.d. *P ≤ 0.05, **P ≤ 0.01, ***P ≤ 0.001, ****P ≤ 0.0001; one-way ANOVA with Dunnett’s multiple comparisons test.
Extended Data Fig. 1
Extended Data Fig. 1. Efficient uptake of all three isomers into dTHP1 cells.
Cells were incubated with 25 mM of the respective isomer for 6 and 24 h and concentrations of the three isomers were then measured by HPLC-MS/MS in supernatants and extracts of washed cells. a–f, Intracellular concentrations. Absolute concentrations are shown in a–c, and fractions of the other two isomers with respect to the isomer added to the medium in d–f. There is a dose-dependent increase in mesaconate when itaconate is added to medium (g) but a decrease in the mesaconate/itaconate fraction with increasing itaconate concentrations (d). Both observations are consistent with intracellular conversion of a small fraction of itaconate to mesaconate by a saturable, presumably enzymatic, process. g–i, Itaconate concentrations remain stable in cell supernatants. The known impurities of itaconate in mesaconate and citraconate are detected again (see also Supplementary Fig. S1c–g). n=3 biological replicates, means ±SD.
Extended Data Fig. 2
Extended Data Fig. 2. Dependence of mesaconate accumulation on itaconate synthesis.
a–h, Mesaconate accumulation peaks after itaconate accumulation in LPS-induced inflammation and depends on prior itaconate synthesis in dTHP1 cells. a–d, dTHP1 cells were stimulated with LPS/IFNγ and intracellular concentrations of the three isomers were measured by HPLC-MS/MS at the indicated time points. Citraconate was not detected. Neither itaconate nor mesaconate were detected in ACOD1–/– dTHP1 cells. The maximal itaconate concentration at 24 h was 460 µmol/L. n=3 biological replicates, means ±SD. e–h, Systemic inflammation was elicited in C57BL/6N mice by intraperitoneal LPS injection, and concentrations of the three isomers in spleen homogenates were measured by HPLC-MS/MS at the indicated time points. n=2 mice per time point. i–l, Mesaconate accumulation in A549 cells overexpressing ACOD1. Human or murine ACOD1 was expressed in A549 cells by transient transfection, and concentrations of the three isomers as well as selected TCA intermediates and lactate were measured by HPLC-MS/MS at the indicated time points. Values <LLOQ were considered missing values. Transfection of both enzymes resulted in a parallel rise of itaconate and mesaconate concentrations, whereas citraconate was not detected. mACOD1 expression led to a greater increase in succinate levels, consistent with greater SDH inhibition due to higher itaconate synthesis when compared to hACOD1. His159Gln and Lys272Gln are inactive hACOD1 variants. Concentrations are expressed per µg protein. n=3 biological replicates, mean ±SD.
Extended Data Fig. 3
Extended Data Fig. 3. Common and unique effects of itaconate, mesaconate, and citraconate on intracellular levels of lactate and TCA intermediates.
Analysis based on the experiment shown in Fig. 1, showing the 24 h time point in addition. The 0.125 mM concentration of itaconate was used to mimic the maximal contamination of itaconate found in 25 mM mesaconate. a–g, Concentrations of the indicated analytes 6 h after treatment with 5, 10, or 25 mM, and 24 h after treatment with 25 mM. h, Ratio of succinate to fumarate, indicating SDH inhibition. n=3, mean ±SD. Unpaired T-test. i,j, Succinate levels in IAV-infected dTHP1 and A549 cells, obtained in the same experiment as shown in Extended Data Fig. 5d,e and an independent experiment. Only itaconate addition raises succinate levels, and the effect is more pronounced in dTHP1 than in A549 cells. n=4 biological replicates, mean ±SD. One-way ANOVA followed by Dunnett’s multiple comparisons test. P values: * ≤0.05, ** ≤0.01, *** ≤0.001, **** ≤0.0001.
Extended Data Fig. 4
Extended Data Fig. 4. Citraconate is the most electrophilic isomer but the weakest SDH inhibitor.
a–c, Structures of the GSH adducts of the itaconate isomers. d, Ranking of the three isomers in terms of electrophilicity. e–h, Molecular modeling prediction of non-covalent binding of itaconate and mesaconate to the active site of SDH. e, 3D binding mode of itaconate (yellow) compared to oxaloacetate (magenta) in the succinate binding site of human SDHA (PDB ID: 6VAX). Binding was attained entirely through a network of electrostatic attractions, that is, hydrogen bonds and salt bridges, (dashed lines) between the C1- and C4-carboxyl groups and the active site residues (Thr308, Arg340, His407, and Arg451). Electrostatic protein surface at the active site: positive (blue), negative (red), neutral (white). Flavin adenine dinucleotide (FAD, green). f, 2D ligand interactions of itaconate. g, Potential binding mode of mesaconate (yellow) compared to oxaloacetate (magenta). Similar to itaconate, the C1- and C4-carboxyl groups of mesaconate are the exclusive moieties responsible for binding through hydrogen bonds and ionic interactions (dashed lines). However, its rigid and planar structure could only establish partial contacts compared to itaconate. h, 2D ligand interactions of citraconate. i, Comparison of SDH inhibition by itaconate, mesaconate, and citraconate (in vitro assay using bovine mitochondria). SDH activity was measured in the presence of increasing concentrations of itaconate, mesaconate, citraconate and the control inhibitor malonate (n=3 independent assays, mean ±SD). Of the isomers, itaconate was the strongest SDH inhibitor, there was essentially no inhibition by citraconate.
Extended Data Fig. 5
Extended Data Fig. 5. The itaconate isomers inhibit replication of influenza A virus (IAV) in the respiratory epithelial cell line A549.
dTHP1 and A549 cells were left untreated or incubated with itaconate, mesaconate or citraconate (20 mM) or 4-octyl itaconate (4-OI, 125 µM), infected with IAV PR8M (MOI=1), and then incubated with fresh medium containing the treatments. Replication was measured in dTHP1 cells 12 h p.i. by expression of HA mRNA (RT-qPCR) and in A549 cells 24 h p.i. by measuring HA mRNA (RT-qPCR) and viral titers (foci forming assay). a, HA mRNA (dTHP1 cells). b, HA mRNA (A549 cells). c, IAV titers (A549 cells). n=4 biological replicates, means ±SD. One-way ANOVA followed by Dunnett’s multiple comparisons test. P values: * ≤0.05, ** ≤0.01, *** ≤0.001, **** ≤0.0001. Shared and unique effects of the itaconate isomers on amino acid metabolism in IAV infected dTHP1 and A549 cells. d-g, Same experimental set-up as a-c, except that 4-OI (125 µM) was used as additional treatment. Concentrations of 20 amino acids, 30 amino acid metabolites, and 9 biogenic amines were measured by HPLC-MS/MS (MxP Quant 500 kit, Biocrates) after 12 h for dTHP1, 24 h for A549 (n=4 per group). Additional data, including concentrations of individual analytes and values of metabolite indicators, are shown in Supplementary Fig. S3 and S4. d,e, PCAs based on the 59 amino acid-related analytes. d, In dTHP1 cells, infection leads to modest changes only, while the three isomers exert similar but clearly discernable effects, which differ profoundly from the impact of 4-OI. e, In A549 cells, infection exerts a much stronger impact on amino acid metabolism. f, Venn diagrams showing analytes that are differentially abundant (unpaired T-test, FC>1.3, FDR ≤0.05) in A549 and dTHP1 infected and uninfected cells. g, Venn diagrams for the metabolite indicators (66 sums and ratios of functionally related analytes, calculated with Biocrates MetaboIndicatorTM software). Source Data Table 1 contains the source data pertaining to d-g.
Extended Data Fig. 6
Extended Data Fig. 6. Citraconate is the strongest NRF2 agonist.
a,b, Expression of 14 potentially NRF2-inducible genes in WT and NRF2–/– HaCaT cells 17.5 h after administration of itaconate isomers (20 mM). The greatest difference between expression in WT and KO cells is seen upon administration of citraconate. c–e, Induction of SLC7A11, GCLM, and ME1 mRNA in IAV-infected dTHP1 cells by citraconate but not mesaconate. Cells were pretreated with itaconate isomers (20 mM) for 12 h, incubated with virus-containing medium for 2 h (MOI=1), and then incubated with fresh medium containing itaconate isomers for a further 10 h. f–q, Immunomodulatory effects of the itaconate isomers. IAV infection experiment identical to c–e. f–h, Expression of the indicated mRNAs in cells (RT-qPCR). i–q, Concentrations of the indicated cytokines/chemokines in culture supernatants (multiplex microbead assay). Source Data Table S2 contains the raw data pertaining to i–q. a-q, n=3 biological replicates, means ±SD. P values: * ≤0.05, ** ≤0.01, *** ≤0.001, **** ≤0.0001; one-way ANOVA with Dunnett’s multiple comparisons test.
Extended Data Fig. 7
Extended Data Fig. 7. Citraconate is a competitive inhibitor of ACOD1.
a,b, Cell-free assay. Recombinant mACOD1 was incubated with increasing concentrations of substrate (cis-aconitate) and inhibitor (citraconate) and itaconate accumulation was measured by HPLC. n=3 independent assays, means ±SD. Kinetic data pertaining to the values listed in Fig. 3c. The line represents a curve fit to the Michaelis–Menten equation with a competitive inhibitor. b, Lineweaver–Burk plot of the data shown in a. c, Similarity to cis-aconitate (Tanimoto coefficient) and binding energies of the itaconate isomers to human and murine ACOD1. d, Putative binding mode of citraconate (yellow) in the active site of mouse ACOD1 (PDB ID: 6R6T). The C1- and C4-carboxyl groups of citraconate bind electrostatically via hydrogen bonds and ion contacts (dashed lines) to the active site residues (His103, His159, Lys207, Lys272, and Leu278). Electrostatic protein surface at the active site: positive (blue), negative (red), neutral (white). e, 2D ligand interactions of citraconate. f, Overlay of putative binding modes of citraconate (yellow), itaconate (cyan), and mesaconate (green) compared to that of the substrate cis-aconitate (magenta) in the active site of human ACOD1 (PDB ID: 6R6U). Only citraconate can adopt the same binding mode as cis-aconitate, where the cis-oriented carboxyl groups are fully involved in the interactions with the active-site residues (His159, Lys207, Lys272, and Leu278). In contrast, the carboxyl groups of itaconate and mesaconate interact partially resulting in lower binding affinity.
Extended Data Fig. 8
Extended Data Fig. 8. Itaconate, but not citraconate, depresses mitochondrial respiration in LPS/IFNγ-activated dTHP1 cells.
LPS/IFNγ stimulation and treatment with citraconate or itaconate (1 mM or 25 mM) were performed as in Fig. 4m-o. Mitochondrial respiration was measured by Seahorse assay in unstimulated dTHP1 cells or after 12 h of stimulation. a-c, Bar graphs showing oxygen consumption rate (OCR) due to basal respiration, maximal respiration (a and b), and spare respiratory capacity (c). 25 mM itaconate significantly reduced maximal respiration and spare respiratory capacity in LPS/IFNγ-induced dTHP1 cells, whereas there was a tendency (p=0.076 and 0.096 respectively) of 1 mM citraconate to prevent this decline, and there was a tendency of 25 mM itaconate to normalize spare respiratory capacity (p=0.082). In a n (biological replicates) were as follows: untreated = 5; 1 mM Citra = 4; 25 mM Citra = 3; 1 mM Ita = 4; 25 mM Ita = 4. In b n were as follows: untreated = 5; 1 mM Citra = 5; 25 mM Citra = 3; 1 mM Ita = 4; 25 mM Ita = 4. Results in c are computed from the experiment shown in a and b and therefore have the same n as the respective treatments in a and b. Means ±SD; one-way ANOVA followed by Dunnett’s multiple comparisons test. P values: * ≤0.05, ** ≤0.01, *** ≤0.001, **** ≤0.0001. d-h, OCR output curves that form the basis of the graphs shown in a-c. d, Unstimulated vs. LPS/IFNγ-stimulated cells. e, Citraconate treatment, unstimulated cells. f, Citraconate treatment, LPS/IFNγ-stimulated cells. g, Itaconate treatment, unstimulated cells. h, Itaconate treatment, LPS/IFNγ-stimulated cells. Results in d-h are computed from the experiment shown in a and b and therefore have the same n as the respective treatments in a and b. Means ±SD. P values: * ≤0.05, ** ≤0.01, *** ≤0.001, **** ≤0.0001; one-way ANOVA with Dunnett’s multiple comparisons test. Abbreviations: FCCP = carbonyl cyanide-4 (trifluoromethoxy) phenylhydrazone; Oligo = oligomycin; Rot = rotenone; AA = Antimycin A.

Comment in

References

    1. Michelucci A, et al. Immune-responsive gene 1 protein links metabolism to immunity by catalyzing itaconic acid production. Proc. Natl. Acad. Sci. USA. 2013;110:7820–7825. doi: 10.1073/pnas.1218599110. - DOI - PMC - PubMed
    1. Chen F, et al. Crystal structure of cis-aconitate decarboxylase reveals the impact of naturally occurring human mutations on itaconate synthesis. Proc. Natl. Acad. Sci. USA. 2019;116:20644–20654. doi: 10.1073/pnas.1908770116. - DOI - PMC - PubMed
    1. O’Neill LAJ, Artyomov MN. Itaconate: the poster child of metabolic reprogramming in macrophage function. Nat. Rev. Immunol. 2019;19:273–281. doi: 10.1038/s41577-019-0128-5. - DOI - PubMed
    1. Hooftman A, O’Neill LAJ. The immunomodulatory potential of the metabolite itaconate. Trends Immunol. 2019;40:687–698. doi: 10.1016/j.it.2019.05.007. - DOI - PubMed
    1. Winterhoff M, et al. Establishment, validation, and initial application of a sensitive LC–MS/MS assay for quantification of the naturally occurring isomers itaconate, mesaconate, and citraconate. Metabolites. 2021;11:270. doi: 10.3390/metabo11050270. - DOI - PMC - PubMed

Publication types