. 2022 Jun 2;8(1):32.
doi: 10.1186/s40942-022-00381-5.

Pascal short-pulse plus subthreshold endpoint management laser therapy for diabetic macular edema: the "sandwich technique"

Affiliations

Pascal short-pulse plus subthreshold endpoint management laser therapy for diabetic macular edema: the "sandwich technique"

J A Cardillo et al. Int J Retina Vitreous. .

Abstract

Background: Diabetic macular edema (DME) is the main cause of visual loss in diabetic patients. Despite the use of anti-VEGF therapy as first-line treatment, there are many patients whose response to treatment is poor or transient at best. Sophisticated laser techniques have emerged aiming at low-intensity retinal damage, avoiding excessive heat that causes tissue necrosis and related collateral effects.

Objective: To evaluate the effect of combined sublethal laser modalities from short-pulse duration (SPD) with endpoint management (EpM) subthreshold laser [named the "sandwich technique" (SWiT)] on central subfield thickness (CST) and best-corrected visual acuity (BCVA) in patients with DME.

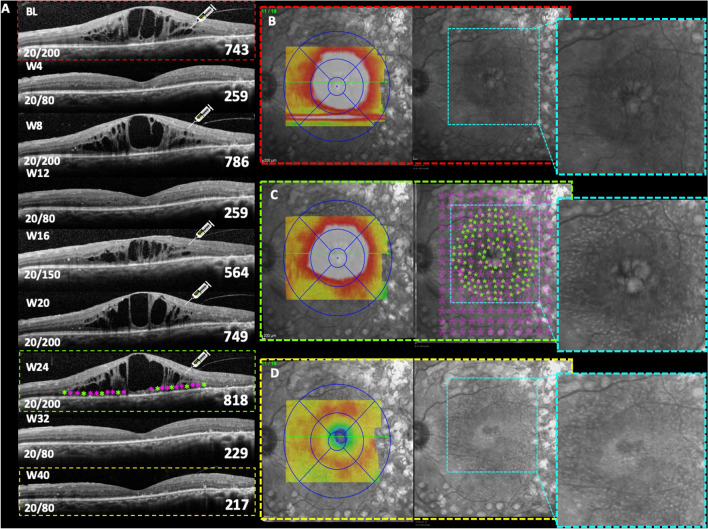
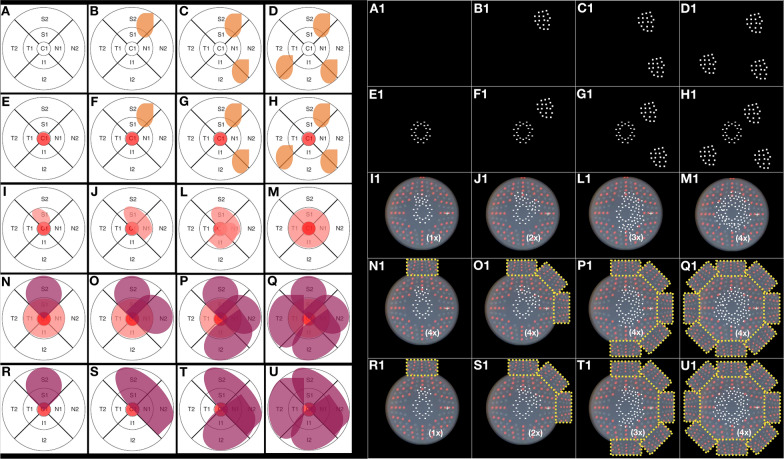
Material and methods: In this consecutive retrospective study, 37 patients (37 eyes) with center-involved (CI) DME were treated with SWiT laser therapy from April 2017 to June 2021. The technique consisted of a mean number of 200 (range number 50-400) SPD laser burns OCT-guided thickened area performed on the juxta- and perifoveal area 500 µm away from the foveal center, overlapping with a mean number of 1000 (range number 800-1200) EpM laser burns focused on 6 mm macular diameter area but saving 300 µm toward the foveal center. All patients underwent ophthalmological evaluations, including BCVA and CST measurement by spectral-domain optical coherence tomography (SD-OCT), before and after SWiT laser therapy. The mean follow-up time was 19.2 months (range 2-60 months).

Results: Thirty-five out of 37 cases showed an improvement in CST and BCVA following treatment. At baseline, mean CST (µm) ± standard error (SE) and mean BCVA (logMAR) ± SE was 456.95 ± 37.00 and 0.71 ± 0.29, respectively. After a mean follow-up of 19.2 months, mean CST (µm) ± SE and BCVA (logMAR) ± SE were 272.09 ± 9.10 (p < 0.0001) and 0.54 ± 0.26 (p = 0.003), respectively. A statistically significant reduction in CST and improvement in BCVA was noted after laser therapy application. The anti-VEGF injection frequency was reduced during the mean 19.2 months of the study period.

Conclusions: The novel "sandwich" laser therapy aid reduced CST and improved BCVA in this retrospective case series. Further prospective studies are warranted.

Keywords: Diabetic macular edema; Macular grid and focal laser; Short-pulse laser; Subthreshold laser.


Conflict of interest statement

The authors declare that they have no competing interests.

Figures

Fig. 1
Fig. 1
Patient with chronic DME and recently unsustained anti-VEGF response. A SD-OCT monthly follow-up of prn-IVA ("pro re nata" intravitreal aflibercept) therapy with associated SWiT laser therapy on week 24 after two consecutive unresponsive IVA injections. Anatomical SD-OCT image showing hyporreflective intraretinal cysts with mean CST (µm) and BCVA (Snellen) of approximately 743 and 20/200, respectively, at baseline. B Macular thickness map (dashed red rectangle) correlated with cystic hyper-reflectance edema on near-IR (dashed cyan square). C Twenty-fourth week of follow-up showing SD-OCT section [smaller dashed green rectangle with representative laser targets spots from green (SPD) and purple (EpM) asterisks] and the mean CST of 818 µm on the thickness map (bigger dashed green rectangle) and near-IR revealing hyper-reflectance dots (dashed cyan square) from recent SWiT laser therapy (SPD, green stars and EpM, light purple stars). D Forty-week follow-up revealing SD-OCT section (smaller dashed yellow rectangle) and the mean CST of 217 µm on the thickness map (bigger dashed yellow rectangle) after 8 weeks of combined IVA and SWiT laser therapy. Absent cystic hyper-reflectance edema showing ellipsoid band irregularities corroborating hyper-reflectance dots on near-IR (dashed cyan square). Visual acuity (BCVA of 20/80) stability since the 32nd week of follow-up
Fig. 2
Fig. 2
Schematic representation of laser display and anatomical responsiveness. A Representative retinal image section (dashed white oval) of photothermal effects producing retinal photorepair from SD-OCT image (dashed white rectangle) of retinal edema during SWiT laser therapy. B Representative retinal image section (green rectangle) from SD-OCT image of solved macular edema. C Representative vascular retina on posterior pole showing SWiT arrangement comprising barely visible marks spread 500 µm from the foveal center (SPD, white dots) and invisible marks (EpM, light purple dots) overlapping the SPD-treated area and reaching up to 300 µm from the foveal center. D Representative retinal image section (dashed white oval) of ETDRS laser scar from SD-OCT image (dashed white rectangle) performed in the past
Fig. 3
Fig. 3
DME pattern and laser approach in OCT-guided technique. A–A1 Regular CST ≤ 300 µm. BB1–DD1 Extra-foveal DME. E–E1 Center-involved (CI) DME. FF1–HH1 Extrafoveal DME associated with CI-DME. II1–MM1 Progressive inner subfield involvement associated with CI-DME. NN1–QQ1 Progressive outer subfield involvement associated with the inner subfield and CI-DME. RR1-UU1 Progressive inner-outer quadrant subfield involvement associated with CI-DME
Fig. 4
Fig. 4
Patient with chronic and recurrent DME that required anti-VEGF therapy. A CST map overlying near-IR image revealing diffuse CI-DME. B Late phase of fluorescein angiography showing cystoid hyperfluorescent leaking (dashed red rectangle). C Baseline SD-OCT showing hyporreflective inner retinal cysts and atrophic outer retinal lesions located temporally to the fovea from previous ETDRS laser therapy (yellow arrowheads). The CST measured 424 µm. Illustrative IVR (intravitreal ranibizumab) injection combined with SWiT laser therapy (SPD, green arrows and EpM, light purple stars). Baseline BCVA (Snellen) was 20/50. D Five months after SWiT laser therapy with CST map showing an absence of DME. E Late phase of fluorescein angiography without leaking (dashed red rectangle) and presence of tiny hypofluorescent dots spread widely on the macular area, as a result of the SPD laser array (green arrowheads). Also, representative invisible EpM laser targets (light purple stars). F SD-OCT image of a five-month resolved macular edema showing hyperreflective dots in the outer retina due to photothermal cell activation from the SPD laser pattern (green asterisks) and subthreshold anatomical representative EpM targets (pink asterisks). The atrophic outer retinal lesions located temporally to the fovea from previous ETDRS laser therapy were maintained (yellow asterisks). Interestingly, the CST decreased to 294 µm. G Eighteen months later, the SD-OCT still showed a stable CST of 287 µm, and correlated visual acuity improvement (Snellen BCVA of 20/25) was obtained since the 5-month follow-up visit
Fig. 5
Fig. 5
Patient with chronic DME and recently unsustained anti-VEGF response. A SD-OCT 20-week monthly follow-up of prn-IVA therapy and associated SWiT laser therapy on week 16 after two consecutive unresponsive IVA injections. Anatomical SD-OCT image with mean CST (µm) of 304 and visual BCVA (Snellen) of approximately 20/125 at baseline. B Baseline intermediate phase of fluorescein angiography (dashed orange square) revealing hyperfluorescent microaneurysms (red arrowheads) correlated with thickened edema (dashed cyan square) on the thickness-map (white-lined square). C Intermediate phase of fluorescein angiography (dashed yellow square) after a 20-week follow-up showing hypofluorescent density spots (green arrowheads) related to SPD laser shots and subthreshold anatomical representative EpM targets (light purple stars). Absence of edema (dashed cyan square) on the corresponding thickness map area (white-lined square) and undetectable fluorescein angiography of inactive microaneurysms. After the 20-week follow-up, visual improvement (Snellen BCVA of 20/60) correlated with the anatomical CST decrease (255 µm) on the SD-OCT image after 4 weeks of SWiT therapy

References

    1. Lam DW, LeRoith D. The worldwide diabetes epidemic. Curr Opin Endocrinol Diabetes Obes. 2012;19(2):93–96. doi: 10.1097/MED.0b013e328350583a. - DOI - PubMed
    1. Yau JW, Rogers SL, Kawasaki R, et al. Global prevalence and major risk factors of diabetic retinopathy. Diabetes Care. 2012;35(3):556–564. doi: 10.2337/dc11-1909. - DOI - PMC - PubMed
    1. Fong DS, Aiello L, Gardner TW, et al. American Diabetes Association retinopathy in diabetes. Diabetes Care. 2004;27:S84–S87. doi: 10.2337/diacare.27.2007.S84. - DOI - PubMed
    1. Lee R, Wong TY, Sabanayagam C. Epidemiology of diabetic retinopathy, diabetic macular edema and related vision loss. Eye Vis (Lond) 2015;2:17. doi: 10.1186/s40662-015-0026-2. - DOI - PMC - PubMed
    1. Early Treatment Diabetic Retinopathy Study Research Group Photocoagulation for Diabetic Macular Edema Early treatment diabetic retinopathy study Report Number 1. Arch Ophthalmol. 1985;103(12):1796–1806. doi: 10.1001/archopht.1985.01050120030015. - DOI - PubMed

LinkOut - more resources