Meta-Analysis
. 2022 Jun 3;41(1):193.
doi: 10.1186/s13046-022-02396-0.

Focal Adhesion Kinase (FAK)-Hippo/YAP transduction signaling mediates the stimulatory effects exerted by S100A8/A9-RAGE system in triple-negative breast cancer (TNBC)

Affiliations
Meta-Analysis

Focal Adhesion Kinase (FAK)-Hippo/YAP transduction signaling mediates the stimulatory effects exerted by S100A8/A9-RAGE system in triple-negative breast cancer (TNBC)

Damiano Cosimo Rigiracciolo et al. J Exp Clin Cancer Res. .

Abstract

Background: Understanding the intricate signaling network involved in triple-negative breast cancer (TNBC) represents a challenge for developing novel therapeutic approaches. Here, we aim to provide novel mechanistic insights on the function of the S100A8/A9-RAGE system in TNBC.

Methods: TNM plot analyzer, Kaplan-Meier plotter, Meta-analysis, GEPIA2 and GOBO publicly available datasets were used to evaluate the clinical significance of S100A8/A9 and expression levels of S100A8/A9, RAGE and Filamin family members in breast cancer (BC) subtypes. METABRIC database and Cox proportional hazard model defined the clinical impact of high RAGE expression in BC patients. Multiple bioinformatics programs identified the main enriched pathways within high RAGE expression BC cohorts. By lentiviral system, TNBC cells were engineered to overexpress RAGE. Western blotting, immunofluorescence, nucleus/cytoplasm fractionation, qRT-PCR, gene silencing and luciferase experiments were performed to identify signal transduction mediators engaged by RAGE upon stimulation with S100A8/A9 in TNBC cells. Proliferation, colony formation and transwell migration assays were carried out to evaluate the growth and migratory capacity of TNBC cells. Statistical analysis was performed by ANOVA and independent t-tests.

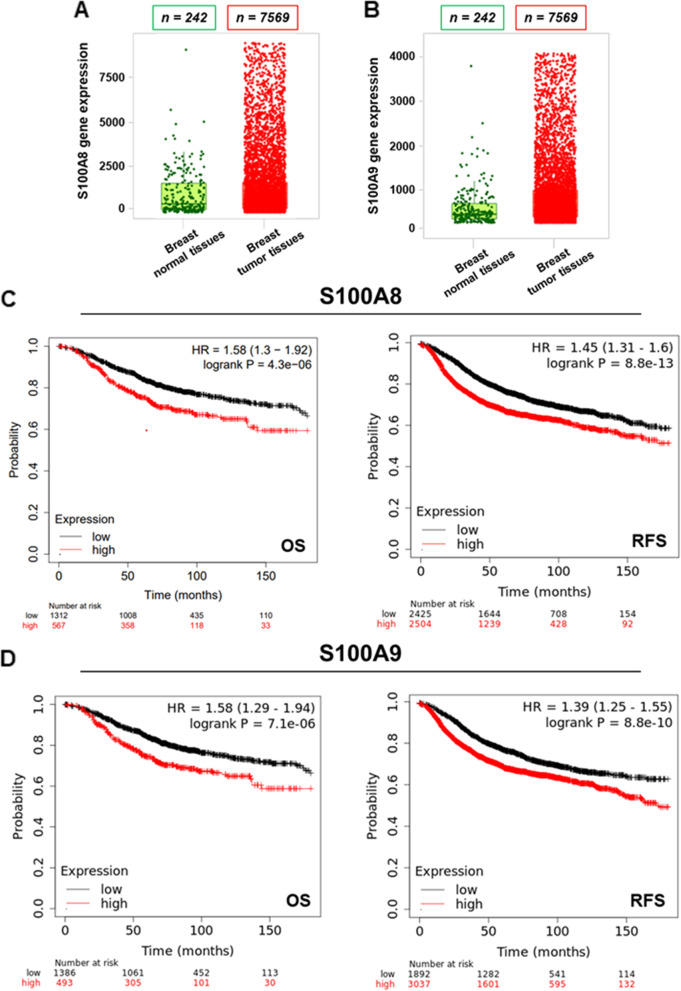
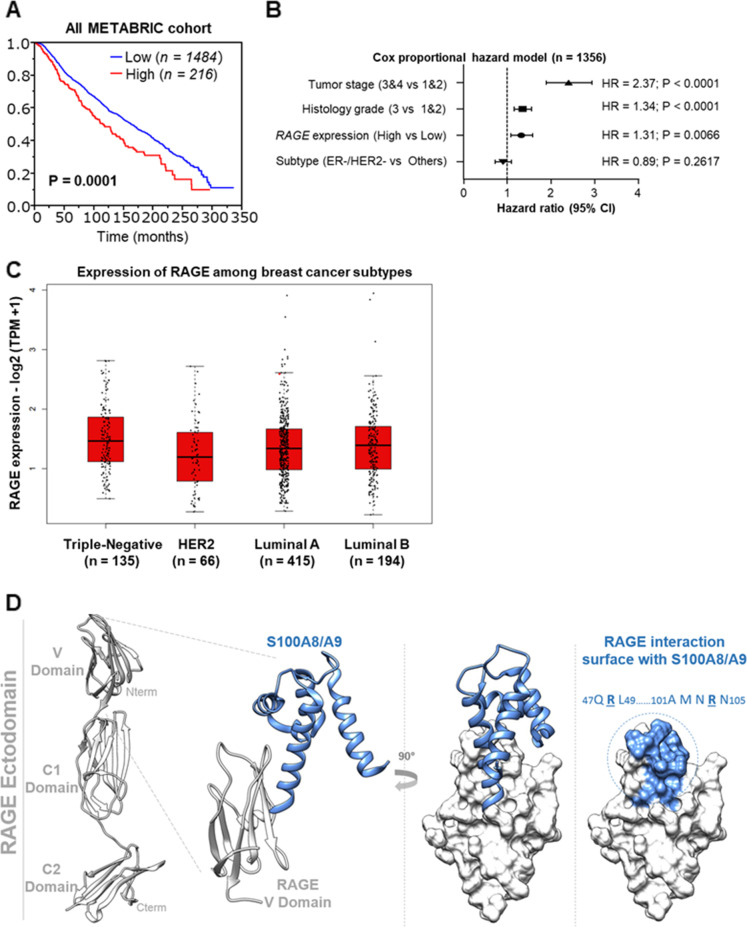
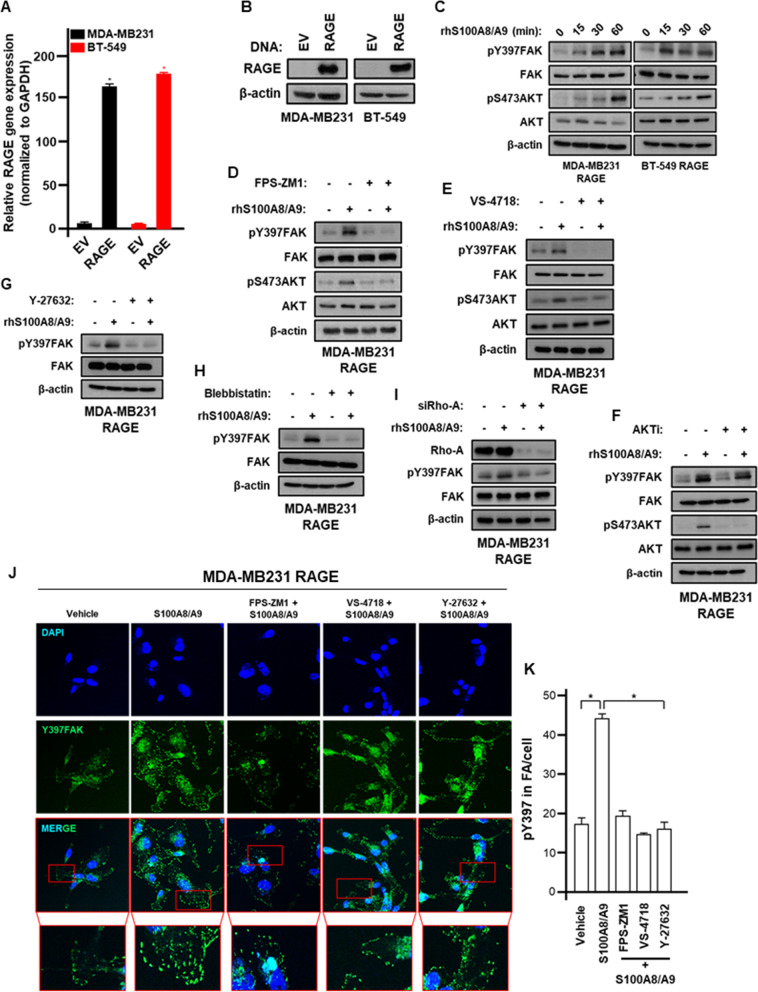
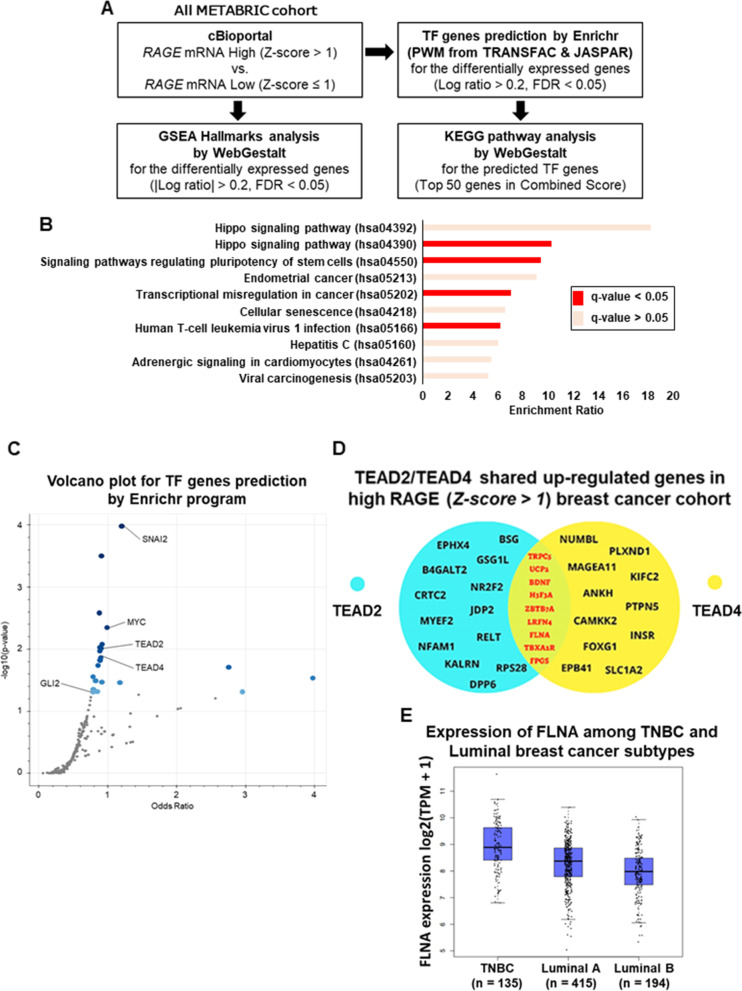
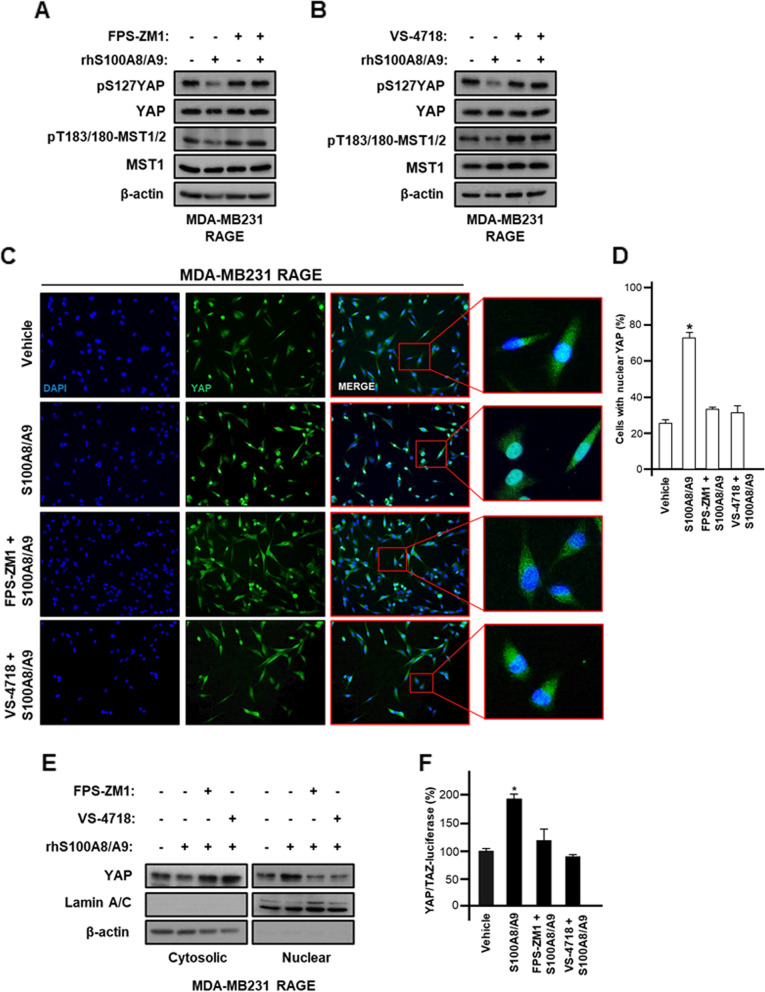
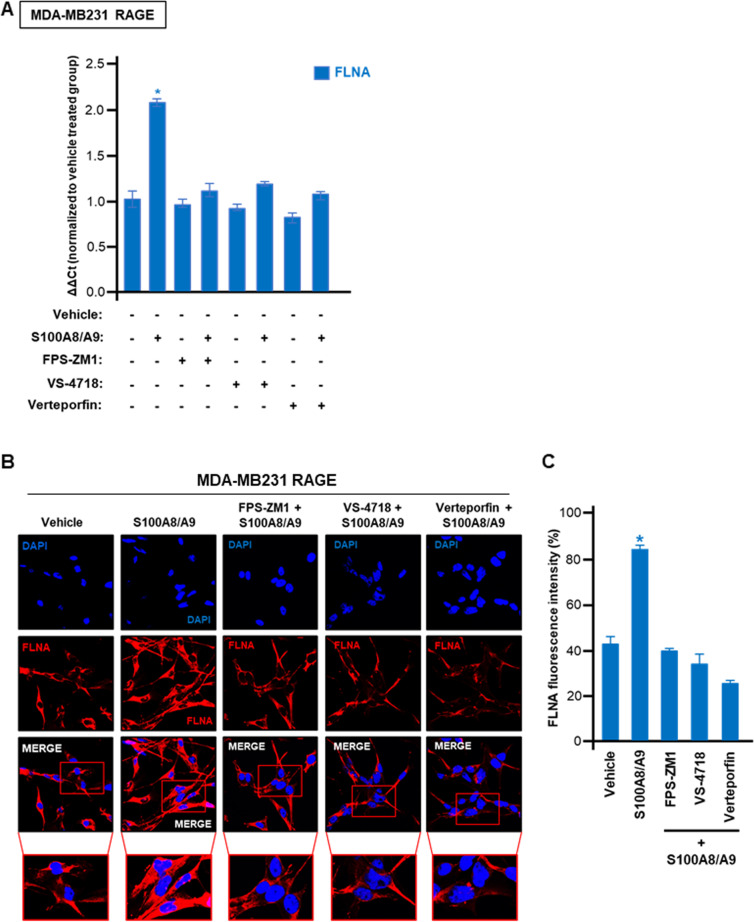
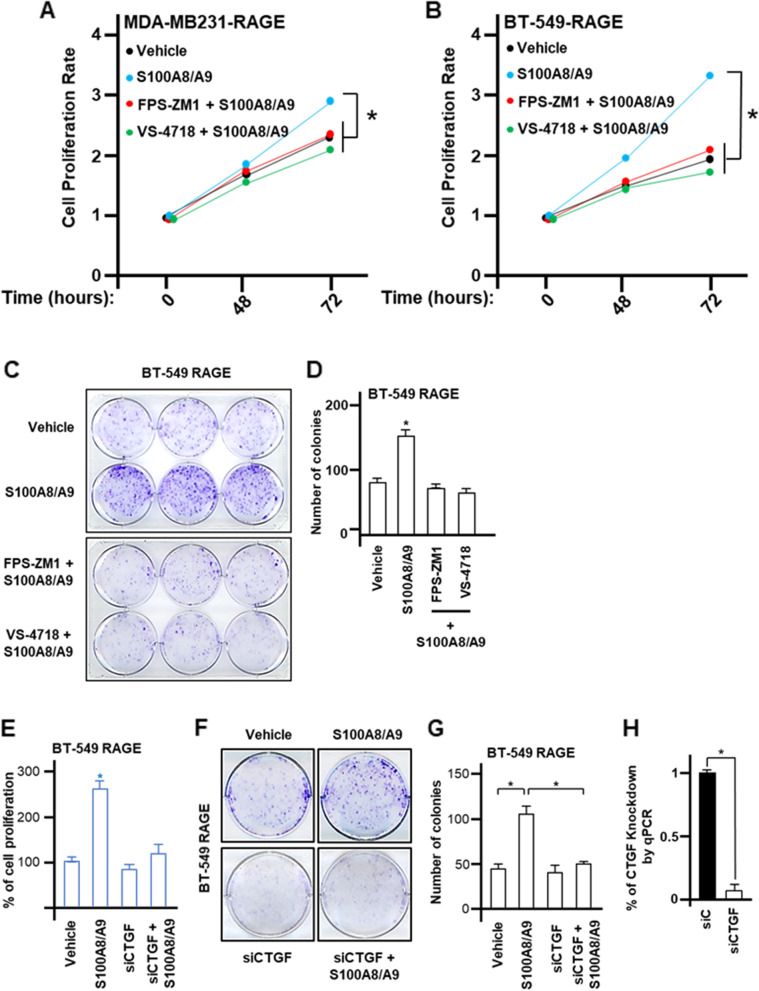
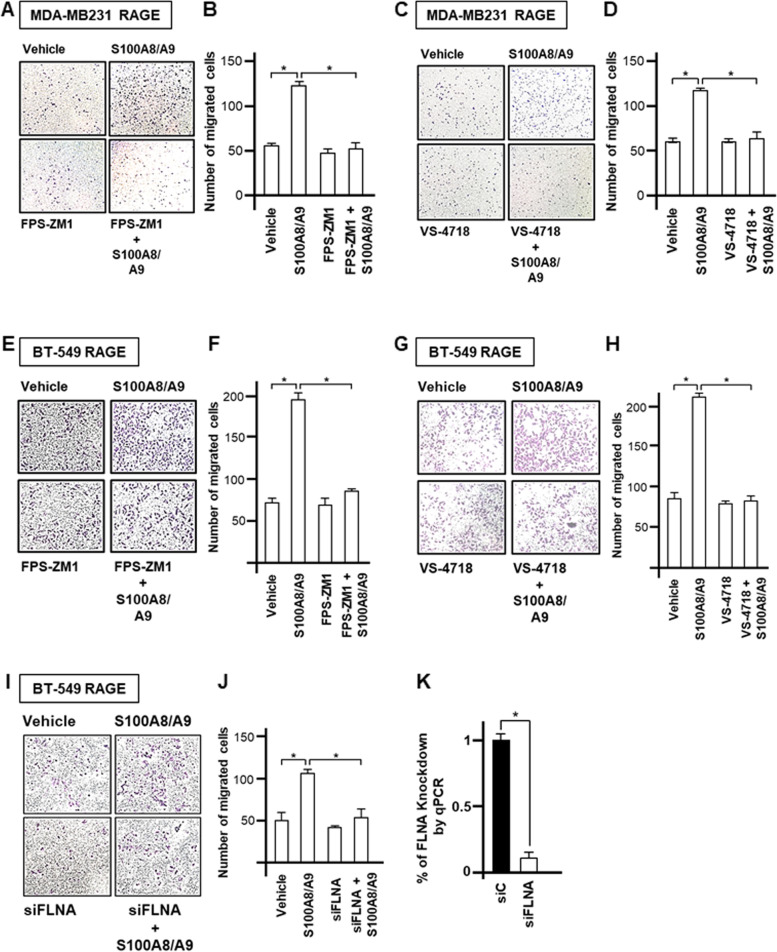
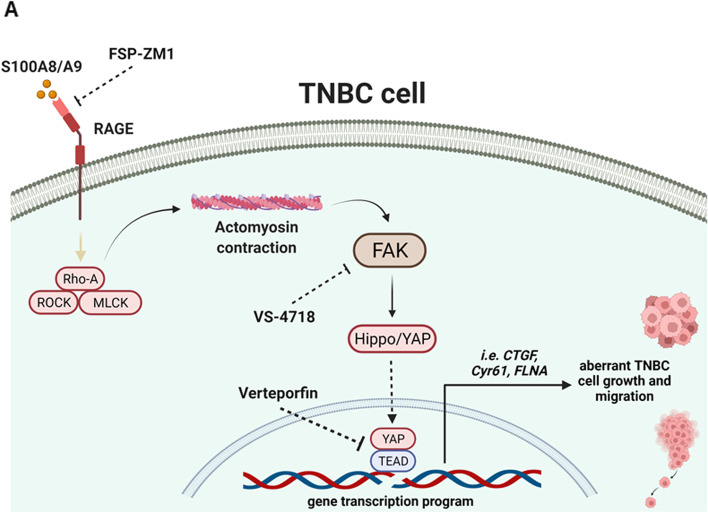
Results: We found a remarkable high expression of S100A8 and S100A9 in BC, particularly in HER2-positive and TNBC, with the latter associated to worst clinical outcomes. In addition, high RAGE expression correlated with a poor overall survival in BC. Next, we determined that the S100A8/A9-RAGE system triggers FAK activation by engaging a cytoskeleton mechanosensing complex in TNBC cells. Through bioinformatics analysis, we identified the Hippo pathway as the most enriched in BC patients expressing high RAGE levels. In accordance with these data, we demonstrated the involvement of S100A8/A9-RAGE-FAK signaling in the control of Hippo/YAP activities, and we established the crucial contribution of RAGE-FAK-YAP circuitry in the growth and migratory effects initiated by S100A8/A9 in TNBC cells.

Conclusions: The present study provides novel mechanistic insights on RAGE actions in TNBC. Moreover, our findings suggest that RAGE-FAK-YAP transduction pathway could be exploited as a druggable system halting the aggressive TNBC subtype.

Keywords: BT-549; FAK; Hippo/YAP; MDA-MB-231; RAGE; S100A8/A9; TNBC.


Conflict of interest statement

The authors disclosed no conflicts of interest. Nijiro Nohata is an employee of MSD K.K., a subsidiary of Merck & Co., Inc., and reports personal fees from MSD K. K outside of this study.

Figures

Fig. 1
Fig. 1
S100A8 and S100A9 are greatly expressed in primary breast tumors and correlate with poor clinical outcomes. A TNM box plot of S100A8 gene expression in normal and breast tumor tissues. B TNM box plot of S100A9 gene expression in normal and breast tumor tissues. C Kaplan-Meier Plotter Overall Survival (OS) (n = 1879) and Relapse Free Survival (RFS) (n = 4929) analysis in breast cancer subtypes harboring low and high levels of S100A8, respectively, at a follow up threshold of 180 months. Log-rank p-value is indicated within the boxes. All possible cutoff values between the lower and upper quartiles were automatically computed (i.e., auto select best cutoff on the website). Cutoff values used in the analysis were as follows: S100A8-OS: 3285; S100A8-RFS: 639. D Kaplan-Meier Plotter Overall Survival (OS) (n = 1879) and Relapse Free Survival (RFS) (n = 4929) in breast cancer subtypes harboring low and high levels of S100A9, respectively, at a follow up threshold of 180 months. Log-rank p-value is indicated within the boxes. All possible cutoff values between the lower and upper quartiles were automatically computed (i.e., auto select best cutoff on the website). Cutoff values used in the analysis were as follows: S100A9-OS: 2293; S100A9-RFS: 278
Fig. 2
Fig. 2
Increased RAGE expression correlates with worse prognostic hallmarks in breast cancer. A Median Overall Survival (OS) rate in breast cancer patients harboring high and low RAGE expression levels. p-value is shown within the box. B Multivariate Cox proportional hazard model linking RAGE expression pattern to breast tumor stage, histological grade and receptor expression pattern, respectively. C Gene Expression Profiling Interactive Analysis (GEPIA) box plot of RAGE in TNBC, HER2-positive, Luminal-A and Luminal-B breast cancer subclasses. D Working hypothesis postulating the potential putative binding site of S100A8/A9 on the V-domain of RAGE
Fig. 3
Fig. 3
S100A8/A9-RAGE signaling activates FAK in TNBC cells. A RAGE mRNA levels in MDA-MB231 and BT-549 cells after infection with pCDNA3 and pcDNA3.RAGE DNA vectors. B RAGE immunoblot in MDA-MB231 and BT-549 cells after infection with pCDNA3 and pcDNA3.RAGE DNA vectors. C pY397FAK, FAK, pS473AKT and AKT immunoblots in MDA-MB231 and BT-549 cells overexpressing RAGE and treated with 100 ng/ml rhS100A8/A9 for the indicated times. D pY397FAK, FAK, pS473AKT and AKT immunoblots in MDA-MB231 cells overexpressing RAGE and treated for 30 minutes with 100 ng/ml rhS100A8/A9 alone or in combination with 1 μM RAGE antagonist FPS-ZM1. E pY397FAK, FAK, pS473AKT and AKT immunoblots in MDA-MB231 cells overexpressing RAGE and treated for 30 minutes with 100 ng/ml rhS100A8/A9 alone or in combination with 1 μM FAK inhibitor VS-4718. F pY397FAK, FAK, pS473AKT and AKT immunoblots in MDA-MB231 cells overexpressing RAGE and treated for 30 minutes with 100 ng/ml rhS100A8/A9 alone or in combination with 1 μM AKT inhibitor Ipatasertib. G pY397FAK and FAK immunoblots in MDA-MB231 cells overexpressing RAGE and treated for 30 minutes with 100 ng/ml rhS100A8/A9 alone or in combination with 1 μM ROCK inhibitor Y-27632. H pY397FAK and FAK immunoblots in MDA-MB231 cells overexpressing RAGE and treated for 30 minutes with 100 ng/ml rhS100A8/A9 alone or in combination with 1 μM Myosin II inhibitor Blebbistatin. I pY397FAK and FAK immunoblots in MDA-MB231 cells overexpressing RAGE and treated for 30 minutes with 100 ng/ml rhS100A8/A9 alone or in the presence of siRNA control and siRNA targeting Rho-A, respectively. J Y397FAK (green) and Nuclei (blue) confocal immunofluorescence staining performed in MDA-MB231 cells overexpressing RAGE and stimulated for 30 minutes with 100 ng/ml rhS100A8/A9 alone or in combination with 1 μM RAGE antagonist FPS-ZM1, 1 μM FAK inhibitor VS-4718 and 1 μM ROCK inhibitor Y-27632, respectively. K pY397 relative quantification in FA/cell. Error bars represent mean ± SD. * indicates p-value < 0.05. ꞵ-actin served as loading control for immunoblots. Results shown are representative of three independent experiments performed in triplicate
Fig. 4
Fig. 4
Hippo pathway is significantly enriched in high RAGE expression breast cancer cohort. A Differentially expressed genes (DEGs) between high (Z-score > 1) and low (Z-score ≤ 1) RAGE expression groups in breast cancer and estimation of GSEA Hallmark in DEGs using cBioportal and Webgestalt programs. B Putative significant pathways identified among the high RAGE (Z-score > 1) expression breast cancer group as indicated by the KEGG pathway analysis for the predicted TF genes based on the DEGs. C Volcano plot for TF genes prediction by Enrichr program in high RAGE (Z-score > 1) expression breast cancer cohort. The Volcano plot shows the significance of each potential TF gene predicted by Enrichr program based on the position weight matrices from JASPAR & TRANSFAC databases. The x-axis measures the odds ratio (0, inf) calculated for the TF genes, while the y-axis gives the -log10 (p-value) of the TF genes. Larger blue points represent significant TF genes (p-value < 0.05); smaller gray points represent non-significant TF genes. The darker blue color points means the highest significance. D Venn diagram of the shared up-regulated genes by TEAD2 and TEAD4 Hippo pathway TFs in high RAGE (Z-score > 1) expression breast cancer cohort. E Gene Expression Profiling Interactive Analysis (GEPIA) box plot of FLNA expression levels in TNBC, Luminal-A and Luminal-B breast cancer subtypes
Fig. 5
Fig. 5
S100A8/A9-RAGE-FAK signaling triggers YAP activity in TNBC. A pS127YAP, YAP, pT183/180-MST1/2 and MST1 immunoblots in MDA-MB231 cells stable overexpressing RAGE and treated for 60 minutes with 100 ng/ml rhS100A8/A9 alone or in combination with 1 μM RAGE antagonist FPS-ZM1. B pS127YAP, YAP, pT183/180-MST1/2 and MST1 immunoblots in MDA-MB231 cells overexpressing RAGE and treated for 60 minutes with 100 ng/ml rhS100A8/A9 alone or in combination with 1 μM FAK inhibitor VS-4718. C YAP nuclear immunofluorescence staining in MDA-MB231 cells overexpressing RAGE and treated for 60 minutes with 100 ng/ml rhS100A8/A9 alone or in combination with 1 μM RAGE antagonist FPS-ZM1 or 1 μM FAK inhibitor VS-4718. D Relative quantification of cells with enhanced YAP nuclear localization. E YAP nuclear and cytoplasmic fractionation in MDA-MB231 cells overexpressing RAGE treated for 60 minutes with 100 ng/ml rhS100A8/A9 alone or in combination with 1 μM RAGE antagonist FPS-ZM1 or 1 μM FAK inhibitor VS-4718, using lamin A/C and ꞵ-actin as nuclear and cytoplasmic control markers, respectively. F YAP/TAZ luciferase reporter assay in MDA-MB231 cells overexpressing RAGE and treated for 6 hours with 100 ng/ml rhS100A8/A9 alone or in combination with 1 μM RAGE antagonist FPS-ZM1 or 1 μM FAK inhibitor VS-4718. Error bars represent mean ± SD. * indicates p-value < 0.05. ꞵ-actin served as loading control for immunoblots. Results shown are representative of three independent experiments performed in triplicate
Fig. 6
Fig. 6
FLNA is upregulated by S100A8/A9-RAGE-FAK-YAP transduction network in TNBC. A FLNA mRNA levels in MDA-MB231 cells overexpressing RAGE and treated for 6 hours with 100 ng/ml rhS100A8/A9 alone or in combination with 1 μM RAGE antagonist FPS-ZM1, 1 μM FAK inhibitor VS-4718 and 1 μM YAP/TEAD disruptor Verteporfin. B FLNA (red) and Nuclei (blue) confocal immunofluorescence staining in MDA-MB231 cells overexpressing RAGE and stimulated for 6 hours with 100 ng/ml rhS100A8/A9 alone or in combination with 1 μM RAGE antagonist FPS-ZM1, 1 μM FAK inhibitor VS-4718 and 1 μM YAP/TEAD disruptor Verteporfin, respectively. C Relative percentage of FLNA fluorescence intensity. Error bars represent mean ± SD. * indicates p-value < 0.05. Results shown are representative of three independent experiments performed in triplicate
Fig. 7
Fig. 7
S100A8/A9-RAGE system prompts growth effects in TNBC cells. A Cell proliferation in MDA-MB231 cells overexpressing RAGE upon stimulation for 72 hours with 100 ng/ml rhS100A8/A9 used alone or in combination with 1 μM RAGE antagonist FPS-ZM1 or 1 μM FAK inhibitor VS-4718. B Cell proliferation in BT-549 cells overexpressing RAGE upon stimulation for 72 hours with 100 ng/ml rhS100A8/A9 used alone or in combination with RAGE antagonist 1 μM FPS-ZM1 or 1 μM FAK inhibitor VS-4718. C-D Colony formation assay in BT-549 cells overexpressing RAGE and treated for 10 days with 100 ng/ml rhS100A8/A9 alone or in combination with 1 μM RAGE antagonist FPS-ZM1m or 1 μM FAK inhibitor VS-4718. E Cell proliferation in BT-549 cells overexpressing RAGE and transfected with siRNA control (20 nM) and siRNA targeting CTGF (20 nM) and stimulated for 72 hours with 100 ng/ml rhS100A8/A9. F-G Colony formation assay in BT-549 cells overexpressing RAGE transfected with siRNA control (20 nM) and siRNA targeting CTGF (20 nM) and stimulated for 10 days with 100 ng/ml rhS100A8/A9. H CTGF knockdown efficiency is shown. Error bars represent mean ± SD. * p-value < 0.05 indicates. Results shown are representative of three independent experiments performed in triplicate
Fig. 8
Fig. 8
S100A8/A9-RAGE system increases the migration of TNBC cells. A-B Representative images (left) and relative quantification (right) of transwell migration in MDA-MB231 cells overexpressing RAGE and treated for 4 hours with 100 ng/ml rhS100A8/A9 alone or in combination with 1 μM RAGE antagonist FPS-ZM1. C-D Representative images (left) and relative quantification (right) of transwell migration in MDA-MB231 cells overexpressing RAGE and treated for 4 hours with 100 ng/ml rhS100A8/A9 alone or in combination with 1 μM FAK inhibitor VS-4718. E-F Representative images (left) and relative quantification (right) of transwell migration in BT-549 cells overexpressing RAGE and treated for 4 hours with 100 ng/ml rhS100A8/A9 alone or in combination with 1 μM RAGE antagonist FPS-ZM1. G-H Representative images (left) and relative quantification (right) of transwell migration in BT-549 cells overexpressing RAGE and treated for 4 hours with 100 ng/ml rhS100A8/A9 alone or in combination with 1 μM FAK inhibitor VS-4718. I-J Representative images (left) and relative quantification (right) of transwell migration in BT-549 cells overexpressing RAGE transfected with siRNA control (20 nM) and siRNA targeting FLNA (20 nM) and stimulated for 4 hours with 100 ng/ml rhS100A8/A9. K FLNA knockdown efficiency is shown. Error bars represent mean ± SD. * indicates p-value < 0.05. Results shown are representative of three independent experiments performed in triplicate
Fig. 9
Fig. 9
S100A8/A9-RAGE-FAK-YAP signaling in TNBC cells. A Cartoon depicting the proposed S100A8/A9-RAGE-FAK-YAP transduction network in TNBC cells. Targeting RAGE along with FAK/YAP-dependent transcriptional programs may disable the growth and migration of TNBC cells

Similar articles

Cited by

References

    1. Siegel RL, Miller KD, Fuchs HE, Jemal A. Cancer statistics, 2022. CA Cancer J Clin. 2022;72(1):7–33. doi: 10.3322/caac.21708. - DOI - PubMed
    1. Tyanova S, Albrechtsen R, Kronqvist P, Cox J, Mann M, Geiger T. Proteomic maps of breast cancer subtypes. Nat Commun. 2016;7:10259. doi: 10.1038/ncomms10259. - DOI - PMC - PubMed
    1. Bianchini G, De Angelis C, Licata L, Gianni L. Treatment landscape of triple-negative breast cancer - expanded options, evolving needs. Nat Rev Clin Oncol. 2022;19(2):91–113. doi: 10.1038/s41571-021-00565-2. - DOI - PubMed
    1. Schmid P, Cortes J, Dent R, Pusztai L, McArthur H, Kümmel S, et al. Event-free Survival with Pembrolizumab in Early Triple-Negative Breast Cancer. N Engl J Med. 2022;386(6):556–567. doi: 10.1056/NEJMoa2112651. - DOI - PubMed
    1. Mittendorf EA, Zhang H, Barrios CH, Saji S, Jung KH, Hegget R, et al. Neoadjuvant atezolizumab in combination with sequential nab-paclitaxel and anthracycline-based chemotherapy versus placebo and chemotherapy in patients with early-stage triple-negative breast cancer (IMpassion031): a randomised, double-blind, phase 3 trial. Lancet. 2020;396(10257):1090–1100. doi: 10.1016/S0140-6736(20)31953-X. - DOI - PubMed

Publication types

Substances