. 2022 May 17:10:914193.
doi: 10.3389/fpubh.2022.914193. eCollection 2022.

m6A Regulator-Mediated Methylation Modification Patterns and Characteristics in COVID-19 Patients

Affiliations

m6A Regulator-Mediated Methylation Modification Patterns and Characteristics in COVID-19 Patients

Xin Qing et al. Front Public Health. .

Abstract

Background: RNA N6-methyladenosine (m6A) regulators may be necessary for diverse viral infectious diseases, and serve pivotal roles in various physiological functions. However, the potential roles of m6A regulators in coronavirus disease 2019 (COVID-19) remain unclear.

Methods: The gene expression profile of patients with or without COVID-19 was acquired from Gene Expression Omnibus (GEO) database, and bioinformatics analysis of differentially expressed genes was conducted. Random forest modal and nomogram were established to predict the occurrence of COVID-19. Afterward, the consensus clustering method was utilized to establish two different m6A subtypes, and associations between subtypes and immunity were explored.

Results: Based on the transcriptional data from GSE157103, we observed that the m6A modification level was markedly enriched in the COVID-19 patients than those in the non-COVID-19 patients. And 18 essential m6A regulators were identified with differential analysis between patients with or without COVID-19. The random forest model was utilized to determine 8 optimal m6A regulators for predicting the emergence of COVID-19. We then established a nomogram based on these regulators, and its predictive reliability was validated by decision curve analysis. The consensus clustering algorithm was conducted to categorize COVID-19 patients into two m6A subtypes from the identified m6A regulators. The patients in cluster A were correlated with activated T-cell functions and may have a superior prognosis.

Conclusions: Collectively, m6A regulators may be involved in the prevalence of COVID-19 patients. Our exploration of m6A subtypes may benefit the development of subsequent treatment modalities for COVID-19.

Keywords: COVID-19; consensus clustering; diagnostic biomarkers; m6A methylation modification; m6A regulators.


Conflict of interest statement

The authors declare that the research was conducted in the absence of any commercial or financial relationships that could be construed as a potential conflict of interest.

Figures
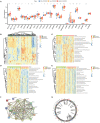
Figure 1
Figure 1
Landscape of the 26 m6A regulators in COVID-19. (A) Differential expression analysis of the 26 m6A regulators identified between samples with different COVID-19 status. (B) Expression heat map of the 26 m6A regulators in samples. (C) GSVA enrichment analysis between Non-COVID-19 and Non-ICU-COVID-19 samples. (D) GSVA enrichment analysis between Non-COVID-19 and ICU-COVID-19 samples. (E) GSVA enrichment analysis between Non-ICU-COVID-19 and ICU-COVID-19 samples. (F) The PPI network analysis among the differentially expressed genes. (G) Chromosomal positions of the 26 m6A regulators. *p < 0.05, **p < 0.01, and ***p < 0.001.
Figure 2
Figure 2
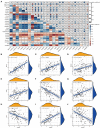
Correlation between m6A regulators in COVID-19. (A) Correlation plot of 26 m6A regulators. (B–J) Correlation between writers and erasers in COVID-19. Writer genes: METTL3, METTL14, METTL16, RBM15B, VIRMA, CBLL1, and ZC3H1; eraser genes: ALKBH5 and FTO. *p < 0.05, **p < 0.01, and ***p < 0.001.
Figure 3
Figure 3
Establishment of RF model and SVM model. (A) Reverse cumulative distribution of residual was displayed to demonstrate the residual distribution of RF and SVM model. (B) Boxplots of residual was displayed to demonstrate the residual distribution of RF and SVM model. (C) The influence of the number of decision trees on the error rate. (D) The importance of the 26 m6A regulators based on the RF model. (E) ROC curves revealed the accuracy of the RF and SVM model.
Figure 4
Figure 4
Establishment of the nomogram model. (A) Establishment of the nomogram model based on the 8 selected m6A regulators. (B) Predictive robustness of the nomogram model as disclosed by the calibration curve. (C) Decisions based on the nomogram model may benefit COVID-19 patients. (D) Clinical impact of the nomogram model as evaluated by the clinical impact curve.
Figure 5
Figure 5
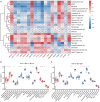
Consensus clustering of the 18 significant m6A regulators in COVID-19. (A) Consensus matrices of the 18 significant m6A regulators for k = 2. (B) Differential expression analysis of the 18 significant m6A regulators in cluster A and cluster B. (C) Expression heatmap of the 18 significant m6A regulators in cluster A and cluster B. (D) PCA for the expression data of the 18 significant m6A regulators that indicates an obvious difference in transcriptomes between the two m6A subtypes. (E) GO analysis that investigates the potential mechanism underlying the effect of the 139 m6A-related DEGs on the occurrence and development of COVID-19. *p < 0.05, **p < 0.01, and ***p < 0.001.
Figure 6
Figure 6
Single sample gene set enrichment analysis. (A) Correlation between infiltrating immune cells and the 18 significant m6A regulators. (B) Difference in the abundance of infiltrating immune cells between high and low METTL3 expression groups. (C) Differential immune cell infiltration between cluster A and cluster B. *p < 0.05, **p < 0.01, and ***p < 0.001.
Figure 7
Figure 7
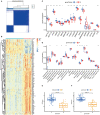
Consensus clustering of the 139 m6A-related DEGs in COVID-19. (A) Consensus matrices of the 139 m6A-related DEGs for k = 2. (B) Expression heat map of the 139 m6A-related DEGs in gene cluster A and gene cluster B. (C) Differential expression of the 18 significant m6A regulators in gene cluster A and gene cluster B. (D) Differential immune cell infiltration between gene cluster A and gene cluster B. (E) Differences in m6A score between cluster A and cluster B. (F) Differences in m6A score between gene cluster A and gene cluster B. *p < 0.05, **p < 0.01, and ***p < 0.001.
Figure 8
Figure 8
Role of m6A subtypes in distinguishing COVID-19. (A) Sankey diagram demonstrating the relationship between m6A subtypes, m6A gene subtypes, and m6A scores. (B) Differential expression levels of cytokines between cluster A and cluster B. (C) Differential expression levels of cytokines between gene cluster A and gene cluster B. *p < 0.05, **p < 0.01, and ***p < 0.001.

References

    1. Zhong P, Xu J, Yang D, Shen Y, Wang L, Feng Y, et al. . COVID-19-associated gastrointestinal and liver injury: clinical features and potential mechanisms. Signal Transduct Target Ther. (2020) 5:256. 10.1038/s41392-020-00373-7 - DOI - PMC - PubMed
    1. Di Maria E, Latini A, Borgiani P, Novelli G. Genetic variants of the human host influencing the coronavirus-associated phenotypes (SARS, MERS and COVID-19): rapid systematic review and field synopsis. Hum Genomics. (2020) 14:30. 10.1186/s40246-020-00280-6 - DOI - PMC - PubMed
    1. Rawat K, Kumari P, Saha L. COVID-19 vaccine: a recent update in pipeline vaccines, their design and development strategies. Eur J Pharmacol. (2021) 892:173751. 10.1016/j.ejphar.2020.173751 - DOI - PMC - PubMed
    1. Wang H, Li X, Li T, Zhang S, Wang L, Wu X, et al. . The genetic sequence, origin, and diagnosis of SARS-CoV-2. Eur J Clin Microbiol Infect Dis. (2020) 39:1629–35. 10.1007/s10096-020-03899-4 - DOI - PMC - PubMed
    1. Fricke-Galindo I, Falfan-Valencia R. Genetics insight for COVID-19 susceptibility and severity: a review. Front Immunol. (2021) 12:622176. 10.3389/fimmu.2021.622176 - DOI - PMC - PubMed

Publication types