. 2022 May 27:15:5253-5272.
doi: 10.2147/IJGM.S366335. eCollection 2022.

A Novel lncRNA Panel for Risk Stratification and Immune Landscape in Breast Cancer Patients

Affiliations

A Novel lncRNA Panel for Risk Stratification and Immune Landscape in Breast Cancer Patients

Chen Li et al. Int J Gen Med. .

Abstract

Purpose: In recent years, breast cancer (BC) has been a primary cause of mortality in women. However, the underlying mechanisms remain to be elucidated. Accumulating evidence has supported the hypothesis that long noncoding RNAs (lncRNAs) play central roles in the progression of cancer. We aimed to construct an immune-related lncRNA panel to predict the prognosis of patients with BC and evaluate the immune features.

Methods: The expression profiles of patients with BC were obtained from The Cancer Genome Atlas (TCGA) database to screen the differentially expressed lncRNAs (DELs). Pearson's correlation analysis was employed to filter the DELs related to the immune-associated genes. Univariate Cox regression, the LASSO algorithm, and multivariate Cox regression analyses were conducted to establish the model. Functional enrichment analyses and biological experiments were performed to explore the immune activity of the lncRNA panel.

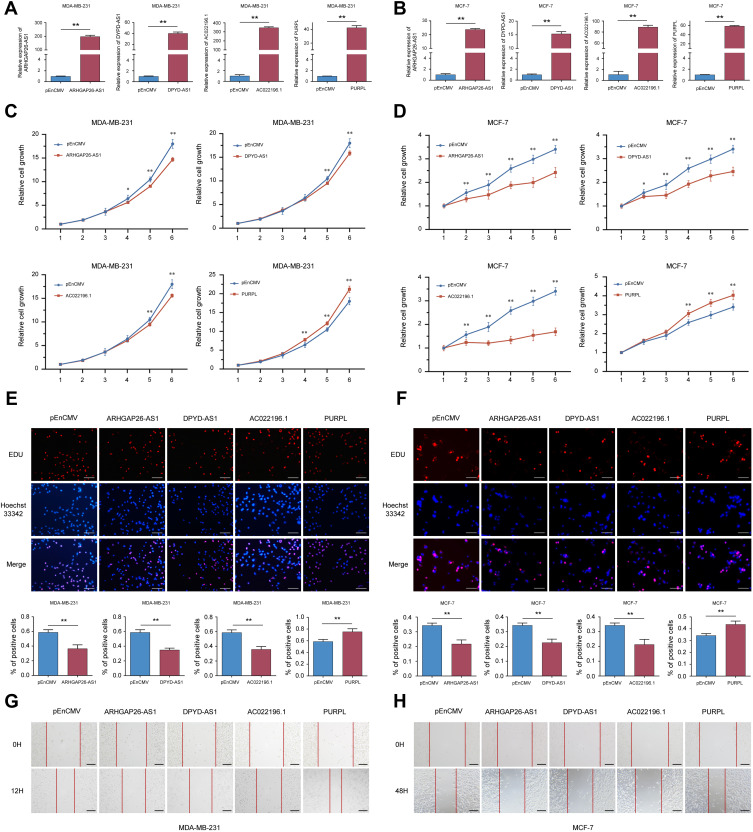
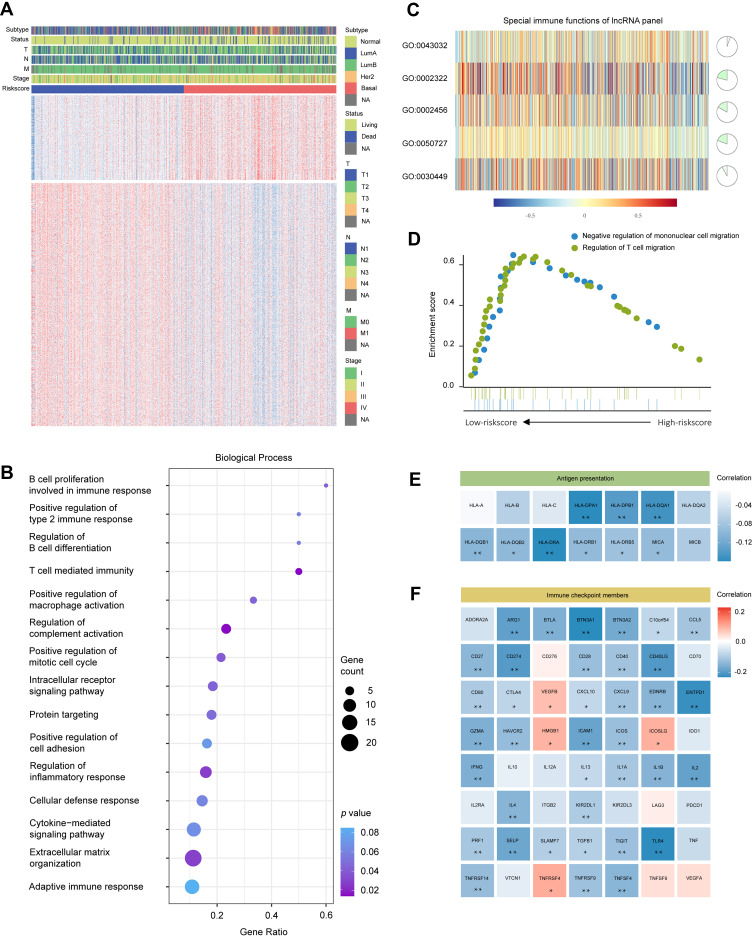
Results: A four-immune-related lncRNA panel (IRLP) composed of AC022196.1, ARHGAP26-AS1, DPYD-AS1 and PURPL was established in TCGA training cohort. The prognostic accuracy of the predictive model was confirmed in TCGA internal validation cohort, TCGA entire cohort and Qilu external validation cohort. Bioinformatics analyses indicated that the IRLP had a close relationship with tumour infiltrating immune cells and immunomodulatory biomarkers. The biological functions of the four immune-related lncRNAs in BC were first investigated in vitro and in vivo. PURPL was indicated to play a central role in the regulation of macrophage recruitment and polarization via CCL2.

Conclusion: Our study identified IRLP as a reliable prognostic indicator with great potential for clinical application in personalized immunotherapy.

Keywords: breast cancer; immune; lncRNA; prognosis; risk score.


Conflict of interest statement

The authors declare that there are no conflicts of interest.

Figures

Figure 1
Figure 1
Flow chart showing the design of the study.
Figure 2
Figure 2
Construction of the 4-immune-related lncRNA prognostic model. (A) Heatmap representing lncRNAs that were differentially expressed between breast cancer and normal breast tissues based on a microarray analysis. (B) Volcano plot presenting all differentially expressed lncRNAs; blue dots indicate downregulated lncRNAs, and red dots indicate upregulated lncRNAs. The X-axis represents the log2 fold change, and the Y-axis represents the log-transformed adjusted p values. (C) The coefficients of variables identified using the LASSO Cox regression model. (D) Ten-fold cross validation of the LASSO regression analysis. Left and right vertical dotted lines represent the “lambda. min” and “lambda.1se” criteria, respectively. The red dots indicate partial likelihood deviance values, and the gray lines indicate the corresponding standard error. (E) Forest plots showing the relationships of each lncRNA with OS in the training cohort. (F) Multivariate Cox regression results for the 4 immune-related prognostic lncRNAs in TCGA training cohort. (G) Coefficient distribution of the IRLP. Adj. p value, adjusted p value.
Figure 3
Figure 3
Evaluating the predictive power of the IRLP in TCGA cohort. (A) Kaplan–Meier plot of the high‐ and low‐risk groups in the training cohort. (B and C) Forest plot of univariate (B) and multivariate (C) Cox regression analyses of TCGA training cohort. (D) Kaplan–Meier plot of the high‐ and low‐risk groups in TCGA internal validation cohort. (E and F) Forest plot of univariate (E) and multivariate (F) Cox regression analyses of TCGA internal validation cohort. (G) Kaplan–Meier plot of the high‐ and low‐risk groups in the entire TCGA cohort. (H and I) Forest plot of univariate (E) and multivariate (F) Cox regression analyses in the entire TCGA cohort. (JL) ROC curve analysis of the risk score for predicting OS of TCGA training cohort, the internal validation cohort and the entire cohort. (M) Nomogram including the risk score and clinicopathological traits of the entire cohort. (N) Calibration plot.
Figure 4
Figure 4
Evaluating the predictive power of the IRLP in the Qilu external validation cohort. (A) Kaplan–Meier plot of the high‐ and low‐risk groups. (B) Time-dependent ROC curve analysis for predicting OS of the Qilu external validation cohort. (C and D) Forest plot of univariate (C) and multivariate (D) Cox regression analysis showed that the risk score was an independent risk factor compared with other clinical features in the Qilu external validation cohort. (E) nomogram including the risk score and clinicopathological traits of Qilu external validation cohort. (F) Calibration plot.
Figure 5
Figure 5
Gain-of-function assay of selected immune-related lncRNAs in MDA-MB-231 and MCF-7 cells. (A and B) The overexpression efficiency of selected lncRNAs. (C and D) Effects of selected lncRNAs on cell proliferation were evaluated using the MTT assay. (E and F) Effects of selected lncRNAs on cell proliferation were tested using the EdU assay. Scale bars: 100 μm. (G and H) Effects of selected lncRNAs on cell migration were verified by performing a scratch assay. Scale bars: 200 μm. *p < 0.05; **p < 0.01.
Figure 6
Figure 6
The relationship between the risk score and immune functions. (A) Heatmaps showing the genes with the strongest correlations with the risk score. (B) Biological processes of risk score-related genes. (C) The relationship between the IRLP and corresponding GO functions. (D) Gene set enrichment analysis. (E) The different expression levels of the genes associated with antigen presentation in the high- and low-risk score groups. (F) The different expression levels of immune checkpoint-related genes in high- and low-risk score groups. *p < 0.05; **p < 0.01.
Figure 7
Figure 7
The relationship between the risk score and infiltrated immune cell populations. (A) Immune cell clustering based on the gene expression profile in the entire TCGA cohort. (B) Cellular interaction of the TME cell types in the entire TCGA cohort. (C) The relationship between immune cell populations and the IRLP. (D) The relationship between the immune cell populations and four prognostic lncRNAs. (EH) The scatter plot shows the correlation of PURPL with the infiltration of immune cell subtypes. M2 macrophages (E), M1 macrophages (F), monocytes (G) and CD8+ T cells (H). *p < 0.05; **p < 0.01.
Figure 8
Figure 8
PURPL upregulation promotes the recruitment and M2 polarization of macrophages. (A) Schematic illustrating the coculture model of THP-1-derived macrophages with breast cancer cells. (B) The morphology of THP-1 cells and M0 macrophages. Scale bars: 50 μm. (C) qRT–PCR detection of ARG1 and iNOS expression in macrophages cocultured with MDA-MB-231 cells. (D) qRT–PCR detection of ARG1 and iNOS in macrophages cocultured with MCF-7 cells. (E) Schematic illustrating macrophage chemotaxis systems. (FI) PURPL-overexpressing MDA-MB-231 (F and G) and MCF-7 (H and I) cells promoted the migration of macrophages. Five random fields per chamber were observed to count cells at a magnification of 100×. Each assay was performed in triplicate. Scale bars: 200 μm. (J) A group of cytokines related to macrophage recruitment and polarization as evaluated using qRT–PCR after coculture with PURPL-overexpressing MDA-MB-231 cells. (K) A group of cytokines related to macrophage recruitment and polarization was evaluated using qRT–PCR after coculture with PURPL-overexpressing MCF-7 cells. (L) Subcutaneous tumours formed in nude mice after the injection of MDA-MB-231 cells as described previously (n = 5 mice/group). (M) Tumour weights were measured at the endpoint of the study. (N) Tumour growth curves were recorded every 3 days after subcutaneous injection in nude mice. (O) Representative tumour infiltration of F4/80+ macrophages, as determined using IHC. Scale bars: 100 μm. *p < 0.05; **p < 0.01.

References

    1. Sung H, Ferlay J, Siegel RL, et al. Global cancer statistics 2020: GLOBOCAN estimates of incidence and mortality worldwide for 36 cancers in 185 countries. CA Cancer J Clin. 2021;71(3):209–249. doi:10.3322/caac.21660 - DOI - PubMed
    1. Marin-Acevedo JA, Kimbrough EO, Lou Y. Next generation of immune checkpoint inhibitors and beyond. J Hematol Oncol. 2021;14(1):45. doi:10.1186/s13045-021-01056-8 - DOI - PMC - PubMed
    1. Gupta RG, Li F, Roszik J, Lizée G. Exploiting tumor neoantigens to target cancer evolution: current challenges and promising therapeutic approaches. Cancer Discov. 2021;11(5):1024–1039. doi:10.1158/2159-8290.CD-20-1575 - DOI - PMC - PubMed
    1. Hammerl D, Smid M, Timmermans AM, Sleijfer S, Martens JWM, Debets R. Breast cancer genomics and immuno-oncological markers to guide immune therapies. Semin Cancer Biol. 2018;52(Pt 2):178–188. doi:10.1016/j.semcancer.2017.11.003 - DOI - PubMed
    1. Khalil AM, Guttman M, Huarte M, et al. Many human large intergenic noncoding RNAs associate with chromatin-modifying complexes and affect gene expression. Proc Natl Acad Sci U S A. 2009;106(28):11667–11672. doi:10.1073/pnas.0904715106 - DOI - PMC - PubMed