

Deep learning radiomics for focal liver lesions diagnosis on long-range contrast-enhanced ultrasound and clinical factors
- PMID: 35655832
- PMCID: PMC9131334
- DOI: 10.21037/qims-21-1004
Deep learning radiomics for focal liver lesions diagnosis on long-range contrast-enhanced ultrasound and clinical factors
Abstract
Background: Routine clinical factors play an important role in the clinical diagnosis of focal liver lesions (FLLs); however, they are rarely used in computer-assisted diagnosis. Therefore, we developed a deep learning (DL) radiomics model, and investigated its effectiveness in diagnosing FLLs using long-range contrast-enhanced ultrasound (CEUS) cines and clinical factors.
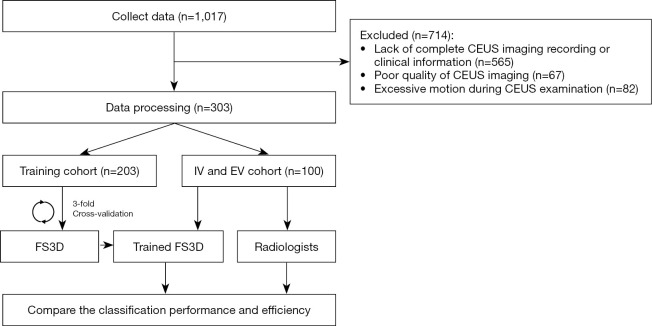
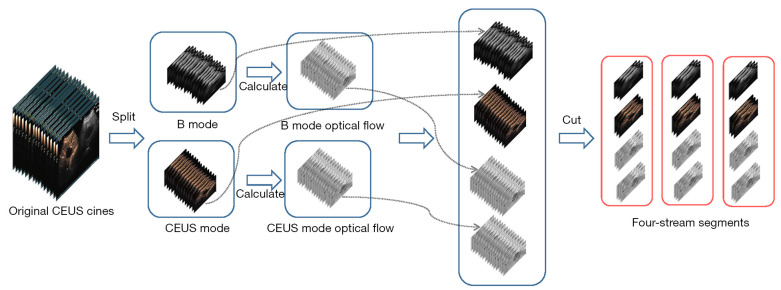
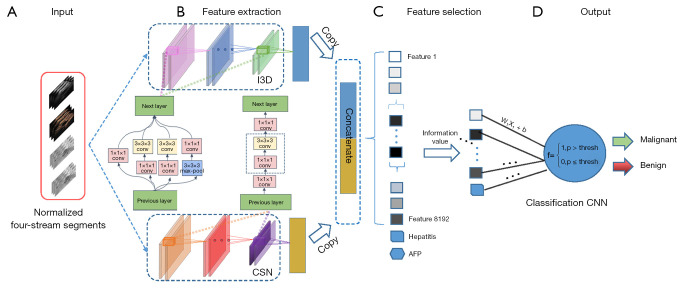
Methods: Herein, 303 patients with pathologically confirmed FLLs after surgery at three hospitals were retrospectively enrolled and divided into a training cohort (n=203), internal validation (IV) cohort (n=50) from one hospital with the ratio of 4:1, and external validation (EV) cohort (n=50) from the other two hospitals. Four DL radiomics models, namely Four Stream 3D convolutional neural network (FS3DU) (trained with CEUS cines only), FS3DU+A (trained with CEUS cines and alpha fetoprotein), FS3DU+H (trained with CEUS cines and hepatitis), and FS3DU+A+H (trained with CEUS cines, alpha fetoprotein, and hepatitis), were formed based on 3D convolutional neural networks (CNNs). They used approximately 20-s preoperative CEUS cines and/or clinical factors to extract spatiotemporal features for the classification of FLLs and the location of the region of interest. The area under curve of the receiver operating characteristic and diagnosis speed were calculated to evaluate the models in the IV and EV cohorts, and they were compared with those of two radiologists. Two-sided Delong tests were used to calculate the statistical differences between the models and radiologists.
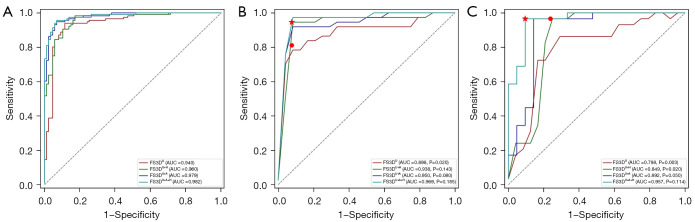
Results: FS3DU+A+H, which incorporated CEUS cines, hepatitis, and alpha fetoprotein, achieved the highest area under curve of 0.969 (95% CI: 0.901-1.000) and 0.957 (95% CI: 0.894-1.000) among radiologists and other models in IV and EV cohorts, respectively. A significant difference was observed when comparing FS3DU and radiologist 2 (all P<0.05). The diagnosis speed of all the models was the same (10.76 s per patient), and it was two times faster than those of the radiologists (radiologist 1: 23.74 and 27.75 s; radiologist 2: 25.95 and 29.50 s in IV and EV cohorts, respectively).
Conclusions: The proposed DL radiomics demonstrated excellent performance on the benign and malignant diagnosis of FLLs by combining CEUS cines and clinical factors. It could help the individualized characterization of FLLs, and enhance the accuracy of diagnosis in the future.
Keywords: Deep learning (DL); contrast-enhanced ultrasound (CEUS); diagnosis; focal liver lesions (FLLs); radiomics.
2022 Quantitative Imaging in Medicine and Surgery. All rights reserved.
Conflict of interest statement
Conflicts of Interest: All authors have completed the ICMJE uniform disclosure form (available at https://qims.amegroups.com/article/view/10.21037/qims-21-1004/coif). MZ used to be an employee of CHISON Medical Technologies Co., LTD., and LL is a current employee of CHISON Medical Technologies Co., LTD. They provided technology support in this study. The other authors have no conflicts of interest to declare.
Figures

Similar articles
-
Accurate prediction of responses to transarterial chemoembolization for patients with hepatocellular carcinoma by using artificial intelligence in contrast-enhanced ultrasound.Eur Radiol. 2020 Apr;30(4):2365-2376. doi: 10.1007/s00330-019-06553-6. Epub 2020 Jan 3. Eur Radiol. 2020. PMID: 31900703
-
Improving B-mode ultrasound diagnostic performance for focal liver lesions using deep learning: A multicentre study.EBioMedicine. 2020 Jun;56:102777. doi: 10.1016/j.ebiom.2020.102777. Epub 2020 Apr 28. EBioMedicine. 2020. PMID: 32485640 Free PMC article.
-
A deep learning model with data integration of ultrasound contrast-enhanced micro-flow cines, B-mode images, and clinical parameters for diagnosing significant liver fibrosis in patients with chronic hepatitis B.Eur Radiol. 2023 Aug;33(8):5871-5881. doi: 10.1007/s00330-023-09436-z. Epub 2023 Feb 3. Eur Radiol. 2023. PMID: 36735040
-
The current status of contrast-enhanced ultrasound in China.J Med Ultrason (2001). 2010 Jul;37(3):97-106. doi: 10.1007/s10396-010-0264-9. Epub 2010 Apr 21. J Med Ultrason (2001). 2010. PMID: 27278008 Review.
-
Contrast-enhanced US for characterization of focal liver lesions: a comprehensive meta-analysis.Eur Radiol. 2018 May;28(5):2077-2088. doi: 10.1007/s00330-017-5152-x. Epub 2017 Nov 30. Eur Radiol. 2018. PMID: 29189932 Review.
Cited by
-
Advancements in Artificial Intelligence-Enhanced Imaging Diagnostics for the Management of Liver Disease-Applications and Challenges in Personalized Care.Bioengineering (Basel). 2024 Dec 9;11(12):1243. doi: 10.3390/bioengineering11121243. Bioengineering (Basel). 2024. PMID: 39768061 Free PMC article. Review.
-
Diagnostic Performance of an Artificial Intelligence Model Based on Contrast-Enhanced Ultrasound in Patients with Liver Lesions: A Comparative Study with Clinicians.Diagnostics (Basel). 2023 Nov 5;13(21):3387. doi: 10.3390/diagnostics13213387. Diagnostics (Basel). 2023. PMID: 37958282 Free PMC article.
-
Predicting the Efficacy of Neoadjuvant Chemotherapy for Pancreatic Cancer Using Deep Learning of Contrast-Enhanced Ultrasound Videos.Diagnostics (Basel). 2023 Jun 27;13(13):2183. doi: 10.3390/diagnostics13132183. Diagnostics (Basel). 2023. PMID: 37443577 Free PMC article.
-
Enhancing ultrasonographic detection of hepatocellular carcinoma with artificial intelligence: current applications, challenges and future directions.BMJ Open Gastroenterol. 2025 Jul 1;12(1):e001832. doi: 10.1136/bmjgast-2025-001832. BMJ Open Gastroenterol. 2025. PMID: 40592728 Free PMC article. Review.
-
LI-RADS LR-5 on contrast-enhanced ultrasonography has satisfactory diagnostic specificity for hepatocellular carcinoma: a systematic review and meta-analysis.Quant Imaging Med Surg. 2023 Feb 1;13(2):957-969. doi: 10.21037/qims-22-591. Epub 2023 Jan 10. Quant Imaging Med Surg. 2023. PMID: 36819240 Free PMC article.
References
-
- National Health and Family Planning Commission of the People’s Republic of China . Diagnosis, management, and treatment of hepatocellular carcinoma (V2019). Chin J Pract Surg 2020;1:5-23.
LinkOut - more resources
Full Text Sources