Review
. 2022 Jun;12(6):3406-3435.
doi: 10.21037/qims-21-969.

Neuroimaging at 7 Tesla: a pictorial narrative review

Affiliations
Review

Neuroimaging at 7 Tesla: a pictorial narrative review

Tomohisa Okada et al. Quant Imaging Med Surg. 2022 Jun.

Abstract

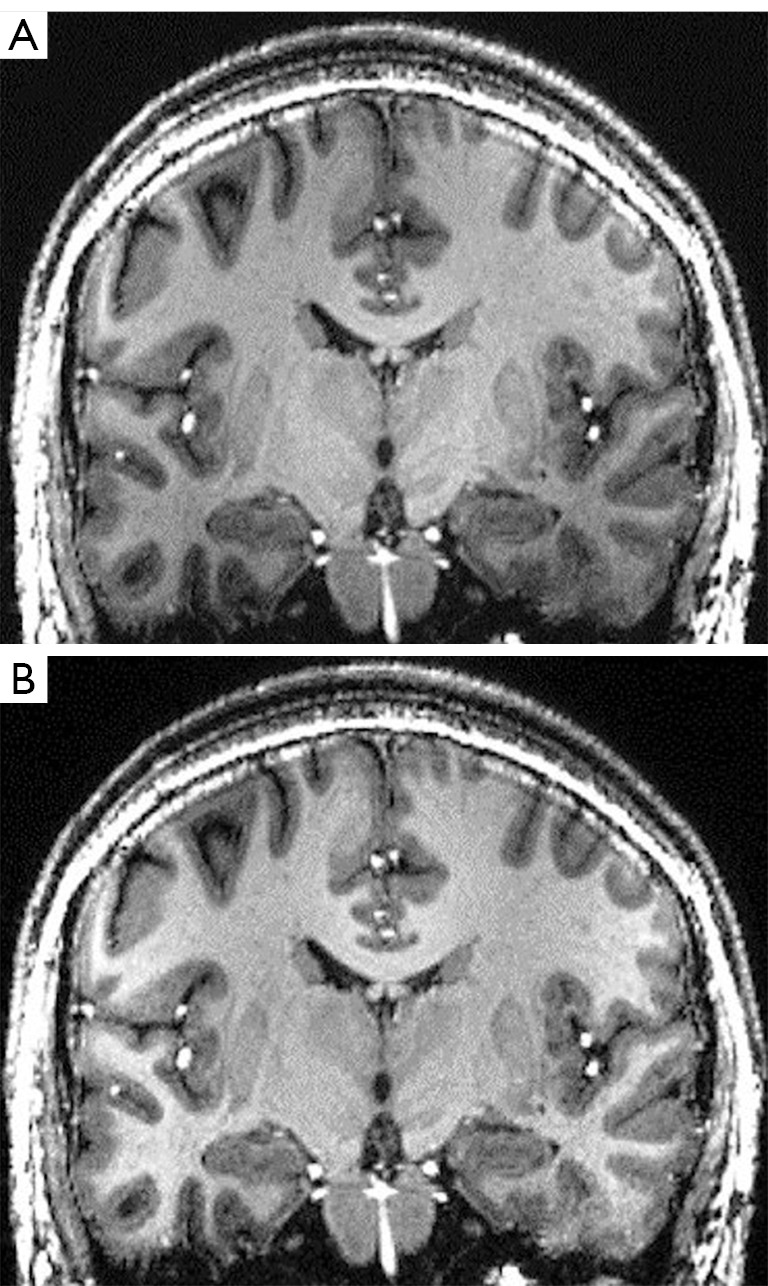
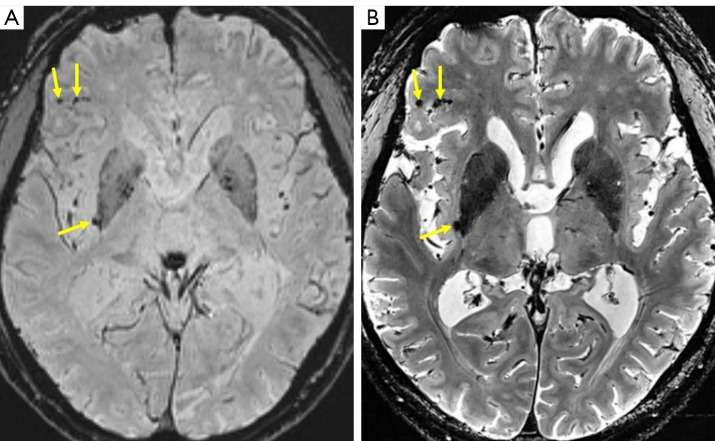
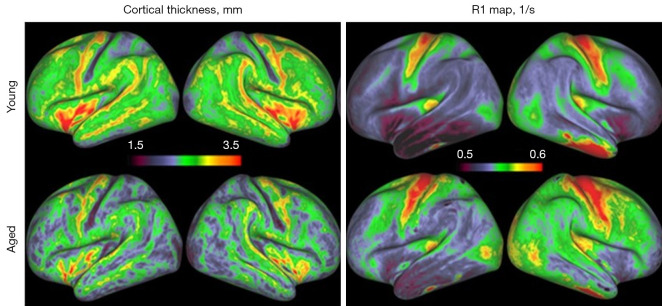
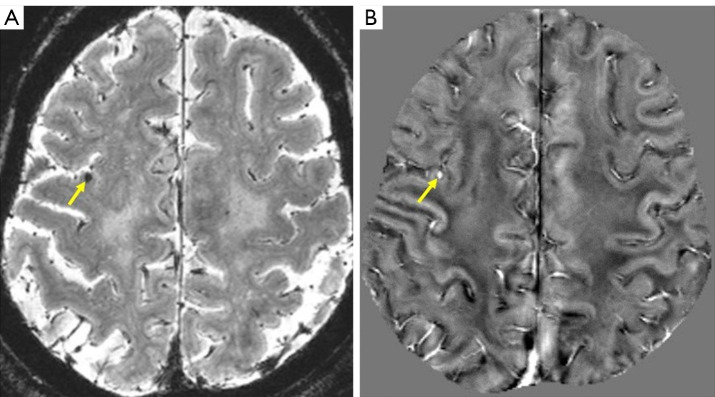
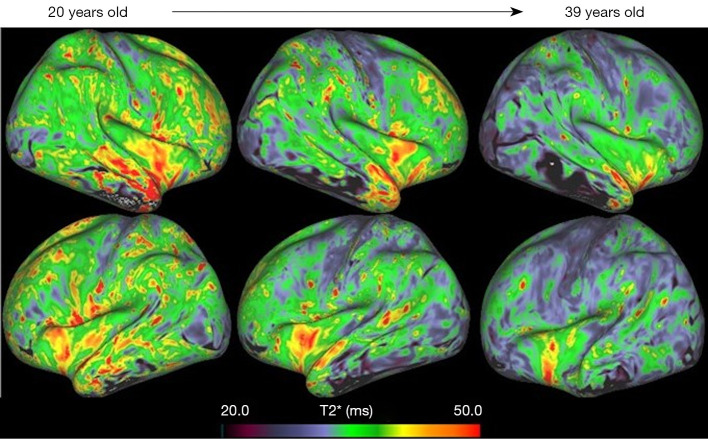
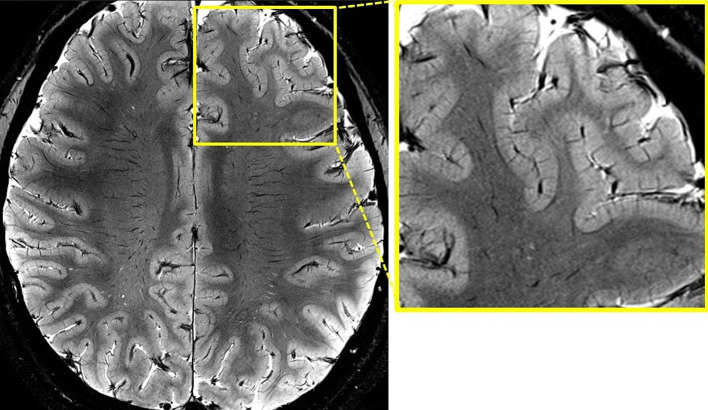
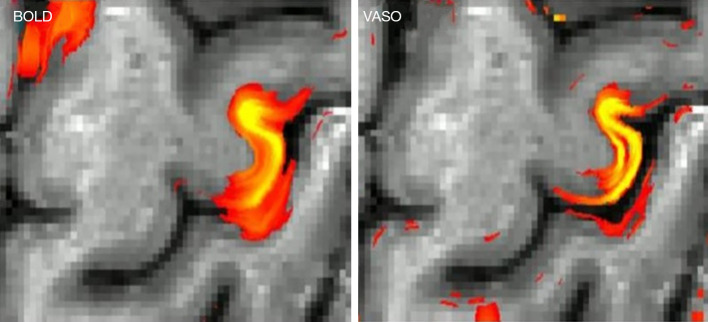
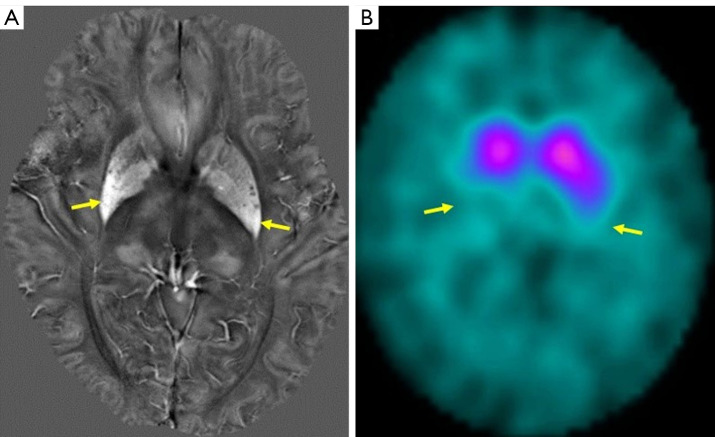
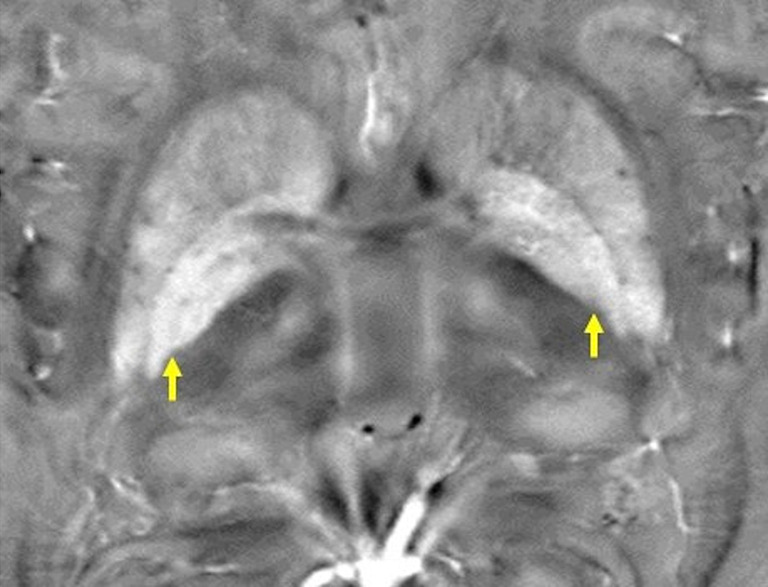
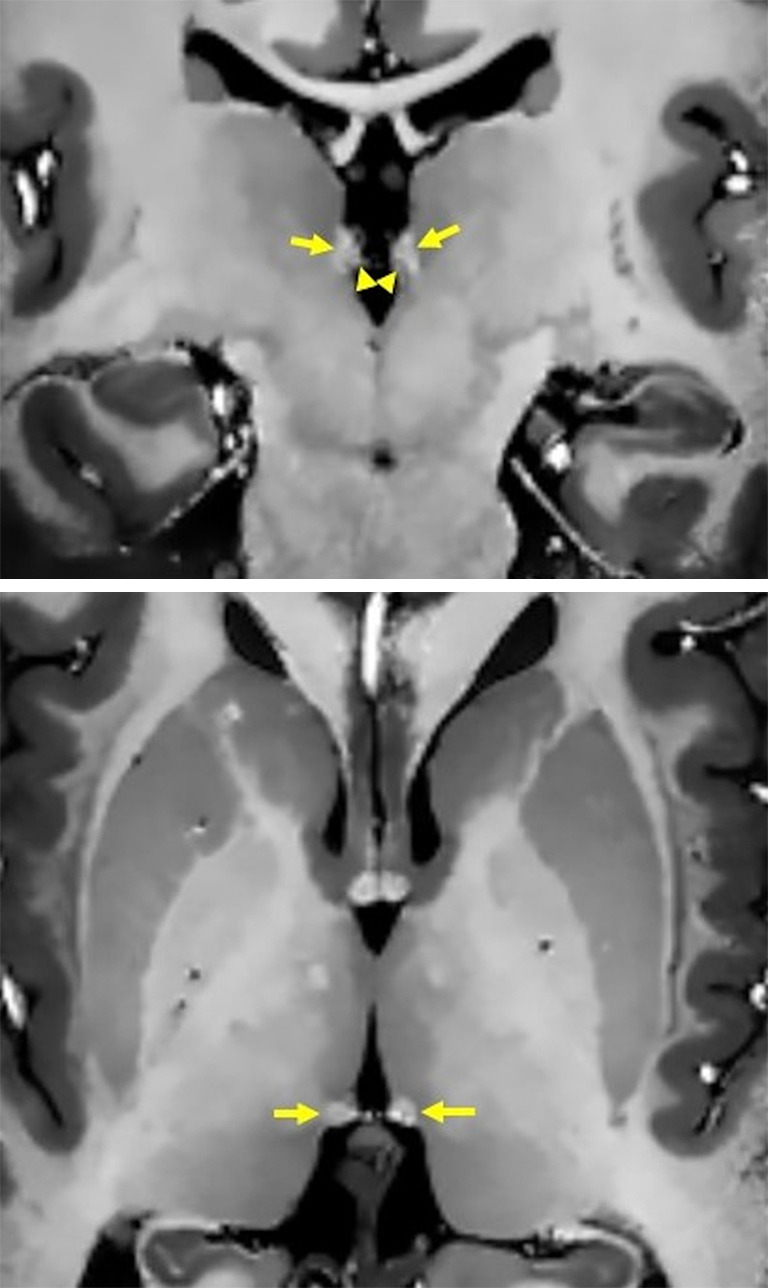
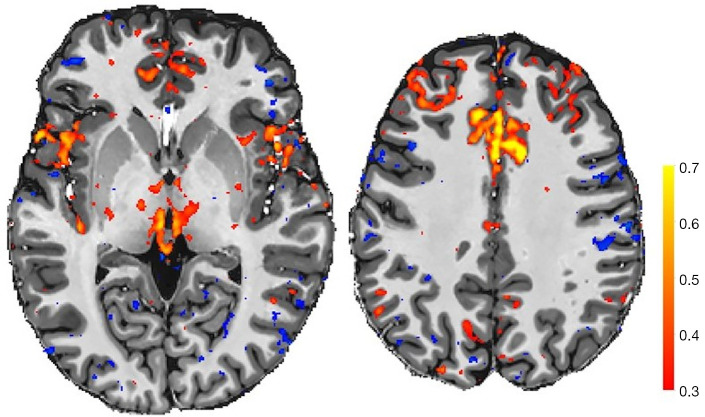
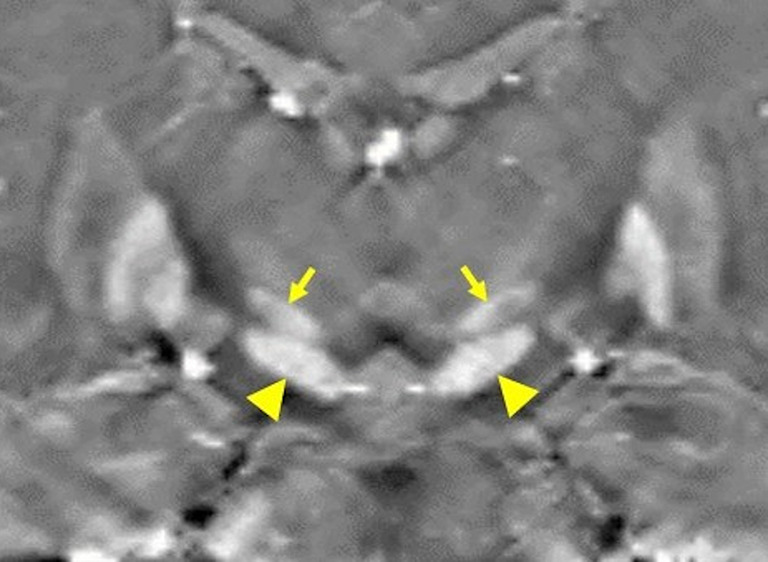
Neuroimaging using the 7-Tesla (7T) human magnetic resonance (MR) system is rapidly gaining popularity after being approved for clinical use in the European Union and the USA. This trend is the same for functional MR imaging (MRI). The primary advantages of 7T over lower magnetic fields are its higher signal-to-noise and contrast-to-noise ratios, which provide high-resolution acquisitions and better contrast, making it easier to detect lesions and structural changes in brain disorders. Another advantage is the capability to measure a greater number of neurochemicals by virtue of the increased spectral resolution. Many structural and functional studies using 7T have been conducted to visualize details in the white matter and layers of the cortex and hippocampus, the subnucleus or regions of the putamen, the globus pallidus, thalamus and substantia nigra, and in small structures, such as the subthalamic nucleus, habenula, perforating arteries, and the perivascular space, that are difficult to observe at lower magnetic field strengths. The target disorders for 7T neuroimaging range from tumoral diseases to vascular, neurodegenerative, and psychiatric disorders, including Alzheimer's disease, Parkinson's disease, multiple sclerosis, epilepsy, major depressive disorder, and schizophrenia. MR spectroscopy has also been used for research because of its increased chemical shift that separates overlapping peaks and resolves neurochemicals more effectively at 7T than a lower magnetic field. This paper presents a narrative review of these topics and an illustrative presentation of images obtained at 7T. We expect 7T neuroimaging to provide a new imaging biomarker of various brain disorders.

Keywords: 7 Tesla (7T); MP2RAGE; functional magnetic resonance imaging (fMRI); magnetic resonance spectroscopy (MRS); susceptibility.


Conflict of interest statement

Conflicts of Interest: All authors have completed the ICMJE uniform disclosure form (available at https://qims.amegroups.com/article/view/10.21037/qims-21-969/coif). TO receives a research grant from Siemens Healthcare K.K., Japan and the JSPS (21H03806). TO serves as an unpaid editorial board member for Quantitative Imaging in Medicine and Surgery. NS and TM receive grants from AMED (21dm0307003h0004 and 21dm0307102h0003, respectively). The other authors have no conflicts of interest to declare.

Figures

Figure 1
Figure 1
T1-weighted coronal MPRAGE images before (A) and after (B) signal inhomogeneity correction. Gradual signal decrease toward the skull base is corrected. MPRAGE, magnetization-prepared rapid gradient echo.
Figure 2
Figure 2
A patient with a traumatic brain injury. (A) SWI at 3T shows small hemorrhagic lesions as low-intensity spots (arrows), but their relation to the background structure is relatively obscured, and their locations in the cortex or sulci are ambiguous. (B) T2*WI at 7T enables easy detection of small hemorrhagic spots (arrows), including their anatomical location. SWI, susceptibility-weighted imaging; T2*WI, T2*-weighted imaging; 3T, 3 Tesla; 7T, 7 Tesla.
Figure 3
Figure 3
Age-related changes in cortical thickness (mm) and R1 values (1/s) measured using MP2RAGE with 0.7-mm isotropic resolution. Surface maps show the average of 22 young (20–30 years old) and 8 aged (>60 years old) subjects. Decreases in cortical thickness and increases in R1 values are observed by aging. MP2RAGE, magnetization-prepared 2 rapid gradient echoes.
Figure 4
Figure 4
Visualization of a small hemorrhagic lesion. (A) 3D T2*WI shows a small cortical hemorrhage as a low signal intensity spot (arrow). (B) QSM shows a more localized spot (arrow) with high susceptibility by localizing the susceptibility field dipole. 3D, 3-dimensional; QSM, quantitative susceptibility mapping; T2*WI, T2*-weighted imaging.
Figure 5
Figure 5
Age-related decreases in cortical T2* values (ms) of healthy participants from 20 to 39 years old. Regional differences are also visualized well.
Figure 6
Figure 6
High-resolution 2D T2*WI (0.4 mm × 0.4 mm × 1 mm) shows numerous transcortical venules in addition to the medullary veins and small perivascular spaces. The inset shows an enlarged part of the frontal lobe in greater detail. 2D, 2-dimensional; T2*WI, T2*-weighted imaging.
Figure 7
Figure 7
Cortical activation during a right-hand clenching task. BOLD activation is centered at the cortical surface of the left hand-knob area and extends to the postcentral gyrus over the central sulcus. VASO can detect separate activations in the superficial and deep cortical layers of the precentral gyrus and the postcentral gyrus. BOLD, blood-oxygen level-dependent; VASO, vascular space occupancy.
Figure 8
Figure 8
A patient with MSA-P. (A) QSM at 7T shows increased susceptibility at the dorsolateral part of the putamen, particularly on the right side (arrows). (B) Dopamine transporter SPECT imaging shows a reduced specific binding ratio more prominently on the right, indicating a negative correlation between the 2 measurements (arrows). SPECT, single-photon emission computed tomography; QSM, quantitative susceptibility mapping; MSA-P, multiple system atrophy-parkinsonian type; 7T, 7 Tesla.
Figure 9
Figure 9
An axial QSM image of a healthy subject at the basal ganglia. The globus pallidus interna is separated from the externa by the medial medullary lamina (arrows), which is visualized as a thin layer of low signal intensity. Differences in susceptibility can also be observed among the thalamic subnuclei. QSM, quantitative susceptibility mapping.
Figure 10
Figure 10
High-resolution T1WI (0.5 mm isotropic resolution) of the habenula (arrows) acquired using MP2RAGE after denoising (top: coronal, bottom: axial). On the coronal image, the lateral nucleus shows a slightly higher signal reflecting a shorter T1 value than that of the medial nucleus (arrowheads). T1WI, T1-weighted imaging; MP2RAGE, magnetization-prepared 2 rapid gradient echoes.
Figure 11
Figure 11
Connectivity between the habenula (seed) and other brain regions, including the anterior cingulate cortex, can be detected using high-resolution functional MRI (1.6 mm isotropic resolution). The color bar shows the correlation coefficients of the time-course signal. MRI, magnetic resonance imaging.
Figure 12
Figure 12
A coronal QSM image of the midbrain (0.5 mm isotropic resolution). The subthalamic nucleus (arrows) can be easily separated from the substantia nigra (arrowheads). QSM, quantitative susceptibility mapping.
Figure 13
Figure 13
T2*WI at 7T (0.4 mm × 0.4 mm × 1 mm) enables clear visualization of the nigrosome-1 (arrows) in a healthy subject. T2*WI, T2*-weighted imaging.
Figure 14
Figure 14
Coronal maximum intensity projection MR angiography of a patient with Moyamoya disease. The 0.25-mm isotropic resolution was acquired in 6 min. Dilated lenticulostriate arteries for collateral circulation are fewer on the right side (indicated as R), and the distal part of the middle cerebral artery is hypovisualized on the same side. MR, magnetic resonance.
Figure 15
Figure 15
The same patient as in Figure 12. FLAIR images acquired at 3T (A) and 7T (B). Both images show similar white-matter lesions as hyperintense, but “ivy-signs”, representing slow collateral flow, are better depicted at 7T (arrows). (C) CBF measured using iodine-123 N-isopropyl-p-iodoamphetamine SPECT at rest. CBF is widely lower on the right frontal area. (D) QSM acquired at 7T (0.5 mm isotropic resolution) shows increased susceptibility at the cortex, medullary veins, and ischemic lesions in the same area. The right side of the images shows the left side of the patient. CBF, cerebral blood flow; FLAIR, fluid-attenuated inversion recovery; 3T, 3 Tesla; 7T, 7 Tesla; SPECT, single-photon emission computed tomography; QSM, quantitative susceptibility mapping.
Figure 16
Figure 16
Dynamic glutamate changes during conditions of rest and the right finger tapping (each for 2.5 min) observed in the left motor cortex using 7T. Glutamate increases were observed during tapping (yellow boxes). 7T, 7 Tesla.
Figure 17
Figure 17
Images at 50-µm isotropic resolution of a mouse brain ex vivo in coronal (A) and axial (B) orientations acquired using an unwired small-sized volume coil inserted into a knee coil.

Similar articles

Cited by

References

    1. Balchandani P, Naidich TP. Ultra-High-Field MR Neuroimaging. AJNR Am J Neuroradiol 2015;36:1204-15. 10.3174/ajnr.A4180 - DOI - PMC - PubMed
    1. Düzel E, Costagli M, Donatelli G, Speck O, Cosottini M. Studying Alzheimer disease, Parkinson disease, and amyotrophic lateral sclerosis with 7-T magnetic resonance. Eur Radiol Exp 2021;5:36. 10.1186/s41747-021-00221-5 - DOI - PMC - PubMed
    1. Shlobin NA, Singh G, Newton CR, Sander JW. Classifying epilepsy pragmatically: Past, present, and future. J Neurol Sci 2021;427:117515. 10.1016/j.jns.2021.117515 - DOI - PMC - PubMed
    1. Wei RL, Wei XT. Advanced Diagnosis of Glioma by Using Emerging Magnetic Resonance Sequences. Front Oncol 2021;11:694498. 10.3389/fonc.2021.694498 - DOI - PMC - PubMed
    1. Bae YJ, Kim JM, Sohn CH, Choi JH, Choi BS, Song YS, Nam Y, Cho SJ, Jeon B, Kim JH. Imaging the Substantia Nigra in Parkinson Disease and Other Parkinsonian Syndromes. Radiology 2021;300:260-78. 10.1148/radiol.2021203341 - DOI - PubMed