. 2022 May 17:12:838405.
doi: 10.3389/fcimb.2022.838405. eCollection 2022.

A Deep Look at the Vaginal Environment During Pregnancy and Puerperium

Affiliations

A Deep Look at the Vaginal Environment During Pregnancy and Puerperium

Marco Severgnini et al. Front Cell Infect Microbiol. .

Abstract

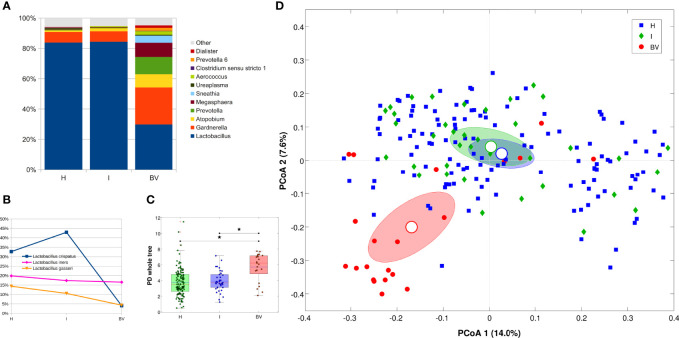
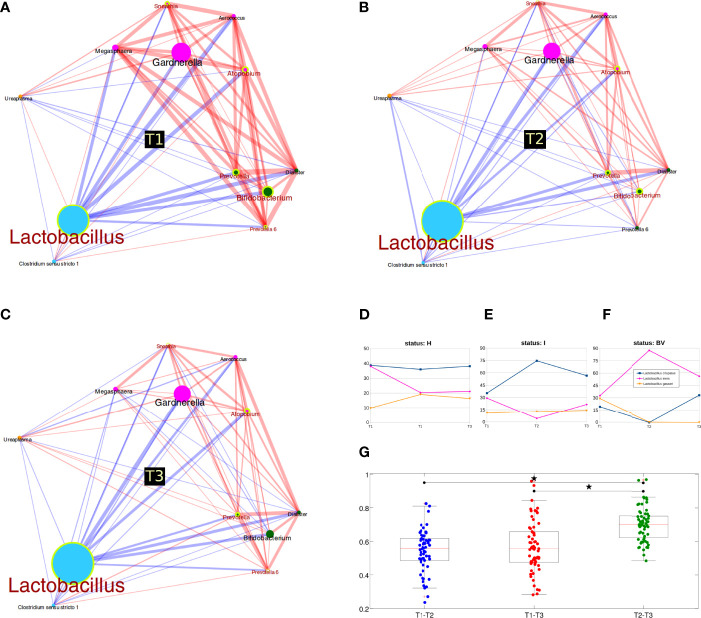
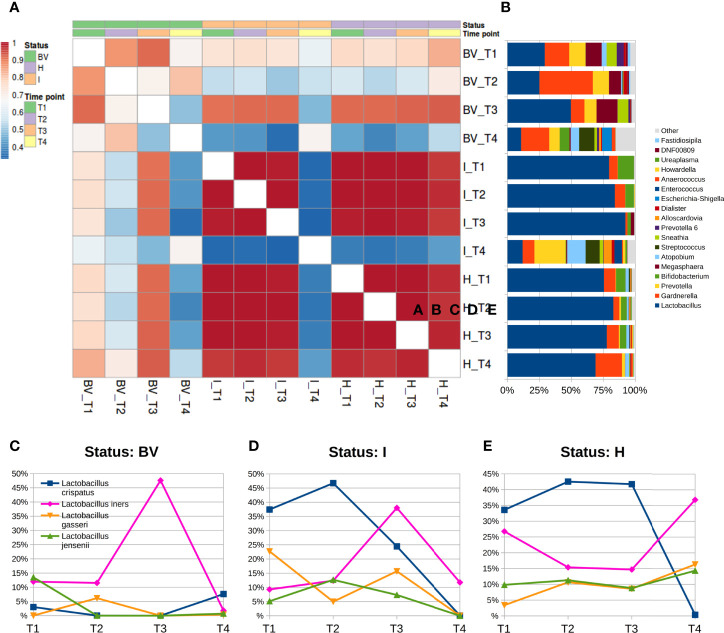
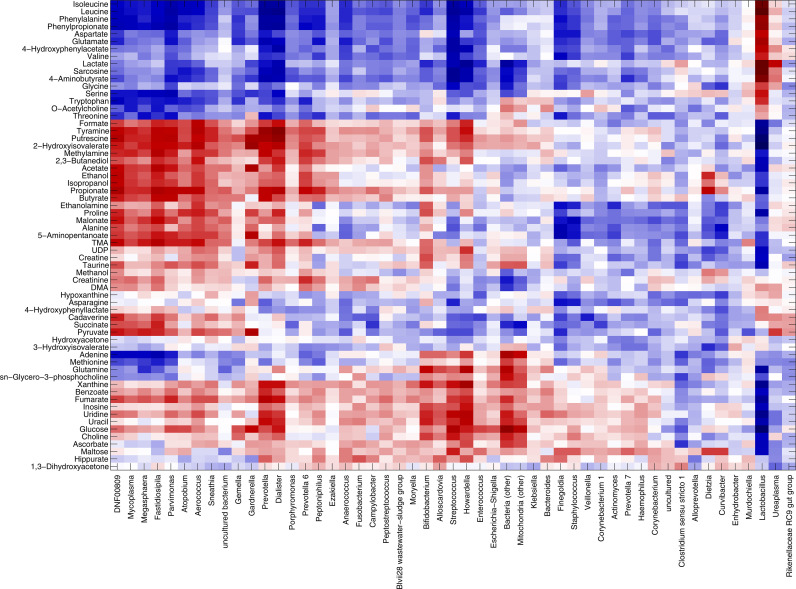
A deep comprehension of the vaginal ecosystem may hold promise for unraveling the pathophysiology of pregnancy and may provide novel biomarkers to identify subjects at risk of maternal-fetal complications. In this prospective study, we assessed the characteristics of the vaginal environment in a cohort of pregnant women throughout their different gestational ages and puerperium. Both the vaginal bacterial composition and the vaginal metabolic profiles were analyzed. A total of 63 Caucasian women with a successful pregnancy and 9 subjects who had a first trimester miscarriage were enrolled. For the study, obstetric examinations were scheduled along the three trimester phases (9-13, 20-24, 32-34 gestation weeks) and puerperium (40-55 days after delivery). Two vaginal swabs were collected at each time point, to assess the vaginal microbiome profiling (by Nugent score and 16S rRNA gene sequencing) and the vaginal metabolic composition (1H-NMR spectroscopy). During pregnancy, the vaginal microbiome underwent marked changes, with a significant decrease in overall diversity, and increased stability. Over time, we found a significant increase of Lactobacillus and a decrease of several genera related to bacterial vaginosis (BV), such as Prevotella, Atopobium and Sneathia. It is worth noting that the levels of Bifidobacterium spp. tended to decrease at the end of pregnancy. At the puerperium, a significantly lower content of Lactobacillus and higher levels of Gardnerella, Prevotella, Atopobium, and Streptococcus were observed. Women receiving an intrapartum antibiotic prophylaxis for Group B Streptococcus (GBS) were characterized by a vaginal abundance of Prevotella compared to untreated women. Analysis of bacterial relative abundances highlighted an increased abundance of Fusobacterium in women suffering a first trimester abortion, at all taxonomic levels. Lactobacillus abundance was strongly correlated with higher levels of lactate, sarcosine, and many amino acids (i.e., isoleucine, leucine, phenylalanine, valine, threonine, tryptophan). Conversely, BV-associated genera, such as Gardnerella, Atopobium, and Sneathia, were related to amines (e.g., putrescine, methylamine), formate, acetate, alcohols, and short-chain fatty-acids (i.e., butyrate, propionate).

Keywords: miscarriage; pregnancy; puerperium; vaginal metabolome; vaginal microbiome; women’s health.


Conflict of interest statement

The authors declare that the research was conducted in the absence of any commercial or financial relationships that could be construed as a potential conflict of interest.

Figures

Figure 1
Figure 1
Microbiota characterization according to the vaginal status (H, I or BV). (A) Barplot of average relative abundances at genus level. Genera with rel. ab. ≤1% were grouped in “Others” category; (B) Line plot of average Lactobacillus species abundance per vaginal status; only the 3 most abundant species are represented; (C) Boxplot of Faith’s phylogenetic diversity of the samples (estimated at endpoint) for each vaginal status. Stars above the plots represent statistical significance (p<0.05); (D) Principal Coordinate Analysis (PCoA) based on unweighted Unifrac distance among samples. Each point represents a sample; ellipses are 95% SEM-based confidence intervals; point and ellipses are grouped according to vaginal status; the first and the second coordinate are represented.
Figure 2
Figure 2
Microbiota evolution during three trimesters of pregnancy. (A–C) Co-abundance networks of bacterial genera over time. Circle size is proportional to genus relative abundance for each time and colors are according to co-abundance groups (see also Suppl_Figure3_heatmap_CAGnetwork); edge size is proportional to the strength of correlation; red lines mean positive correlation, while blue lines indicate negative correlation. Genera resulting statistically different over time points are highlighted with a yellow circle and a red label; (D–F) Lactobacillus species abundance over time, stratified for vaginal status. Only the three most abundant species are represented; (G) Boxplot of unweighted Unifrac distances between samples over time. Distances were calculated for each pair of samples belonging to the same women, sampled at T1, T2 or T3; stars above the plots represent statistical significance (p<0.05).
Figure 3
Figure 3
Microbiota evolution during puerperium (T4). (A) Heatmap of Pearson’s correlation coefficients calculated between average relative abundances at genus level over time and stratified for vaginal status; (B) barplots of average relative abundances at genus level over time and stratified for vaginal status; genera with rel. ab. ≤1% were grouped in “Others” category; (C–E) Line plots of average abundances of Lactobacillus species over time. Only the four most abundant species are represented.
Figure 4
Figure 4
Correlation between metabolome and microbiota. Heatmap showing the Spearman’s correlation coefficient between metabolites concentration and the relative abundances of the main bacterial genera over all samples collected, excluding miscarriages (n=219). Only groups present at >1% of relative abundance in at least one sample were considered. Metabolite and microbial data were clustered using Pearson’s correlation metric and average linkage.

Similar articles

Cited by

References

    1. Aagaard K., Riehle K., Ma J., Segata N., Mistretta T. A., Coarfa C., et al. . (2012). A Metagenomic Approach to Characterization of the Vaginal Microbiome Signature in Pregnancy. PLos One 7, e36466. doi: 10.1371/journal.pone.0036466 - DOI - PMC - PubMed
    1. Agarwal K., Robinson L. S., Aggarwal S., Foster L. R., Hernandez-Leyva A., Lin H., et al. . (2020). Glycan Cross-Feeding Supports Mutualism Between Fusobacterium and the Vaginal Microbiota. PLos Biol. 18, e3000788. doi: 10.1371/journal.pbio.3000788 - DOI - PMC - PubMed
    1. Al-Memar M., Bobdiwala S., Fourie H., Mannino R., Lee Y. S., Smith A., et al. . (2020). The Association Between Vaginal Bacterial Composition and Miscarriage: A Nested Case-Control Study. BJOG 127, 264–274. doi: 10.1111/1471-0528.15972 - DOI - PMC - PubMed
    1. Ansari A., Lee H., You Y. A., Jung Y., Park S., Kim S. M., et al. . (2020). Identification of Potential Biomarkers in the Cervicovaginal Fluid by Metabolic Profiling for Preterm Birth. Metabolites 10, 349. doi: 10.3390/metabo10090349 - DOI - PMC - PubMed
    1. Bozzi C. N., Baffoni L., Gaggìa F., Di Gioia D. (2018). Therapeutic Microbiology: The Role of Bifidobacterium Breve as Food Supplement for the Prevention/Treatment of Paediatric Diseases. Nutrients 10, e1723. doi: 10.3390/nu10111723 - DOI - PMC - PubMed

Publication types

Substances