. 2022 Jun 1;13(3):943-959.
doi: 10.14336/AD.2021.1029. eCollection 2022 Jun.

Blocking C3d+/GFAP+ A1 Astrocyte Conversion with Semaglutide Attenuates Blood-Brain Barrier Disruption in Mice after Ischemic Stroke

Affiliations

Blocking C3d+/GFAP+ A1 Astrocyte Conversion with Semaglutide Attenuates Blood-Brain Barrier Disruption in Mice after Ischemic Stroke

Qi Zhang et al. Aging Dis. .

Abstract

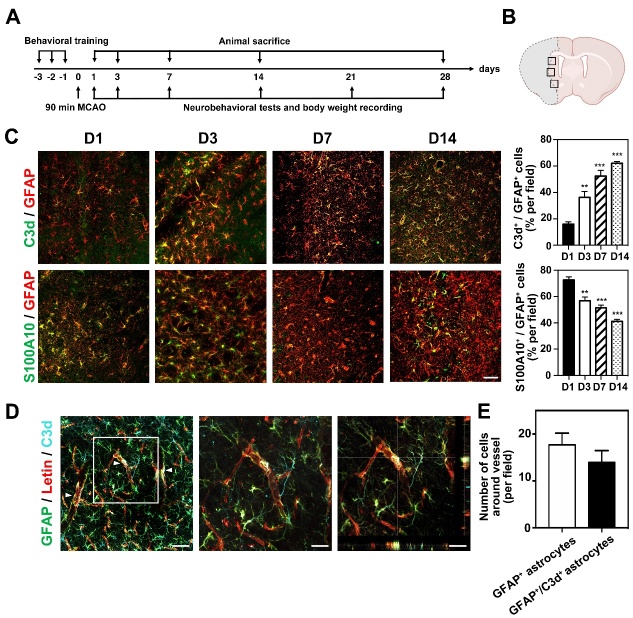
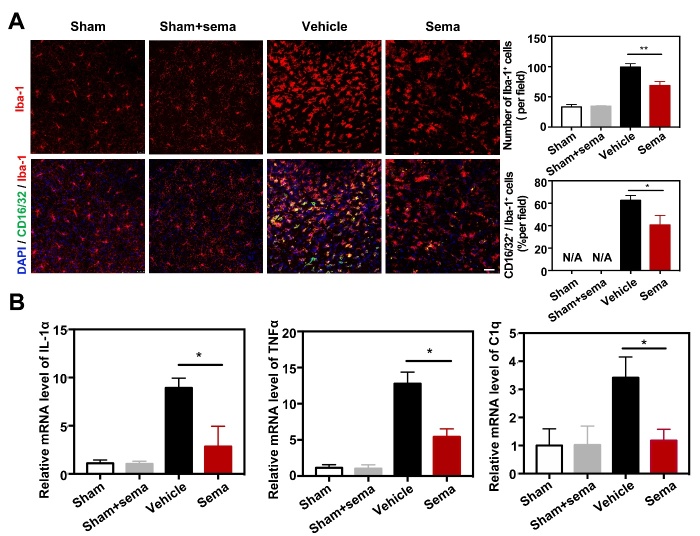
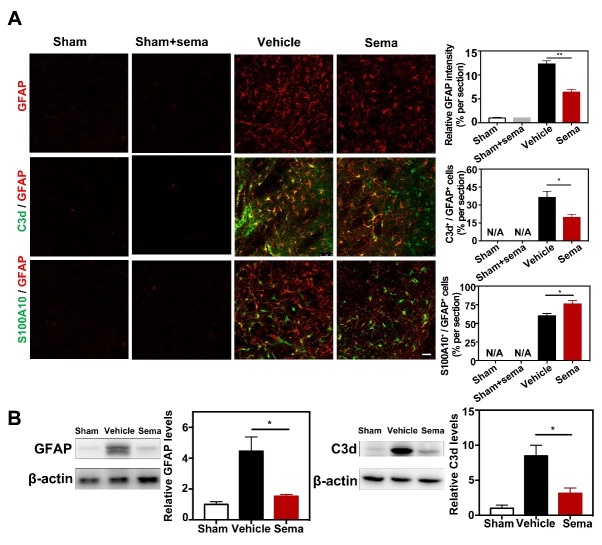
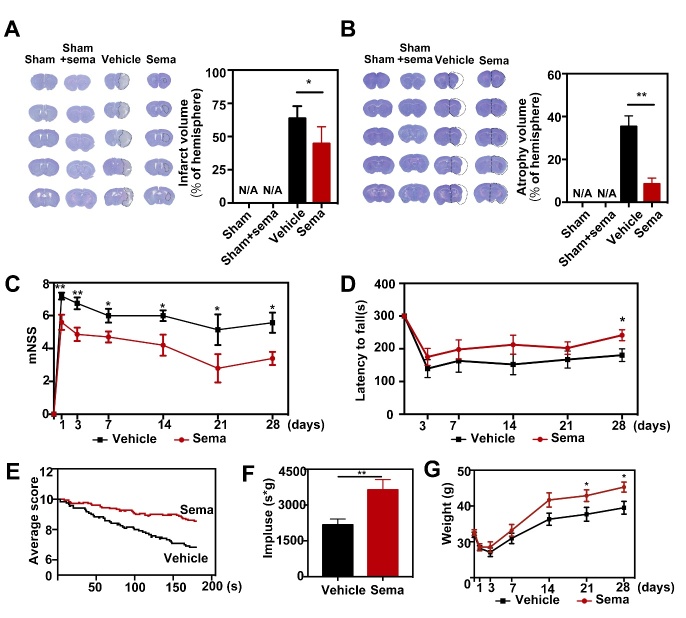
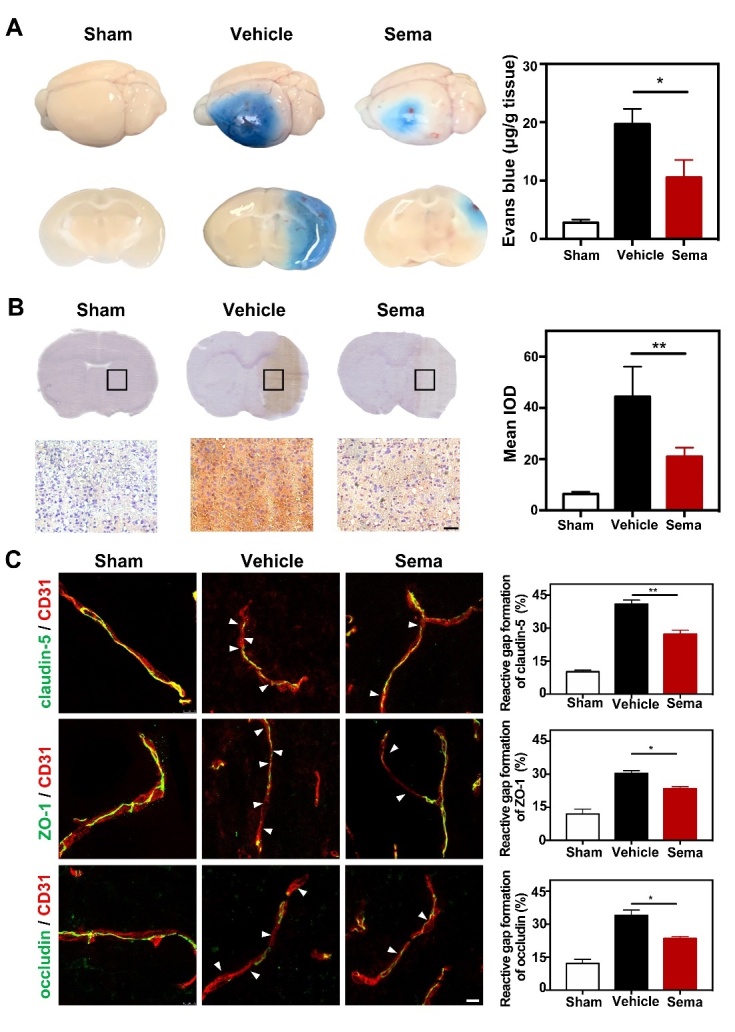
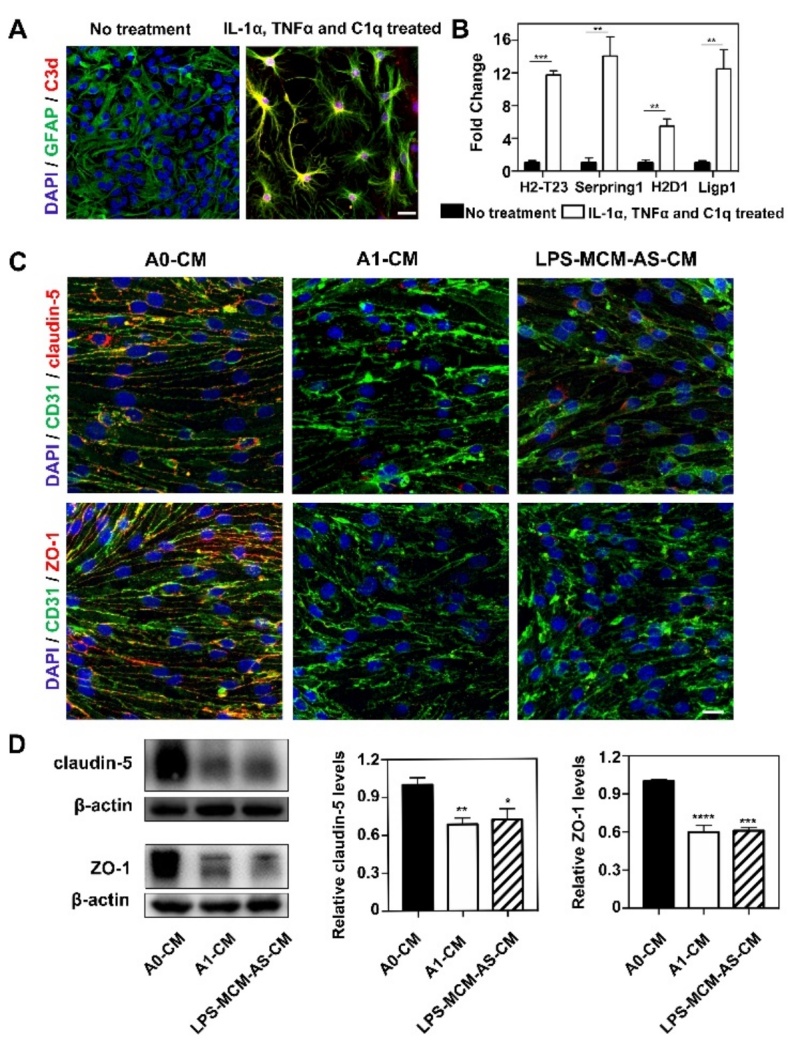
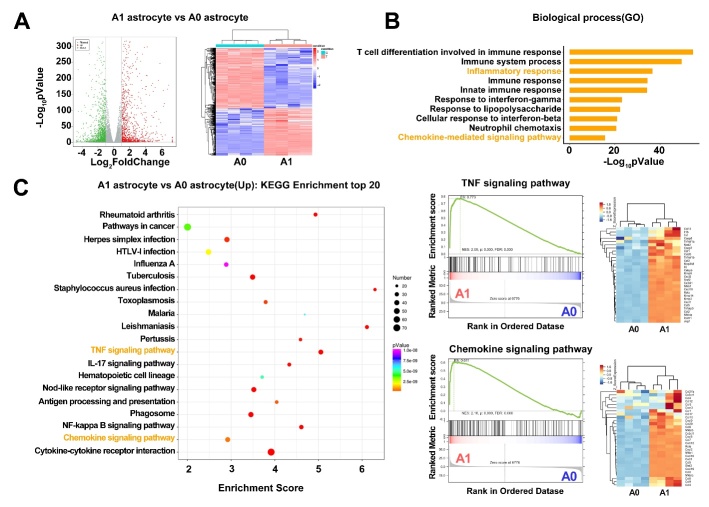
Astrocytes play an essential role in the modulation of blood-brain barrier function. Neurological diseases induce the transformation of astrocytes into a neurotoxic A1 phenotype, exacerbating brain injury. However, the effect of A1 astrocytes on the BBB dysfunction after stroke is unknown. Adult male ICR mice (n=97) were subjected to 90-minute transient middle cerebral artery occlusion (tMCAO). Immunohistochemical staining of A1 (C3d) and A2 (S100A10) was performed to characterize phenotypic changes in astrocytes over time after tMCAO. The glucagon-like peptide-1 receptor agonist semaglutide was intraperitoneally injected into mice to inhibit A1 astrocytes. Infarct volume, atrophy volume, neurobehavioral outcomes, and BBB permeability were evaluated. RNA-seq was adopted to explore the potential targets and signaling pathways of A1 astrocyte-induced BBB dysfunction. Astrocytic C3d expression was increased, while expression of S100A10 was decreased in the first two weeks after tMCAO, reflecting a shift in the astrocytic phenotype. Semaglutide treatment reduced the expression of CD16/32 in microglia and C3d in astrocytes after ischemic stroke (p<0.05). Ischemia-induced brain infarct volume, atrophy volume and neuroinflammation were reduced in the semaglutide-treated mice, and neurobehavioral outcomes were improved compared to control mice (p<0.05). We further demonstrated that semaglutide treatment reduced the gap formation of tight junction proteins ZO-1, claudin-5 and occludin, as well as IgG leakage three days following tMCAO (p<0.05). In vitro experiments revealed that A1 astrocyte-conditioned medium disrupted BBB integrity. RNA-seq showed that A1 astrocytes were enriched in inflammatory factors and chemokines and significantly modulated the TNF and chemokine signaling pathways, which are closely related to barrier damage. We concluded that astrocytes undergo a phenotypic shift over time after ischemic stroke. C3d+/GFAP+ astrocytes aggravate BBB disruption, suggesting that inhibiting C3d+/GFAP+ astrocyte formation represents a novel strategy for the treatment of ischemic stroke.

Keywords: A1 astrocyte; blood-brain barrier; ischemia; neuroinflammation; stroke.


Conflict of interest statement

Competing interests No competing interest.

Figures

Figure 1.
Figure 1.
Phenotypic changes of astrocytes after tMCAO in mice. (A) Experimental scheme. Mice were trained for 3 days before tMCAO. Neurobehavioral tests and body weight were examined at 1, 3, 7, 14 and 28 days following tMCAO. Animals were sacrificed at 1, 3, 7, 14 and 28 days following tMCAO. (B) Black boxes showed the peri lesion area for immunostaining and western blot. (C) Photomicrographs showed C3d+/GFAP+ cells (top, C3d in green color; GFPA in red color) and S100A10+/GFAP+ cells (bottom, S100A10 in green color; GFAP in red color) in the perifocal area of ipsilateral hemisphere at 1, 3, 7 and 14 days after tMCAO. Bar graph showed the percentage of C3d+/GFAP+ cells and S100A10+/GFAP+ in the ipsilateral hemisphere of brain at 1, 3, 7 and 14 days after tMCAO. Scale bar=50 μm. Data are mean±SEM, n=4-5 per group. **p<0.01, ***p<0.001 vs. D1. (D) Photomicrographs showed C3d+/GFAP+ cells closely wrapped around lectin+ microvessels (arrowheads) in the perifocal area of the ipsilateral hemisphere in the mouse brain at 3 day after tMCAO. Scale bar=50 μm. (E) Bar graph showed the number of GFAP+ astrocytes and C3d+/GFAP+ astrocytes that co-localized with blood vessels.
Figure 2.
Figure 2.
Semaglutide attenuated expression of CD16/32 in microglia after tMCAO. (A) Photomicrographs showed that CD16/32+/Iba-1+ cells (CD16/32 in green color; Iba-1 In red color) in the ipsilateral hemisphere of the perifocal area in sham mice, sham mice treated with semaglutide, tMCAO mice and semaglutide treated tMCAO mice. Scale bar=25 μm. Bar graphs showed the number of Iba-1+ cells and CD16/32+/Iba-1+ cells in the perifocal area of ipsilateral hemisphere in the semaglutide treated tMCAO mice and control mice. Data are mean±SEM, n=3 per group. *p<0.05, **p<0.01. (B) Bar graphs showed that the mRNA expression of IL-1α, TNFα and C1q in the perifocal area of ipsilateral hemisphere in the semaglutide treated tMCAO mice, the control mice and sham mice treated with semaglutide at day 3 after tMCAO. Data are mean±SEM, n=4 per group, *p<0.05.
Figure 3.
Figure 3.
Semaglutide attenuated astrocytic C3d+ expression after tMCAO. (A) Representative photomicrographs showed that GFAP+ cells, C3d+/GFAP+ cells (C3d in green color; GFAP in red color) and S100A10+/GFAP+ cells (S100A10 in green color; GFAP in red color) in perifocal area of ipsilateral hemisphere in the semaglutide treated tMCAO mice, control mice and sham mice treated with semaglutide, at 3 days following tMCAO. Scale bar=50 μm. Bar graph showed that semi-quantification of GFAP intensity, the percentage of C3d+/GFAP+ cells, and S100A10+/GFAP+ cells. Data are presented as mean±SEM, n=3 per group. *p<0.05, **p<0.01. (B) Western blotting analysis data showed relative GFAP and C3d levels in the perifocal area of ipsilateral hemisphere in the semaglutide treated tMCAO mice and control mice. Data are mean±SEM, n=3 per group. *p<0.05.
Figure 4.
Figure 4.
Inhibiting C3d+/GFAP+ astrocytes formation attenuated infarct volume and neurobehavioral deficit in the semaglutide treated tMCAO mice. (A-B) Cresyl violet-stained coronal sections of the brain in control mice, sham mice treated with semaglutide, tMCAO mice, and semaglutide treated tMCAO mice following 3 (A, infarct) and 28 days (B, atrophy) of tMCAO. The brain infarct area and brain atrophy were circled by the dashed line. Bar graph showed the semi-quantitative analysis of the infarct volume and atrophy volume. Data are mean±SEM, n=6 per group. *p<0.05, **p<0.01. (C-F) Neurobehavioral outcomes were assessed by three neurobehavioral tests including the modified neurological severity score (mNSS, C), rotarod test (D), and hanging wire test (E-F). Line graph showed body weight (G), Data are mean±SEM, n=9-12 per group, **p<0.01, *p<0.05.
Figure 5.
Figure 5.
Inhibiting C3d+/GFAP+ astrocytes formation reduced BBB disruption and gap formation of tight junction in tMCAO mice. (A) Photographs shows Evans blue (EB) exudation for the whole brain and brain sections in the semaglutide treated tMCAO mice, tMCAO mice, and control mice at 3 days after tMCAO. The value of extravasated EB was recorded by a spectrophotometer at 610 nm. Bar graph showed the quantitative analysis of Evans blue leakage in these 3 groups. Data are mean±SEM, n=3-5 per group. *p<0.05. (B) Photographs showed IgG staining in the coronal section of the brain following 3 days of tMCAO in the semaglutide treated tMCAO mice, tMCAO mice, and control mice. Scale bar=50 μm. Bar graph showed the mean IOD of IgG intensity in these 3 groups. Data are mean±SEM, n=6 per group. **p<0.01. (C) Photomicrographs showed CD31/claudin-5, CD31/ZO-1, and CD31/occludin double staining in the ischemic peri-focal areas in the semaglutide treated tMCAO mice, tMCAO mice, and control mice. White arrows indicated discontinuous labeling and gap formation. Scale bar=10 μm. Bar graph showed relative gap formation of ZO-1, claudin-5, and occludin. Data are mean±SEM, n=3 per group. *p<0.05, **p<0.01
Figure 6.
Figure 6.
C3d+/GFAP+ astrocyte derived medium reduced tight junction protein expression in vitro. (A) Immunofluorescence images showed resting astrocytes were converted to C3d+/GFAP+ cells (C3d in red color; GFAP in green color; DAPI in blue color) after treated with IL-1α, TNFα and C1q. Scale bar=25 μm. (B) Bar graph showed the mRNA levels of C3d+/GFAP+ cells related genes H2-T23, Serping1, H2D1 and Ligp1 expression after IL-1α, TNFα and C1q treatment. Data are mean±SEM. n=3 per group. *p<0.05, ***p<0.001. (C) Photomicrographs showed tight junction proteins (claudin-5 and ZO-1 in red color) expressed in CD31+ cells (green) that were treated by 1) medium derived from inactivated astrocytes (A0-CM), 2) medium derived from IL-1α, TNFα and C1q treated astrocytes (A1-CM) and 3) medium derived from astrocytes that were treated with LPS-stimulated microglia (LPS-MCM-AS-CM). Scale bar=25 μm. (D) Western blotting analysis of claudin-5 and ZO-1 in the A0-CM group, A1-CM group and LPS-MCM-AS-CM group. n=3 per group. *p<0.05, **p<0.01, ***p<0.001, ****p<0.0001.
Figure 7.
Figure 7.
IL-1α, TNFα and C1q treated astrocyte expressed different transcripts in RNA-seq data. (A) Volcano plot showed the upregulated (red) and downregulated (green) genes between A1 and A0 astrocyte. The horizontal axis is log2fold change, and the vertical axis is -log10p value, p<0.05. Heatmap showed the overall distribution of differentially expressed genes. Gene expression data was colored red for high expression and blue for low expression. (B) GO enrichment analysis of differentially expressed genes based on RNA-seq data with p-value showed top 10 upregulated biological process. (C) KEGG enrichment top 20 analysis suggested that TNF signaling pathway and cytokine-cytokine receptor interaction were related with the phenotypic changes of astrocytes.

References

    1. Li X, Liao Y, Dong Y, Li S, Wang F, Wu R, et al.. (2020). Mib2 Deficiency Inhibits Microglial Activation and Alleviates Ischemia-Induced Brain Injury. Aging Dis, 11:523-535. - PMC - PubMed
    1. Zhao RC, Stambler I (2020). The Urgent Need for International Action for Anti-aging and Disease Prevention. Aging Dis, 11:212-215. - PMC - PubMed
    1. Shetty AK, Upadhya R, Madhu LN, Kodali M (2019). Novel Insights on Systemic and Brain Aging, Stroke, Amyotrophic Lateral Sclerosis, and Alzheimer's Disease. Aging Dis, 10:470-482. - PMC - PubMed
    1. Allen NJ, Bennett ML, Foo LC, Wang GX, Chakraborty C, Smith SJ, et al.. (2012). Astrocyte glypicans 4 and 6 promote formation of excitatory synapses via GluA1 AMPA receptors. Nature, 486:410-414. - PMC - PubMed
    1. Chung WS, Clarke LE, Wang GX, Stafford BK, Sher A, Chakraborty C, et al.. (2013). Astrocytes mediate synapse elimination through MEGF10 and MERTK pathways. Nature, 504:394-400. - PMC - PubMed

LinkOut - more resources