. 2022 May 17:12:870086.
doi: 10.3389/fonc.2022.870086. eCollection 2022.

Serum Anti-BRAT1 is a Common Molecular Biomarker for Gastrointestinal Cancers and Atherosclerosis

Affiliations

Serum Anti-BRAT1 is a Common Molecular Biomarker for Gastrointestinal Cancers and Atherosclerosis

Liubing Hu et al. Front Oncol. .

Abstract

Atherosclerosis (AS) and cancers are major global causes of mortality and morbidity. They also share common modifiable pathogenesis risk factors. As the same strategies used to predict AS could also detect certain cancers, we sought novel serum antibody biomarkers of cancers in atherosclerotic sera sampled by liquid biopsy. Using serological antigen identification by cDNA expression cloning (SEREX) and western blot, we screened and detected the antigens BRCA1-Associated ATM Activator 1 (BRAT1) and WD Repeat Domain 1 (WDR1) in the sera of patients with transient ischemic attacks (TIA). Amplified luminescence proximity homogeneous assay-linked immunosorbent assay (AlphaLISA) established the upregulation of serum BRAT1 antibody (BRAT1-Abs) and WDR1 antibody (WDR1-Abs) in patients with AS-related diseases compared with healthy subjects. ROC and Spearman's correlation analyses showed that BRAT1-Abs and WDR1-Abs could detect AS-related diseases. Thus, serum BRAT1-Abs and WDR1-Abs are potential AS biomarkers. We used online databases and AlphaLISA detection to compare relative antigen and serum antibody expression and found high BRAT1 and BRAT1-Abs expression in patients with GI cancers. Significant increases (> 0.6) in the AUC for BRAT1-Ab vs. esophageal squamous cell carcinoma (ESCC), gastric cancer, and colorectal cancer suggested that BRAT1-Ab exhibited better predictive potential for GI cancers than WDR1-Ab. There was no significant difference in overall survival (OS) between BRAT1-Ab groups (P = 0.12). Nevertheless, a log-rank test disclosed that the highest serum BRAT1-Ab levels were associated with poor ESCC prognosis at 5-60 weeks post-surgery. We validated the foregoing conclusions by comparing serum BRAT1-Ab and WDR1-Ab levels based on the clinicopathological characteristics of the patients with ESCC. Multiple statistical approaches established a correlation between serum BRAT1-Ab levels and platelet counts. BRAT1-Ab upregulation may enable early detection of AS and GI cancers and facilitate the delay of disease progression. Thus, BRAT1-Ab is a potential antibody biomarker for the diagnosis of AS and GI cancers and strongly supports the routine clinical application of liquid biopsy in chronic disease detection and diagnosis.

Keywords: BRAT1; antibody biomarker; atherosclerosis; gastrointestinal cancer; liquid biopsy.


Conflict of interest statement

The authors declare that the research was conducted in the absence of any commercial or financial relationships that could be construed as a potential conflict of interest.

Figures

Figure 1
Figure 1
Recognition and identification of BRAT1 and WDR1 using serum of TIA patients. (A) Recombinant expression cloning proteins were detected by SEREX in sera from TIA patients. positive phage clones were marked by red arrows. (B) Positive clones obtained from above were rescreened to obtain monoclonality. (C) Positive clones from B were recloned to obtain monoclonality. (D) Antigenic proteins BRAT1 and WDR1 were succeeded in purification from precipitate fraction. (E) GST-BRAT1, GST-WDR1 and GST proteins were electrophoresed through SDS-polyacrylamide gels followed by staining with Coomassie Brilliant Blue (CBB), Western blotting using anti-GST (αGST), or sera of TIA patient [TIA#297]. The degradation products of GST-BRAT1 were marked by asterisks (*).
Figure 2
Figure 2
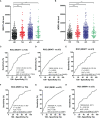
Comparison of serum anti-BRAT1 antibody (BRAT1-Abs) and anti-WDR1 antibody (WDR1-Abs) levels between healthy donors (HDs) and patients with TIA, aCI, or oCI. Serum antibody levels against BRAT1-GST (A) or WDR1-GST (B) were determined by AlphaLISA. The bars represent the median. P values were calculated by the Kruskal–Wallis test. **P < 0.01; ***P < 0.001. The serum numbers of HDs, TIA, aCI and oCI were 285, 91, 464 and 66, respectively. ROC analysis of BRAT1 and WDR1 for the prediction of TIA (C, F), aCI (D, G) and oCI (E, H). The numbers in the figures indicate the cutoff values for marker levels, and the numbers in parentheses indicate the sensitivity (left) and specificity (right).
Figure 3
Figure 3
Comparison of serum BRAT1-Abs and WDR1-Abs levels between HDs and patients with AMI or DM. Serum antibody levels against BRAT1-GST (A) or WDR1-GST (B) were detected by AlphaLISA. The bars represent the median. P values were calculated by the Kruskal–Wallis test. ***P < 0.001. ns, not significant. The serum number of HDs, AMI, and DM was 128. ROC analysis of BRAT1 and WDR1 for the prediction of AMI (C, D) and DM (E, F). The numbers in the figures indicate the cutoff values for marker levels, and the numbers in parentheses indicate the sensitivity (left) and specificity (right).
Figure 4
Figure 4
Comparison of BRAT1 levels between normal and gastrointestinal cancer tissues. (A, B) The expression levels of human BRAT1 and WDR1 in different cancer types were obtained from TCGA data in TIMER. (C) For the main type of gastrointestinal cancer, including ESCA, STAD, READ, LIHC, PAAD and COAD in the TCGA project, the normal tissues of the TCGA normal data were as controls. The box plot data were obtained from GEPIA web-based tool. (D) Plots of BRAT1 expression in normal and gastrointestinal cancer tissues of based on gene chip data of TNMplot. (E) BRAT1 proteomic expression profile in gastrointestinal cancers, LIHC, PAAD and COAD from CPTAC samples. Standard deviations from the median across samples for the given cancer types were represented by Z values. n represents the number of samples. *P < 0.05, **P < 0.01, ***P < 0.001.
Figure 5
Figure 5
Comparison of serum BRAT1-Abs levels between HDs and patients with gastrointestinal cancers. (A) Serum antibody levels against BRAT1-GST were determined by AlphaLISA. The bars represent the median. The Kruskal–Wallis test was used for calculating P values. The serum number of HDs, ESCC, GC and CRC were 96, 192, 96 and 192, respectively. sensitivity and specificity of BRAT1 between ESCC (B), GC (C), CRC (D) were evaluated by ROC analysis. Numbers in the figure represent cutoff level, specificity and sensitivity. **P < 0.01, ***P < 0.001.
Figure 6
Figure 6
Comparison of overall survivals of the patients with ESCC according to BRAT1-Abs levels. Kaplan-Meier plots are shown. The number of patients was shown in parentheses. (A) The BRAT1-Abs levels were classified into every one-fourth quartiles according to antigen level (Q1, Q2, Q3 and Q4). (B) The BRAT1-Abs levels were classified into two groups (Q1+Q1+Q3 vs. Q4). The p value at 60 months after surgery was 0.12. Log-Rank test was performed to compare the difference between two groups.

References

    1. Charo IF, Taub R. Anti-Inflammatory Therapeutics for the Treatment of Atherosclerosis. Nat Rev Drug Discov (2011) 10:365–76. doi: 10.1038/nrd3444 - DOI - PMC - PubMed
    1. Libby P. The Changing Landscape of Atherosclerosis. Nature (2021) 592:524–33. doi: 10.1038/s41586-021-03392-8 - DOI - PubMed
    1. Herrington W, Lacey B, Sherliker P, Armitage J, Lewington S. Epidemiology of Atherosclerosis and the Potential to Reduce the Global Burden of Atherothrombotic Disease. Circ Res (2016) 118:535–46. doi: 10.1161/CIRCRESAHA.115.307611 - DOI - PubMed
    1. Sung H, Ferlay J, Siegel RL, Laversanne M, Soerjomataram I, Jemal A, et al. . Global Cancer Statistics 2020: GLOBOCAN Estimates of Incidence and Mortality Worldwide for 36 Cancers in 185 Countries. CA Cancer J Clin (2021) 71:209–49. doi: 10.3322/caac.21660 - DOI - PubMed
    1. Arnold M, Abnet CC, Neale RE, Vignat J, Giovannucci EL, McGlynn KA, et al. . Global Burden of 5 Major Types of Gastrointestinal Cancer. Gastroenterology (2020) 159:335–349.e15. doi: 10.1053/j.gastro.2020.02.068 - DOI - PMC - PubMed