. 2022 Jul;26(13):3783-3796.
doi: 10.1111/jcmm.17413. Epub 2022 Jun 3.

FOXM1 regulates glycolysis in nasopharyngeal carcinoma cells through PDK1

Affiliations

FOXM1 regulates glycolysis in nasopharyngeal carcinoma cells through PDK1

Qing Yang et al. J Cell Mol Med. 2022 Jul.

Abstract

The transcription factor forkhead box M1 (FOXM1) is a well-known proto-oncogene that plays a significant role in the pathogenesis of various human cancers. However, the regulatory role and underlying mechanisms of FOXM1 in nasopharyngeal carcinoma (NPC) metabolism remain unclear. We demonstrated that FOXM1 could positively regulate glycolysis in NPC cells. Functional studies have shown that pyruvate dehydrogenase kinase 1 (PDK1) is involved in FOXM1-regulated lactate production, ATP generation and glycolysis. FOXM1 binds directly to the PDK1 promoter region and increases the expression of PDK1 at the transcriptional level, leading to the phosphorylation of pyruvate dehydrogenase (PDH) at serine 293, inhibiting its activity. Knocking down FOXM1 using specific short hairpin RNAs (shRNAs) can significantly decrease glycolysis and the expression of PDK1 in NPC cells. Furthermore, microenvironmental factors can increase the expression of FOXM1 by regulating hypoxia-inducible factor 1α (HIF-1α) expression. Clinical data and in vivo studies confirmed the positive roles of FOXM1/PDK1 in NPC proliferation and progression. In conclusion, our findings revealed that FOXM1 regulates glycolysis and proliferation of NPC through PDK1-mediated PDH phosphorylation. Therefore, targeting the FOXM1-PDK1 axis may be a potential therapeutic strategy for NPC.

Keywords: FOXM1; PDK1; glycolysis; nasopharyngeal carcinoma; proliferation.


Conflict of interest statement

The authors declare no conflicts of interest.

Figures

FIGURE 1
FIGURE 1
FOXM1 is highly expressed in nasopharyngeal carcinoma (NPC) and predicts a worse prognosis. (A) FOXM1 expression levels in non‐cancerous (n = 44) and head and neck cancer (n = 502) samples in the TCGA cohort. (B) The mRNA expression of FOXM1 in non‐cancerous nasopharyngeal samples (n = 6) and NPC tissue (n = 12) detected via qPCR. (C) IHC analysis of FOXM1 protein expression in non‐cancerous nasopharyngeal and NPC tissue. Scale bars, 20 μm. (D–E) FOXM1 expression levels in HNEpC and human NPC cell lines were detected via qPCR (D) and western blot (E). HNEpC is an immortalized normal nasopharyngeal epithelial cell line, while CNE‐1, SUNE‐1, HONE‐1 and C666‐1 are human NPC cell lines. (F) The prognostic value of FOXM1 expression in head and neck cancer (n = 502) was analysed using data from the TCGA database. *p < 0.05; ***p < 0.001
FIGURE 2
FIGURE 2
FOXM1 promotes glycolysis and the proliferation of nasopharyngeal carcinoma (NPC) cells. (A) Pathway enrichment analysis suggested that FOXM1 was enriched in glycolysis. Pathway analysis was performed using the GSEA method, which was based on an empirical permutation test procedure. (B) Western blot and qPCR results show the transfection efficiency of FOXM1 knockdown in HONE‐1 and C666‐1 cells. (C) Intracellular glucose uptake in shCtrl‐ and shFOXM1‐treated HONE‐1 and C666‐1 cells was quantified via 2‐NBDG staining. (D–E) Lactate production (D) and intracellular ATP levels (E) of shCtrl‐ and shFOXM1‐treated HONE‐1 and C666‐1 cells. (F) The ECAR of shCtrl‐ and shFOXM1‐treated HONE‐1 and C666‐1 cells was measured using a Seahorse XFe96 Extracellular Flux analyser. (G) Statistical analysis of the effects of FOXM1 knockdown on glycolysis and glycolytic capacity. (H–I) The proliferation of shCtrl‐ and shFOXM1‐treated HONE‐1 and C666‐1 cells were determined using a CCK‐8 (H) and EdU proliferation assay (I). *p < 0.05; **p < 0.01; ***p < 0.001
FIGURE 3
FIGURE 3
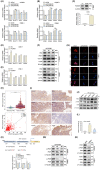
FOXM1 transcriptionally regulates the expression of PDK1. (A) qPCR detection of the mRNA expression of PDK1, GLUT1, HK2 and LDHA in HONE‐1 and C666‐1 cells after knocking down FOXM1 expression. (B) qPCR detection of the mRNA expression of PDK1, PDK2, PDK3 and PDK4 in HONE‐1 and C666‐1 cells after knocking down FOXM1 expression. (C) Western blot and qPCR data show the transfection efficiency of FOXM1 overexpression in CNE‐1 cells. (D) CNE‐1 cells were transfected with empty vector control or FOXM1 construct for 48 h, and the mRNA expression of PDK1, GLUT1, HK2 and LDHA was measured via qPCR. (E) CNE‐1 cells were transfected with empty vector control or FOXM1 construct for 48 h, and the mRNA expression of PDK1, PDK2, PDK3 and PDK4 was measured via qPCR. (F) The protein expression of PDK1, GLUT1, HK2 and LDHA in HONE‐1 and C666‐1 cells after FOXM1 knockdown was measured via western blot. (G) Immunofluorescence staining of PDK1 expression in HONE‐1 and C666‐1 cells after knocking down FOXM1 expression. Scale bar, 50 μm. (H) PDK1 expression levels in non‐cancerous samples (n = 44) and head and neck cancer (n = 502) (above), and the correlation between FOXM1 and PDK1 expression in head and neck cancer (n = 502) from the TCGA database (below). (I) Representative immunohistochemical images show FOXM1, PDK1, GLUT1, HK2 and LDHA in the serial sections of nasopharyngeal carcinoma (NPC) tissue. Scale bars, 20 μm. (J) PDK1 and p‐PDH expression levels in HNEpC and human NPC cell lines were detected via western blot. (K) The potential binding sites and mutant sites of FOXM1 binding to the PDK1 promoter. HONE‐1 cells were co‐transfected with pGL3‐PDK1‐WT‐Luc, pGL3‐PDK1‐Mut1‐Luc, pGL3‐PDK1‐Mut2‐Luc, pRL‐TK plasmid and shCtrl or shFOXM1 for 48 h. The results are presented as the ratio between the activity of the reporter plasmid and that of pRL‐TK. (L) ChIP‐PCR verified the binding between FOXM1 and the promoter of PDK1 at potential binding sites 1 and 2. Immunoglobulin G (IgG) was used as the negative control. (M) The protein expression of p‐PDH (Ser293) and PDH in HONE‐1 and C666‐1 cells after FOXM1 knockdown was measured via western blot. (N) HONE‐1 and C666‐1 cells were transfected with negative control siRNA (siCtrl) or siRNA for PDK1 (siPDK1) for 48 h, and western blot was performed to detect the protein levels of p‐PDH (Ser293) and PDH. ns, not significant; *p < 0.05; **p < 0.01; ***p < 0.001
FIGURE 4
FIGURE 4
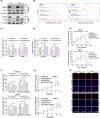
PDK1 is involved in FOXM1‐regulated glycolysis and cell proliferation. (A) The expression of PDK1 in shCtrl‐ and shFOXM1‐treated HONE‐1 and C666‐1 cells stably transfected with empty vector (EV) or PDK1 constructs was checked via western blot analysis. (B) Intracellular glucose uptake of shCtrl‐ and shFOXM1‐treated HONE‐1 and C666‐1 cells transfected with empty vector or PDK1 constructs via staining with 2‐NBDG. (C–D) Lactate production (C) and intracellular ATP levels (D) of shCtrl‐ and shFOXM1‐treated HONE‐1 and C666‐1 cells transfected with empty vector or PDK1 constructs. (E) ECAR measurement of shCtrl‐ and shFOXM1‐treated HONE‐1 and C666‐1 cells transfected with empty vector or PDK1 constructs using a Seahorse XFe96 Extracellular Flux analyser. (F) Statistical analysis of the effects of FOXM1 knockdown or PDK1 overexpression on glycolysis and glycolytic capacity. (G–H) The proliferation of shCtrl‐ and shFOXM1‐treated HONE‐1 and C666‐1 cells transfected with empty vector or PDK1 constructs were checked via the CCK‐8 assay (G) and EdU proliferation assay (H). *p < 0.05; **p < 0.01; ***p < 0.001
FIGURE 5
FIGURE 5
Microenvironment‐mediated HIF‐1α stabilization enhances the expression of FOXM1. (A) Western blot detection of HIF‐1α and FOXM1 expression in HONE‐1 and C666‐1 cells exposed to hypoxia (1% O2) or normoxia for 0, 6, 12 or 24 h. (B) Western blot detection of HIF‐1α and FOXM1 expression in HONE‐1 and C666‐1 cells exposed to H2O2 at concentrations of 0, 1, 5 or 10 μM for 24 h. (C) Western blot detection of FOXM1 expression in HONE‐1 and C666‐1 cells exposed to NAC at concentrations of 0, 1, 5 or 10 mM for 24 h. (D) Western blot detection of HIF‐1α and FOXM1 expression in HONE‐1 and C666‐1 cells exposed to cytokines (10 ng/ml TGF‐β1 to simulate the tumour microenvironment) for 0, 6, 12 or 24 h. (E–F) HONE‐1 and C666‐1 cells were transfected with empty vector or HIF‐1α constructs for 48 h, and the expression of HIF‐1α and FOXM1 were checked via western blot (E) and qPCR analysis (F). (G–I) HONE‐1 and C666‐1 cells were transfected with negative control siRNA (siCtrl) or siRNA for HIF‐1α (siHIF‐1α) and treated with hypoxia (1% O2) (G), H2O2 (10 μM) (H), or TGF‐β1 (10 ng/ml) (I) for 24 h. Western blot was then performed to detect the protein levels of HIF‐1α and FOXM1. **p < 0.01; ***p < 0.001
FIGURE 6
FIGURE 6
PDK1 is involved in FOXM1‐mediated cancer progression in vivo. (A) The tumour growth curves of shCtrl‐ and shFOXM1‐treated HONE‐1 cells stably transfected with empty vector or PDK1 constructs after being injected into nude mice. Tumour sizes were measured every week using a calliper. (B–C) Tumours were extracted, and the tumour sizes (B) and tumour masses (C) were measured at the end of the experiment. (D) Western blot was performed to detect the protein levels of FOXM1 and PDK1 in the tumour tissues of mice. (E) Graphical abstract showing that microenvironmental factors induce FOXM1, which transcriptionally activates PDK1 by directly binding to the promoter of PDK1. This interaction leads to PDH phosphorylation at Ser293 and promotes glycolysis and proliferation in nasopharyngeal carcinoma (NPC). *p < 0.05; **p < 0.01

References

    1. Chen YP, Chan ATC, Le QT, Blanchard P, Sun Y, Ma J. Nasopharyngeal carcinoma. Lancet. 2019;394(10192):64‐80. - PubMed
    1. Lai SZ, Li WF, Chen L, et al. How does intensity‐modulated radiotherapy versus conventional two‐dimensional radiotherapy influence the treatment results in nasopharyngeal carcinoma patients? Int J Radiat Oncol Biol Phys. 2011;80(3):661‐668. - PubMed
    1. Elia I, Doglioni G, Fendt SM. Metabolic hallmarks of metastasis formation. Trends Cell Biol. 2018;28(8):673‐684. - PubMed
    1. Ceballos J, Schwalfenberg M, Karageorgis G, et al. Synthesis of Indomorphan pseudo‐natural product inhibitors of glucose transporters GLUT‐1 and ‐3. Angew Chem Int Ed Engl. 2019;58(47):17016‐17025. - PMC - PubMed
    1. DeWaal D, Nogueira V, Terry AR, et al. Hexokinase‐2 depletion inhibits glycolysis and induces oxidative phosphorylation in hepatocellular carcinoma and sensitizes to metformin. Nat Commun. 2018;9(1):446. - PMC - PubMed

Publication types

MeSH terms

Substances