

Subcutaneous Adipose Tissue Edema in Lipedema Revealed by Noninvasive 3T MR Lymphangiography
- PMID: 35657120
- PMCID: PMC9718889
- DOI: 10.1002/jmri.28281
Subcutaneous Adipose Tissue Edema in Lipedema Revealed by Noninvasive 3T MR Lymphangiography
Abstract
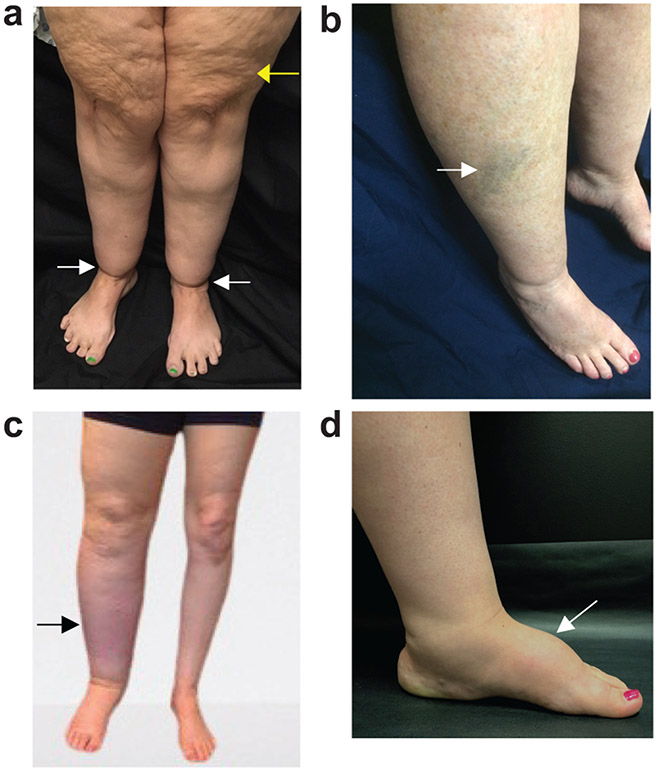
Background: Lipedema exhibits excessive lower-extremity subcutaneous adipose tissue (SAT) deposition, which is frequently misidentified as obesity until lymphedema presents. MR lymphangiography may have relevance to distinguish lipedema from obesity or lymphedema.
Hypothesis: Hyperintensity profiles on 3T MR lymphangiography can identify distinct features consistent with SAT edema in participants with lipedema.
Study type: Prospective cross-sectional study.
Subjects: Participants (48 females, matched for age [mean = 44.8 years]) with lipedema (n = 14), lipedema with lymphedema (LWL, n = 12), cancer treatment-related lymphedema (lymphedema, n = 8), and controls without these conditions (n = 14).
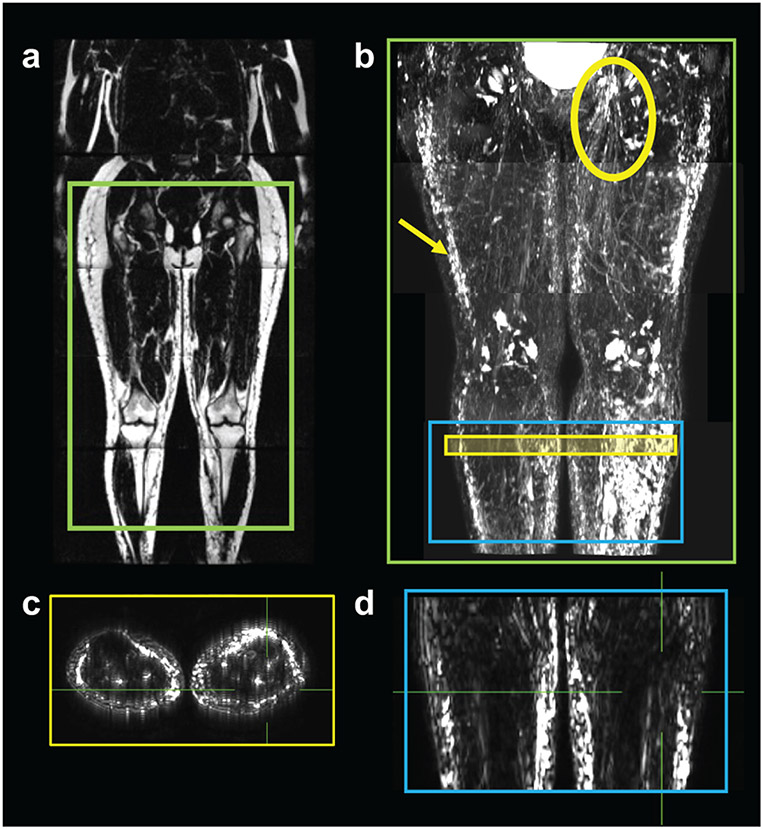
Field strength/sequence: 3T MR lymphangiography (nontracer 3D turbo-spin-echo).
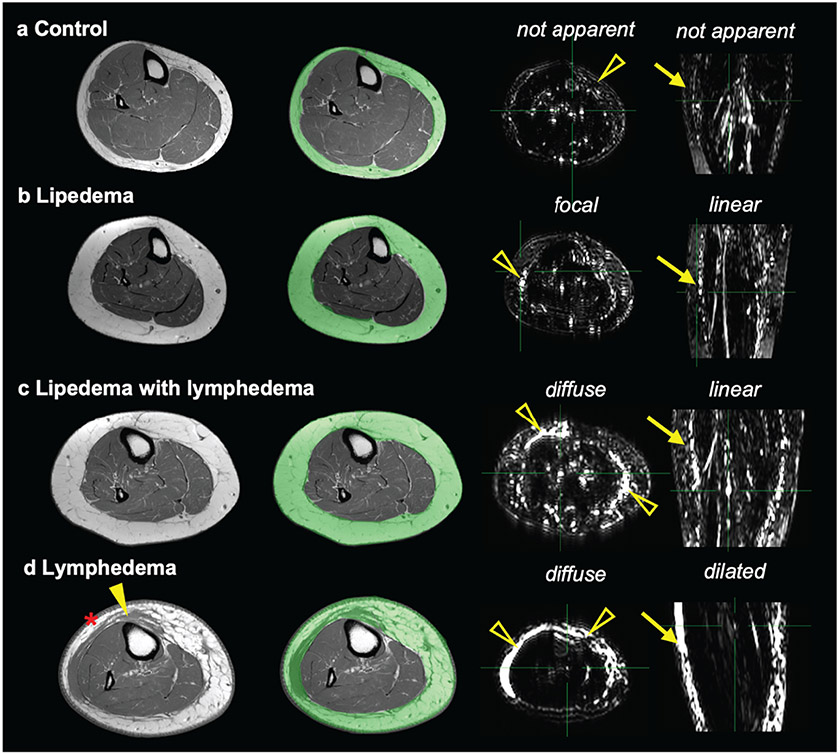
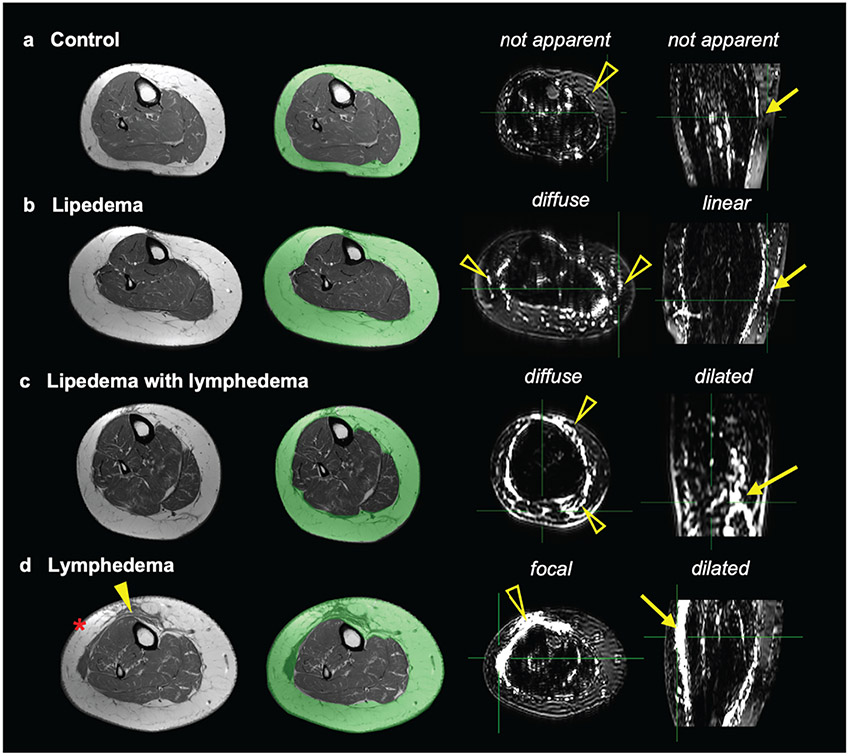
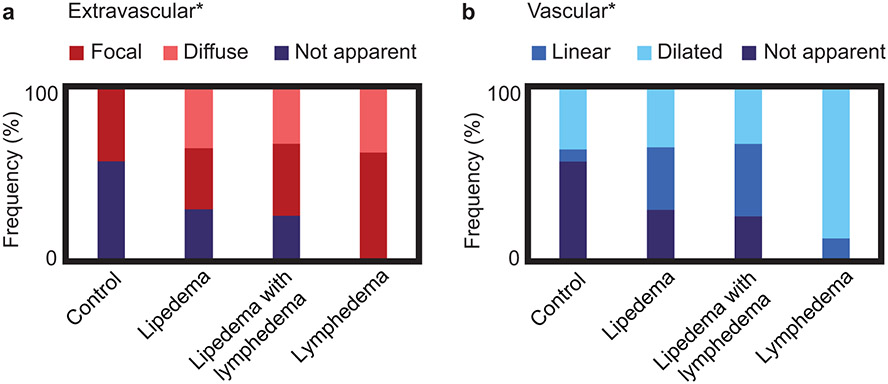
Assessment: Review of lymphangiograms in lower extremities by three radiologists was performed independently. Spatial patterns of hyperintense signal within the SAT were scored for extravascular (focal, diffuse, or not apparent) and vascular (linear, dilated, or not apparent) image features.
Statistical tests: Interreader reliability was computed using Fleiss Kappa. Fisher's exact test was used to evaluate the proportion of image features between study groups. Multinomial logistic regression was used to assess the relationship between image features and study groups. The odds ratio (OR) and 95% confidence interval (CI) of SAT extravascular and vascular features was reported in groups compared to lipedema. The threshold of statistical significance was P < 0.05.
Results: Reliable agreement was demonstrated between three independent, blinded reviewers (P < 0.001). The frequency of SAT hyperintensities in participants with lipedema (36% focal, 36% diffuse), LWL (42% focal, 33% diffuse), lymphedema (62% focal, 38% diffuse), and controls (43% focal, 0% diffuse) was significantly distinct. Compared with lipedema, SAT hyperintensities were less frequent in controls (focal: OR = 0.63, CI = 0.11-3.41; diffuse: OR = 0.05, CI = 0.00-1.27), similar in LWL (focal: OR = 1.29, CI = 0.19-8.89; diffuse: OR = 1.05, CI = 0.15-7.61), and more frequent in lymphedema (focal: OR = 9.00, CI = 0.30-274.12; diffuse: OR = 5.73, CI = 0.18-186.84).
Data conclusion: Noninvasive MR lymphangiography identifies distinct signal patterns indicating SAT edema and lymphatic load in participants with lipedema.
Evidence level: 1 TECHNICAL EFFICACY: Stage 1.
Keywords: lipedema; lipoedema; lymphangiography; lymphedema; obesity.
© 2022 International Society for Magnetic Resonance in Medicine.
Figures
Comment in
-
Editorial for "Subcutaneous Adipose Tissue Edema in Lipedema Revealed by Noninvasive 3T Magnetic Resonance Lymphangiography".J Magn Reson Imaging. 2023 Feb;57(2):609-610. doi: 10.1002/jmri.28400. Epub 2022 Aug 18. J Magn Reson Imaging. 2023. PMID: 35979906 No abstract available.
-
Comments on "Subcutaneous Adipose Tissue Edema in Lipedema Revealed by Noninvasive 3T MR Lymphangiography".J Magn Reson Imaging. 2024 Jan;59(1):352. doi: 10.1002/jmri.28719. Epub 2023 Mar 31. J Magn Reson Imaging. 2024. PMID: 37000190 No abstract available.
Similar articles
-
MR imaging of the lymphatic system in patients with lipedema and lipo-lymphedema.Microvasc Res. 2009 May;77(3):335-9. doi: 10.1016/j.mvr.2009.01.005. Epub 2009 Jan 27. Microvasc Res. 2009. PMID: 19323976
-
Editorial for "Subcutaneous Adipose Tissue Edema in Lipedema Revealed by Noninvasive 3T Magnetic Resonance Lymphangiography".J Magn Reson Imaging. 2023 Feb;57(2):609-610. doi: 10.1002/jmri.28400. Epub 2022 Aug 18. J Magn Reson Imaging. 2023. PMID: 35979906 No abstract available.
-
Non-contrast MR Lymphography of lipedema of the lower extremities.Magn Reson Imaging. 2020 Sep;71:115-124. doi: 10.1016/j.mri.2020.06.010. Epub 2020 Jun 17. Magn Reson Imaging. 2020. PMID: 32561380
-
Lipedema-An update.Dermatol Ther. 2019 Mar;32(2):e12805. doi: 10.1111/dth.12805. Epub 2018 Dec 27. Dermatol Ther. 2019. PMID: 30565362 Review.
-
Assessment Modalities for Lower Extremity Edema, Lymphedema, and Lipedema: A Scoping Review.Cureus. 2024 Mar 10;16(3):e55906. doi: 10.7759/cureus.55906. eCollection 2024 Mar. Cureus. 2024. PMID: 38601427 Free PMC article.
Cited by
-
National survey of patient symptoms and therapies among 707 women with a lipedema phenotype in the United States.Vasc Med. 2024 Feb;29(1):36-41. doi: 10.1177/1358863X231202769. Epub 2023 Oct 16. Vasc Med. 2024. PMID: 37844030 Free PMC article.
-
Proposed Framework for Research Case Definitions of Lipedema.Lymphat Res Biol. 2024 Apr;22(2):93-105. doi: 10.1089/lrb.2023.0062. Epub 2024 Mar 28. Lymphat Res Biol. 2024. PMID: 38546398 Free PMC article. Review.
-
Semiautomated segmentation of lower extremity MRI reveals distinctive subcutaneous adipose tissue in lipedema: a pilot study.J Med Imaging (Bellingham). 2023 May;10(3):036001. doi: 10.1117/1.JMI.10.3.036001. Epub 2023 May 15. J Med Imaging (Bellingham). 2023. PMID: 37197375 Free PMC article.
-
The effect of a low-carbohydrate diet on subcutaneous adipose tissue in females with lipedema.Front Nutr. 2024 Nov 7;11:1484612. doi: 10.3389/fnut.2024.1484612. eCollection 2024. Front Nutr. 2024. PMID: 39574523 Free PMC article.
-
Response to "Comments on 'Subcutaneous Adipose Tissue Edema in Lipedema Revealed by Noninvasive 3T MR Lymphangiography'".J Magn Reson Imaging. 2024 Jan;59(1):353-354. doi: 10.1002/jmri.28720. Epub 2023 Apr 6. J Magn Reson Imaging. 2024. PMID: 37025019 Free PMC article. No abstract available.
References
-
- Pouwels S, Huisman S, Smelt HJM, Said M, Smulders JF. Lipoedema in patients after bariatric surgery: report of two cases and review of literature. Clin Obes 2018;8(2):147–150. - PubMed
Publication types
MeSH terms
Grants and funding
- T32 EB001628/EB/NIBIB NIH HHS/United States
- R01 NR015079/NR/NINR NIH HHS/United States
- 18CDA34110297/AHA/American Heart Association-American Stroke Association/United States
- S10 OD021771/OD/NIH HHS/United States
- 19IPLOI34760518/AHA/American Heart Association-American Stroke Association/United States
- R01 HL157378/HL/NHLBI NIH HHS/United States
- 18SFRN33960373/AHA/American Heart Association-American Stroke Association/United States
- R01 HL155523/HL/NHLBI NIH HHS/United States
- UL1 TR002243/TR/NCATS NIH HHS/United States
- K23 HL151871/HL/NHLBI NIH HHS/United States
- 1R01HL155523/HL/NHLBI NIH HHS/United States
- 1R01HL157378/HL/NHLBI NIH HHS/United States
- K23HL151871/HL/NHLBI NIH HHS/United States
- R01NR015079/NR/NINR NIH HHS/United States
- 1S10OD021771-01/NH/NIH HHS/United States
- 5UL1TR002243-03/NH/NIH HHS/United States
- T32EB001628/NH/NIH HHS/United States
LinkOut - more resources
Full Text Sources
Medical
Research Materials
